. 2024 Jul 16;15(1):5964.
doi: 10.1038/s41467-024-50169-4.

Rapid meiotic prophase chromosome movements in Arabidopsis thaliana are linked to essential reorganization at the nuclear envelope

Affiliations

Rapid meiotic prophase chromosome movements in Arabidopsis thaliana are linked to essential reorganization at the nuclear envelope

Laurence Cromer et al. Nat Commun. .

Abstract

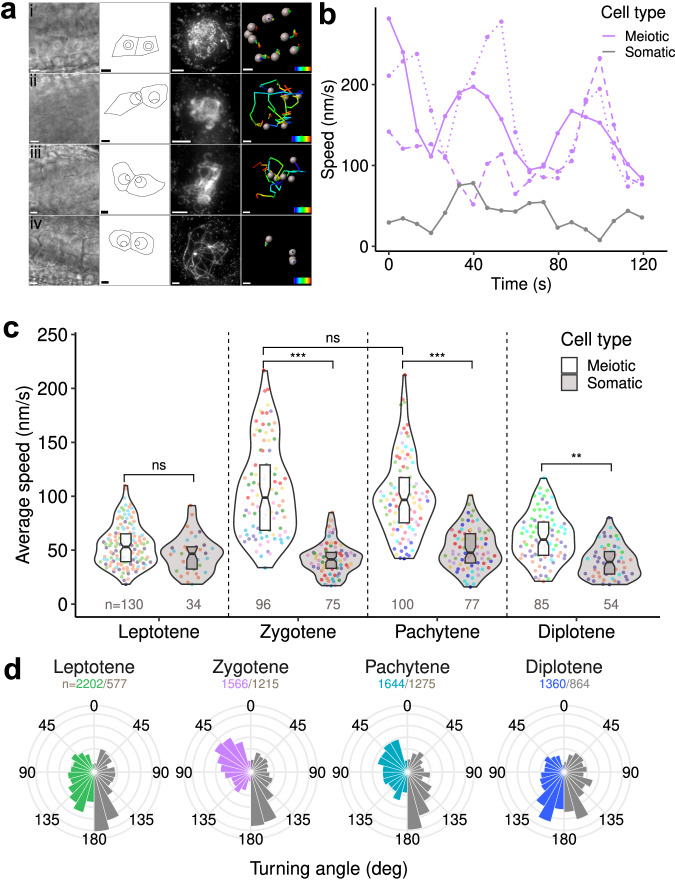
Meiotic rapid prophase chromosome movements (RPMs) require connections between the chromosomes and the cytoskeleton, involving SUN (Sad1/UNC-84)-domain-containing proteins at the inner nuclear envelope (NE). RPMs remain significantly understudied in plants, with respect to their importance in the regulation of meiosis. Here, we demonstrate that Arabidopsis thaliana meiotic centromeres undergo rapid (up to 500 nm/s) and uncoordinated movements during the zygotene and pachytene stages. These centromere movements are not affected by altered chromosome organization and recombination but are abolished in the double mutant sun1 sun2. We also document the changes in chromosome dynamics and nucleus organization during the transition from leptotene to zygotene, including telomere attachment to SUN-enriched NE domains, bouquet formation, and nucleolus displacement, all of which were defective in sun1 sun2. These results establish A. thaliana as a model species for studying the functional implications of meiotic RPMs and demonstrate the mechanistic conservation of telomere-led RPMs in plants.


Conflict of interest statement

The authors declare no competing interests.

Figures

Fig. 1
Fig. 1. Centromere tracking in anthers.
ac Global views of an anther expressing GFP-CENH3 (green) and REC8-RFP (magenta). Each image represents a maximum-intensity projection of a single z-stack, corresponding to one time frame (t = 0). a Overlay of both signals. b GFP-CENH3 signal alone (green). c REC8-RFP signal alone (magenta) showing the meiocyte nuclei (marked with an asterisk). The signal observed at the edge of the anther corresponds to background fluorescence from the chloroplasts of the somatic cells surrounding the meiocytes (hashtag). d Reconstruction of the centromere trajectories after 12 min acquisition. The colour code corresponds to elapsed time (from 0 to 723 s). e Close-up view of a subset of centromeres from the above acquisition. Images are maximum-intensity projections of selected time-lapse images. The chosen area contains meiotic centromeres (colocalizing with the REC8-RFP signal) and several adjacent somatic centromeres. For each time frame, we present the overlay between the GFP-CENH3 (in green) and REC8-RFP (in magenta) (top panel) and the reconstructed trajectories of the centromeres (bottom panel). ad Scale bars: 30 µm. e Scale bars: 1 µm. For 4D movie stack images, please refer to Supplementary Movies 1 and 2.
Fig. 2
Fig. 2. Quantification of centromere motion in meiotic and somatic anther cells.
a Imaging and reconstruction of 3D centromere tracks in meiocytes at leptotene (i), zygotene (ii), pachytene (iii), and diplotene (iv) stages. First column: brightfield image; second column: schematic representation of the cellular outlines, nuclei and nucleoli for two meiocytes from the brightfield image; third column: DAPI staining; fourth column: one meiocyte centromere tracks represented with pseudo-colour to indicate time progression (time scale bar: 2 min). Spatial scale bars for brightfield, outlines, and DAPI: 5 µm; tracking: 1 µm. b Instant speed as a function of time along individual tracks at zygotene stage. Coloured curves correspond to the speed measured along three individual tracks from a same meiocyte. Different styles (dashed or dotted lines) are used to distinguish the different tracks. Grey curve corresponds to the speed of along a somatic centromere track from the same anther. c Distribution of average speed in meiotic and somatic anther nuclei at each meiotic stage. Boxplots indicate median values and interquartile ranges. Dot colour indicates the tracks from the same anther. Horizontal brackets show the result of pairwise comparisons (Mixed-effects model, with anther and cell as nested random factors, likelihood ratio test; p values of meiotic/somatic comparisons were p = 0.19 (leptotene), 1.8e-06 (zygotene), 3.6e-06 (pachytene), 0.003 (diplotene); p = 0.73 for the comparison between meiotic average speed in zygotene and pachytene). Per-meiocyte average speed in individual anthers are shown in Supplementary Fig. 2. Boxplots extend from the first to the third quartiles of the distribution, with the middle line indicating the median value. ns: non-significative difference; **P < 0.01; ***P < 0.001. Numbers indicate numbers of analyzed tracks. d Distribution histograms of the instant turning angle along centromere tracks in meiotic (colour) and somatic (grey) anther cells at each meiotic stage. Histograms are normalized to unit area. Numbers correspond to the instant steps included in these analyses. Source data are provided as a Source Data file.
Fig. 3
Fig. 3. Quantification of centromere trajectories and correlations between trajectories.
a Mean square displacement (MSD) curves for the different meiosis stages computed over short tracks (total duration 2 min). Control MSD (somatic centromeres) are shown in Supplementary Fig. 3. Error bars: average ± s.e.m. Numbers of tracks: 130 (leptotene), 96 (zygotene), 99 (pachytene), 85 (diplotene). b Average MSD curve (Black) computed over long tracks (total duration 10 min; N = 72 tracks) at the zygotene stage. Grey envelope: average ± s.e.m. Magenta: least-square fit of the confined diffusion model. c Distribution of the outreach ratio in meiotic and somatic nuclei during meiosis. Numbers indicate numbers of analyzed tracks. Horizontal brackets show the result of pairwise comparisons (mixed-effects model, with anther and cell as nested random factors, likelihood ratio test; p values of meiotic/somatic comparisons were p = 0.03 (leptotene), 1.4e-06 (zygotene), 1.6e-05 (pachytene), 0.75 (diplotene); p = 0.44 for the comparison between meiotic outreach ratio in zygotene and pachytene). Boxplots extend from the first to the third quartiles of the distribution, with the middle line indicating the median value. ns: non-significative difference; *P < 0.05; ***P < 0.001. d Parameters for describing individual and collective shapes of motion. The outreach ratio is determined by the maximal displacement over the length of the cell track segment. At time t, the centroid size is defined as the root mean-squared distance between the positions of centromeres [pit,1i#centromeres] and their average position [ci(t)] at that time. e Distribution of speed cross-correlation between centromere tracks within meiocytes. Horizontal brackets show the result of comparisons between successive stages (mixed effect model with anther and cell as nested random factors ns: non-significant difference; P = 0.03 (leptotene/zygotene), 0.01 (zygotene/pachytene), 0.74 (pachytene/diplotene). Each point represents a pair of tracks from the same meiocyte. Numbers give the number of pairs at each stage. Boxplots extend from the first to the third quartiles of the distribution, with the middle line indicating the median value. *P < 0.05. f Temporal dynamics of centroid size for centromere configurations within meiocytes. Each curve displays the difference between the centroid size at any time step and the centroid size at time 0. At each stage, the four curves correspond to one somatic cell (Grey) and three meiocytes (Colour) from the same anther. Source data are provided as a Source Data file.
Fig. 4
Fig. 4. Quantification of centromere motions in mutant meiocytes.
a Reconstructed 3D tracks in wild-type meiocyte (wt, M), wild-type somatic cell (Wt, S), and mutant meiocytes (2 min acquisitions). Colour code corresponds to elapsed time. Scale bar: 2 µm. b Distribution of average speed in wild-type (Grey) and mutant (Black) nuclei at zygotene-pachytene stage. Numbers indicate the number of analyzed tracks. Results of pairwise comparisons between meiotic tracks in each mutant and wild-type are indicated as ns (p < 0.05), and ** (p < 0.01) (mixed-effects model, with anther and cell as nested random factors, likelihood ratio test for mutant/wt comparison: p = 0.18 (asy1), 0.92 (asy3), 0.43 (rec8), 0.81 (zyp1ab), 0.51 (spo11-1), 0.60 (dmc1), 0.45 (hei10), 0.36 (fancM), 0.002 (sun1 sun2)). Boxplots extend from the first to the third quartiles of the distribution, with the middle line indicating the median value. c Distribution histograms of the instant turning angle along centromere tracks in wild-type and mutant meiotic nuclei at zygotene-pachytene stage. Histograms are normalized to unit area. Numbers correspond to the instant steps included in the analysis. d Mean square displacement (MSD) curves computed over short tracks (total duration 2 min) in wild-type nuclei at zygotene or pachytene stages and in mutant nuclei at zygotene/pachytene. Error bars: average ± s.e.m. Numbers of tracks: 96 (wt/zygotene), 99 (wt/pachytene), 65 (sun1 sun2). For each mutant, we analyzed between 3 and 7 anther locules and between 2 and 3 meiocytes per locule. Source data are provided as a Source Data file.
Fig. 5
Fig. 5. Nuclear envelop reorganization during meiotic prophase in living anthers.
a Single z-stack acquisitions of male meiocyte nuclei expressing SUN1-GFP, NUP54-RFP, and GFP-CENH3 at different stages. Images in the left column are maximum-intensity projections of the z-stacks (3D views). Images in the other columns are single z slices. At early leptotene (EL), SUN1-GFP and NUP54-RFP signals overlap at the nuclear envelope. The centromeres (bright GFP signals) are detected close to the nuclear envelope. At zygotene (Z) and pachytene (P), the SUN1-GFP and NUP54-RFP signals occupy complementary regions of the nuclear envelope. Centromeric signals can be observed in the nucleoplasm but no longer at the nuclear periphery. At diplotene (D), SUN1-GFP and NUP54-RFP signals progressively resume their initial positions, with centromeric signals still observed in the nucleoplasm. Scale bars: 1 µm. White arrows indicate SUN1 threads. b Maximum-intensity projections of a selection of time-lapse images of a meiocyte nucleus expressing SUN2-GFP, NUP54-RFP, and GFP-CENH3. For each time frame, we show the overlay between the green signals (GFP-CENH3 and SUN2-GFP) and the magenta signal (NUP54-RFP). The last panel shows the reconstructed trajectories of the centromeres, which reveal a clear displacement of the centromeres over the acquisition period. On the contrary, SUN2-GFP and NUP54-RFP signals remain in the same positions, indicating that centromere displacement is not accompanied by nuclear rotation. Refer to Supplementary Movie 7 for the 4D movie stack images. Scale bars: 2 µm.
Fig. 6
Fig. 6. SUN1 and SUN2 dynamics during male meiotic prophase.
a Co-immunostaining of SUN1 and SUN2 (SUN) with REC8 and HEI10 on 3D-preserved male meiocytes. The HEI10 signal is used to determine the meiocyte developmental stages: no HEI10 signal is detected in early and late leptotene (EL and LL, respectively), HEI10 signal is linear at zygotene (Z) and pachytene (P) where it loads on synapsed regions. At diplotene (D), HEI10 forms bright foci corresponding to class I COs. All images correspond to maximum-intensity projections of the whole z-stacks. SUN aggregates are indicated by hashtags (#) (stretches) or asterisks (clumps); SUN depletion by arrows. See Supplementary Fig. 6 for individual signals. Scale bar: 1 μm except for LL1 (2 μm). b Different views of the LL2 late leptotene cell (i–iv) and of the zygotene cell (v–vi) from a to illustrate SUN1 and SUN2 accumulation at regions where chromosome ends are detected. i: Maximum projection intensity of the late leptotene LL2 cell z-stack. Scale bar: 1 μm. ii–iv: Close up views on numerated areas of i (maximum projection intensity of a subset of the stack). Scale bar: 0.5 μm. v: Maximum projection intensity of the zygotene cell z-stack. Scale bar: 1 μm. vi: Close up view of a zone of the NE where chromosome extremities are detected. Scale bar: 0.5 μm. Refer to Supplementary Movie 8 (LL2 nucleus) and Supplementary Movie 9 (Z nucleus) for the 3D views of both nuclei with telomere identification.
Fig. 7
Fig. 7. Lamina reorganisation during meiotic prophase.
a, b Maximum-intensity projections of leptotene anthers expressing CRWN1-YFP or CRWN2-YFP (respectively). c, d Maximum-intensity projections of mid-prophase anthers expressing CRWN1-YFP and CRWN2-YFP (respectively). Scale bars: 10 µm. At early stage (Leptotene, a and b), CRWN1-YFP and CRWN2-YFP label the nuclear envelopes of all cells within the anthers (meiotic and somatic). In older anthers (zygotene or pachytene stages, c and d), the CRWN1-YFP and CRWN2-YFP disappear from the meiocyte nuclei. Dotted lines surround the meiocyte compartment of the anthers.
Fig. 8
Fig. 8. Telomeres dynamics in A. thaliana prophase.
a Immunostaining of male meiocytes at different developmental stages using anti-ASY1 or anti-REC8 in conjunction with anti-ZYP1. b Telomeres (grey spots) and nuclear periphery segmentation (transparent spheres) on nuclei from a. c Colouring of telomere spots according to their distance to the nuclear periphery surface. d Colouring of telomere spots based on their level of clustering. The spots corresponding to the chromosome extremities of the NOR-bearing chromosomes (chromosomes 2 and 4) were removed from the quantification. Examples of the identification of the NOR-bearing chromosomes can be seen on Supplementary Fig. 8. Doted lines indicate the clustered telomeres (bouquet). a, b Maximum-intensity projections. Separate channels can be viewed in Supplementary Fig. 7 and 3D view animations in Supplementary Movies 10–12. ad Scale bars: 2 μm e Histogram illustrating the percentage of detected telomeres located at the periphery of the meiocytes (filled bars) or within the nucleoplasm (empty bars) at different developmental stages, in wild type or in sun1 sun2 double mutant (zygotene and pachytene-like cells). f Histogram showing the percentage of cells with (filled bars) or without (empty bars) a bouquet of telomeres at the nuclear periphery. A bouquet is defined here as a minimum of 6 chromosome ends (out of 16) clustered at the nuclear periphery. The chromosome ends from the short arms of chromosomes 2 and 4 are not considered for bouquet quantification because their behaviour is modified by their link with the nucleolus (NOR-containing arms). g Violin plot showing the number of telomeres detected within the bouquet (cells without a bouquet are indicated at zero). The violin plot indicates median values (cyan lines) and interquartile ranges (red lines). h Plot showing the relationship between the area occupied by the bouquet (as a percentage of the NE area) and the number of telomeres in the bouquet. Cells without a bouquet are not shown. i Histogram showing the proportion of cells with a peripheral (filled bars) versus an internal (empty bars) nucleolus. EL Early Leptotene, LL Late Leptotene, Z Zygotene, P Pachytene, D diplotene, Bqt bouquet. Numbers indicate the number of cells analyzed. Source data are provided as a Source Data file.
Fig. 9
Fig. 9. Telomere and nucleolus dynamics in sun1 sun2 double mutant.
Immunostaining of 3D-preserved male meiocytes of sun1 sun2 mutant against REC8 (magenta) and ZYP1 (yellow). In sun1 sun2, 50% of the cells exhibit a peripherical nucleolus (a) similar to wild type (see Supplementary Fig. 10), and the remaining 50% show an internally-located nucleolus (b). Telomere positions (chromosome ends) are indicated by spots (ii–ix), the location of the nuclear periphery by a large transparent sphere (ii, vii-ix), and the position of the nucleolus by a small transparent sphere (iii, v–vi, viii–ix). The colouring of the telomere spots is done either according to their clustering level (ii–vi) or to their distance to the nuclear periphery surface (vii–ix). Colour codes for telomere colouring are shown on the left of their respective panels. i–iii: Maximum-intensity projection of the z-stacks. iv–vi: Maximum-intensity projection of variable number of z slices (as depicted in the schema at the top left of each panel, iv = z 1–10, v = z 1–30, vi = z 30). vii–ix: Chromosome ends, nuclear periphery and nucleolus segmentation from different perspectives. Separate channels and 3D movie stack images are available in Supplementary Fig. 9 and Supplementary Movies 13–14. Scale bars: 2 μm.

References

    1. Zickler D, Kleckner N. Meiosis: dances between homologs. Annu. Rev. Genet. 2023;57:1–63. doi: 10.1146/annurev-genet-061323-044915. - DOI - PubMed
    1. Zickler D, Kleckner N. The leptotene-zygotene transition of meiosis. Annu. Rev. Genet. 1998;32:619–697. doi: 10.1146/annurev.genet.32.1.619. - DOI - PubMed
    1. Alleva B, Smolikove S. Moving and stopping: regulation of chromosome movement to promote meiotic chromosome pairing and synapsis. Nucleus. 2017;8:613–624. doi: 10.1080/19491034.2017.1358329. - DOI - PMC - PubMed
    1. Zetka M, Paouneskou D, Jantsch V. The nuclear envelope, a meiotic jack-of-all-trades. Curr. Opin. Cell Biol. 2020;64:34–42. doi: 10.1016/j.ceb.2019.12.010. - DOI - PubMed
    1. Kim HJ, Liu C, Dernburg AF. How and why chromosomes interact with the cytoskeleton during meiosis. Genes. 2022;13:901. doi: 10.3390/genes13050901. - DOI - PMC - PubMed

LinkOut - more resources