. 2024 Jul 17;15(1):5994.
doi: 10.1038/s41467-024-50225-z.

ARID1A safeguards the canalization of the cell fate decision during osteoclastogenesis

Affiliations

ARID1A safeguards the canalization of the cell fate decision during osteoclastogenesis

Jiahui Du et al. Nat Commun. .

Abstract

Chromatin remodeler ARID1A regulates gene transcription by modulating nucleosome positioning and chromatin accessibility. While ARID1A-mediated stage and lineage-restricted gene regulation during cell fate canalization remains unresolved. Using osteoclastogenesis as a model, we show that ARID1A transcriptionally safeguards the osteoclast (OC) fate canalization during proliferation-differentiation switching at single-cell resolution. Notably, ARID1A is indispensable for the transcriptional apparatus condensates formation with coactivator BRD4/lineage-specifying transcription factor (TF) PU.1 at Nfatc1 super-enhancer during safeguarding the OC fate canalization. Besides, the antagonist function between ARID1A-cBAF and BRD9-ncBAF complex during osteoclastogenesis has been validated with in vitro assay and compound mutant mouse model. Furthermore, the antagonistic function of ARID1A-"accelerator" and BRD9-"brake" both depend on coactivator BRD4-"clutch" during osteoclastogenesis. Overall, these results uncover sophisticated cooperation between chromatin remodeler ARID1A, coactivator, and lineage-specifying TF at super-enhancer of lineage master TF in a condensate manner, and antagonist between distinct BAF complexes in the proper and balanced cell fate canalization.


Conflict of interest statement

The authors declare no competing interests.

Figures
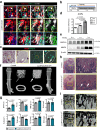
Fig. 1
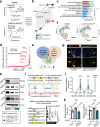
Fig. 1. Loss of Arid1a in myeloid lineage leads to excessive bone mass.
a Immunofluorescence staining of ARID1A and CTSK in the distal femur of 4-week-old LysM-Cre;tdT mouse. Arrows indicate LysM+ myeloid lineage ARID1A + CTSK+ osteoclasts (OCs). Scale bar, 100 μm. b Schema for osteoclastic differentiation stages of BMCs in vitro. Bone marrow cells, BMCs. c Immunofluorescence staining of ARID1A and TRAP staining in BMCs after 3 days of RANKL-induction. Yellow boxes are shown at higher magnification on the right. The dashed line outlines the cell boundaries of OCs. Scale bar, 100 μm. d Arid1a mRNA expression in BMCs at indicated days after RANKL-induction, as measured by qPCR. n = 3 biologically independent samples. e ARID1A and MMP9 protein expression in BMCs at indicated days after RANKL-induction, as measured by western blot. f Representative micro-CT image of the distal trabecular bone and cortical bone of femurs from 3-month-old male LysM-Cre;Arid1afl/fl mice and littermate control mice. Thicker arrows indicate the increased bone mass. Scale bar, 2 mm. g Quantification analysis of bone volume/tissue volume ratio (BV/TV), porosity percent (Po), bone mineral density (BMD), trabecular number (Tb.N), trabecular separation (Tb.Sp) and trabecular thickness (Tb.Th) of the distal femoral trabecular bone, mean total crossectional bone area (B. Ar) and mean total crossectional bone perimeter (B. Pm) of cortical bone in the femoral midshaft from 3-month-old male LysM-Cre;Arid1afl/fl mice and littermate control male mice. n = 7. h H&E staining of femurs from 3-week-old male LysM-Cre;Arid1afl/fl mice and littermate control mice. Thicker arrows indicate the increased bone mass. Scale bar, 200 μm. i Von Kossa staining of mesial tibias from 6-week-old male LysM-Cre;Arid1afl/fl mice and littermate control mice. The box in the left panel is shown at a higher magnification on the right. Thicker arrows indicate the increased bone mass. Scale bar, 200 μm. All data in this figure are represented as mean ± SD. One-way analysis of variance (ANOVA) with Tukey’s multiple comparisons test for d. Two-tailed Student’s t-test for g. All experiments were performed in triplicates unless otherwise stated. Source data and exact p values are provided in the Source data file.
Fig. 2
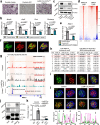
Fig. 2. Loss of Arid1a in myeloid lineage leads to compromised OC lineage commitment.
a TRAP staining (red) and b osteoclastic surface quantification, c toluidine blue staining and d osteoblastic surface quantification, e GRB staining and f osteoid surface quantification, g safranin O/fast green staining and h quantification of persistence of unresorbed calcified cartilage of distal femoral trabecular bone from 3-week-old male LysM-Cre;Arid1afl/fl mice and littermate control mice. The box on the left is shown at a higher magnification on the right. Scale bar, 100 μm. n = 6 biologically independent samples in b and d; n = 5 biologically independent samples in f and h. i TRAP staining and quantification analysis of BMCs from 4-week-old male LysM-Cre;Arid1afl/fl mice and littermate control mice after RANKL-induction. Scale bar, 100 μm. n = 5 biologically independent samples. j The mRNA expression of osteoclastic-specific genes of Ctsk, Mmp9, Acp5, Dcstamp, and Ocstamp in BMCs from 4-week-old male LysM-Cre;Arid1afl/fl mice compared with that from control littermates after RANKL-induction, as measured by qPCR. n = 4 biologically independent samples. k The protein expression of ARID1A, MMP9, and CTSK in BMCs from 4-week-old male LysM-Cre;Arid1afl/fl mice compared with that from control littermates after RANKL-induction, as measured by western blot. All data in this figure are represented as mean ± SD. Two-tailed Student’s t-test for b, d, f, h, i and j. All experiments were performed in triplicates unless otherwise stated. Source data and exact p values are provided in the Source data file.
Fig. 3
Fig. 3. ARID1A transcriptionally safeguards the OC fate canalization during proliferation-differentiation switching.
a Schematic workflow of single-cell mRNA-sequencing experiments. b Uniform manifold approximation and projection (UMAP) visualization of 11 clusters in the OC culture system, representing four major different cell types based on known differentiation marker genes expression, as shown in the dot plot c. d UMAP plot comparison and change of the proportion of each cell cluster between the control group and LysM-Cre;Arid1afl/fl group. e Pseudotime analysis showing the OC differentiation process passing through stepwise states. Left: Pseudotime trajectory colored by timeline; Right: pseudotime trajectory colored by cell states. f The dynamic expression patterns of signature genes during the trajectory of osteoclastogenesis by cell states. g Pseudotime trajectories of the control group and LysM-Cre;Arid1afl/fl group. h Immunofluorescence and quantification of CTSK (white) and visualization of EdU (green) and tdT (red) in the distal femur of 4-week-old male LysM-Cre;tdT mice and LysM-Cre;Arid1afl/fl;tdT mice. The Schematic at the top right indicates the EdU labeling protocol. The colored boxes in the first panel are enlarged below. Yellow boxes and arrows indicate Tdt+EdU+CTSK+ cells, referred to as cluster 4, and white boxes indicate Tdt+EdU-CTSK+ cells, referred to as cluster 3. Scale bar, 100 μm. n = 5 biologically independent samples. i Immunofluorescence and quantification of CTSK (red) or ACP5 (red) and visualization of EdU (green) in BMCs from 4-week-old male LysM-Cre;Arid1afl/fl mice and littermate control mice after RANKL-induction. The Schematic at the top right indicates the EdU labeling protocol. Yellow arrows indicate EdU+CTSK+ or EdU+ACP5+ cells. The asterisk indicates no signal. Scale bar, 100 μm. n = 5 biologically independent samples. All data in this figure are represented as mean ± SD. Two-tailed Student’s t-test for h and i. All experiments were performed in triplicates unless otherwise stated. Source data and exact p values are provided in the Source data file.
Fig. 4
Fig. 4. ARID1A activates Nfatc1 transcription at SE during proliferation-differentiation switching.
a Pseudotime trajectory colored by cell clusters. b PAGA graph showing trajectory colored by the timeline in upper and the proportion in the target cell cluster in lower. c Bar plot of the top 10 enriched KEGG pathways in cluster 4 between control and LysM-Cre;Arid1afl/f group. d Total H3K27Ac ChIP-seq signal in units of reads per million in enhancer regions for all enhancers in BMCs after RANKL-induction. e Venn diagram showing overlapping genes between ARID1A occupied, SE-associated genes with OC-associated DEGs after loss of Arid1a within cluster 4. f UMAP visualization of Nfatc1 expression in control and LysM-Cre;Arid1afl/fl group. g NFATc1 immunofluorescence and EdU visualization in RANKL-inducted BMCs from control and LysM-Cre;Arid1afl/fl mice. Yellow arrows indicate EdU+ NFATc1+ cells. Scale bar, 100 μm. h ARID1A, NFATc1, MMP9, and CTSK protein expressions in Nfatc1-overexpressed (OE) and control BMCs from control and LysM-Cre;Arid1afl/fl group after RANKL-induction. i Luciferase reporter activity driven by Nfatc1 promoter and enhancer elements. Gene tracks of H3K27Ac and ARID1A ChIP-seq occupancy at the super enhancer of Nfatc1 in RANKL-induced BMCs (top panel). Gray box indicates promoter region (Pro). Yellow boxes indicate the presentative enhancer regions upstream (E1) and downstream (E2 and E3). Data were normalized to Renilla internal control. n = 6 biologically independent samples. j 3C-qPCR analysis of interaction frequency percentage of the restriction fragments with the anchor point fixed near Nfatc1 promoter in 24 h RANKL-induced BMCs. The gray shadows highlight the regions containing E2 and E3 enhancer elements and the anchor point. n = 4 biologically independent samples. k Interaction frequency of the restriction fragments in E2, E3 with Nfatc1 promoter in BMCs from control and LysM-Cre;Arid1afl/fl mice with or without 24 h RANKL-induction. n = 3 biologically independent samples. Short-range ligation product used for normalizion for j, k. All data in this figure are represented as mean ± SD. One-way ANOVA with Dunnett’s multiple comparisons test for i, k. All experiments were performed in triplicates unless otherwise stated. Source data and exact p values are provided in the Source data file.
Fig. 5
Fig. 5. ARID1A activates Nfatc1 through constructing condensates with coactivator BRD4/lineage-specifying TF PU.1 at SE.
a TRAP staining of JQ1 or vector treated RANKL-induced BMCs from control and LysM-Cre;Arid1afl/fl group. Scale bar, 100 μm. b Mmp9, Acp5, Ctsk, and Dcstamp mRNA and c MMP9 and CTSK protein expressions in JQ1 or vector treated RANKL-induced BMCs from control and LysM-Cre;Arid1afl/fl group. n = 3 biologically independent samples. d Heatmap representation of ChIP-seq against ARID1A and BRD4 in ± 3 kb around the center of the ARID1A peak. e Nfatc1 mRNA expression in JQ1 or vector treated RANKL-induced BMCs from control and LysM-Cre;Arid1afl/fl group. n = 3 biologically independent samples. f BRD4 and ARID1A immunofluorescence in RANKL-induced BMCs. Yellow arrows indicate BRD4/ARID1A nuclear puncta. Scale bar, 5 μm. g Gene tracks of ARID1A, BRD4 and PU.1 ChIP-seq occupancy at Nfatc1 super enhancer in BMCs from control and LysM-Cre;Arid1afl/fl group before or after RANKL-induction. Gray box indicates the promoter region (Pro). The orange shadows highlight the regions containing enhancer elements. h Top 10 motifs enriched in ARID1A binding sites and ARID1A-dependent BRD4 binding sites which loss after ARID1A depletion. i PU.1 and ARID1A immunofluorescence in BMCs after RANKL-induction. Yellow arrows indicate PU.1/ARID1A nuclear puncta. Scale bar, 5 μm. j Co-IP assay with ARID1A antibody (or IgG) in BMCs during osteoclastic induction, followed by immunoblotting of ARID1A, BRD4, and PU.1. k ChIP-qPCR with PU.1 antibody (or IgG) in RANKL-induced BMCs from LysM-Cre;Arid1afl/fl (n = 3) and control mice (n = 6). The positions of the sets of primers used for the ChIP–qPCR are denoted in g. l Immunofluorescence and co-localization analysis of PU.1 and BRD4 in RANKL-induced BMCs from control and LysM-Cre;Arid1afl/fl group. Yellow arrows indicate PU.1/BRD4 nuclear puncta. Scale bar, 5 μm. All data in this figure are represented as mean ± SD. One-way ANOVA with Tukey’s multiple comparisons test for b and e. The one-tailed Fisher’s Exact test for h. Two-tailed Student’s t-test for k. All experiments were performed in triplicates unless otherwise stated. Source data and exact p values are provided in the Source data file.
Fig. 6
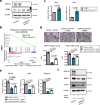
Fig. 6. Enhanced activity of ARID1A/BRD4/PU.1/NFATc1 axis contributes to the overactivated OC lineage determination after loss of Brd9.
a The protein expression of ARID1A, MMP9, and BRD9 in BMCs from 4-week-old male LysM-Cre;BRD9fl/fl mice and littermate control mice after RANKL-induction, as measured by western blot. b TRAP staining of Arid1a-siRNA or control-siRNA treated BMCs from 4-week-old male LysM-Cre;BRD9fl/fl mice and littermate control mice after RANKL-induction. Scale bar, 100 μm. c The mRNA expression of Mmp9, Acp5, and Dcstamp in Arid1a-siRNA or control-siRNA treated BMCs from 4-week-old male LysM-Cre;BRD9fl/fl mice and littermate control mice after RANKL-induction, as measured by qPCR. n = 3 biologically independent samples. d The protein expression of ARID1A, MMP9, and CTSK in Arid1a-siRNA or control-siRNA treated BMCs from 4-week-old male LysM-Cre;BRD9fl/fl mice and littermate control mice after RANKL-induction, as measured by western blot. e TRAP staining of JQ1 or control vector treated BMCs from 4-week-old male LysM-Cre;BRD9fl/fl mice and littermate control mice after RANKL-induction. Scale bar, 100 μm. f The mRNA expression of Mmp9 and Acp5 in JQ1 or control vector treated BMCs from 4-week-old male LysM-Cre;BRD9fl/fl mice and littermate control mice after RANKL-induction, as measured by qPCR. n = 4 biologically independent samples. g The protein expression and h immunofluorescence of NFATc1 or STAT1 in Arid1a-siRNA or control-siRNA treated BMCs from 4-week-old male LysM-Cre;BRD9fl/fl mice and littermate control mice after RANKL-induction. Yellow arrows indicate positive signals. Scale bar, 100 μm. i The protein expression and j immunofluorescence of NFATc1 or STAT1 in JQ1 or control vector treated BMCs from 4-week-old male LysM-Cre;BRD9fl/fl mice and littermate control mice after RANKL-induction. Yellow arrows indicate positive signals. Scale bar, 100 μm. All data in this figure are represented as mean ± SD. One-way ANOVA with Tukey’s multiple comparisons test for c and f. All experiments were performed in triplicates unless otherwise stated. Source data and exact p values are provided in the Source data file.
Fig. 7
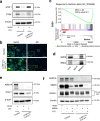
Fig. 7. Excessive activity of BRD9/STAT1 axis contributes to the compromised OC differentiation process after loss of Arid1a.
a The protein expression of ARID1A and BRD9 in BMCs from 4-week-old male LysM-Cre;Arid1afl/fl mice and littermate control mice after RANKL-induction, as measured by western blot. b GSEA analysis of DEG profiles in bulk RNA-seq between the control group and LysM-Cre;Arid1afl/f group. c The mRNA expression of Stat1 and Ifnb1 in BMCs from 4-week-old male LysM-Cre;Arid1afl/fl mice and littermate control mice after RANKL-induction, as measured by qPCR. n = 3 biologically independent samples. d TRAP staining and quantification analysis of iBRD9 or control vector treated BMCs from 4-week-old male LysM-Cre;Arid1afl/fl mice and littermate control mice after RANKL-induction. Scale bar, 100 μm. n = 5 biologically independent samples. e The mRNA expression of Mmp9, Acp5 and Dcstamp and in iBRD9 or control vector treated BMCs from 4-week-old male LysM-Cre;Arid1afl/fl mice and littermate control mice after RANKL-induction. n = 4 biologically independent samples for Mmp9 and Acp5. n = 3 biologically independent samples in Dcstamp. f The protein expression of ARID1A, MMP9, and CTSK in iBRD9 or control vector treated BMCs from 4-week-old male LysM-Cre;Arid1afl/fl mice and littermate control mice after RANKL-induction, as measured by western blot. All data in this figure are represented as mean ± SD. Two-tailed Student’s t-test for c. One-way ANOVA with Tukey’s multiple comparisons test for d and e. All experiments were performed in triplicates unless otherwise stated. Source data and exact p values are provided in the Source data file.
Fig. 8
Fig. 8. Brd9 heterozygous knockout partially rescues OC differentiation defects after loss of Arid1a in vivo.
a Representative micro-CT image and b quantification analysis of bone volume/tissue volume ratio (BV/TV), bone mineral density (BMD), trabecular separation (Tb.Sp), and trabecular number (Tb.N) of femurs from 3-month-old female LysM-Cre;Arid1afl/fl mice, LysM-Cre;Arid1afl/fl;BRD9fl/+ mice, and littermate control mice. Distal trabecular bone are enlarged on the lower panel. Scale bar, 2 mm. n = 5. c H&E staining and d quantification analysis of trabecular thickness (Tb.Th), Tb.N, and Tb.Sp of the distal femoral trabecular bone from 3-month-old female LysM-Cre;Arid1afl/fl mice, LysM-Cre;Arid1afl/fl;BRD9fl/+ mice, and littermate control mice. Scale bar, 200 μm. n = 6. e CTSK immunofluorescence (red) staining and f quantification analysis of the distal femoral trabecular bone from 3-month-old female LysM-Cre;Arid1afl/fl mice, LysM-Cre;Arid1afl/fl;BRD9fl/+ mice, and littermate control mice. n = 5. Scale bar, 200 μm. Yellow arrows indicate a positive signal. g The protein expression of ARID1A, STAT1, and BRD9 in BMCs from 4-week-old male LysM-Cre;Arid1afl/fl mice, LysM-Cre;Arid1afl/fl;BRD9fl/+ mice, and littermate control mice after RANKL-induction, as measured by western blot. h PAGA graph of cell clusters showing trajectory colored by the timeline and i the expression patterns of Nfatc1 and Stat1 during the trajectory of osteoclastogenesis. j bean plot of the different gene densities of Nfatc1 and Stat1 in cluster 4 between the control group and LysM-Cre;Arid1afl/f group. All data in this figure are represented as mean ± SD. One-way ANOVA with Tukey’s multiple comparisons test for b, d, and f. All experiments were performed in triplicates unless otherwise stated. Source data and exact p values are provided in the Source data file.
Fig. 9
Fig. 9. The antagonistic function of ARID1A and BRD9 both depend on BRD4 during osteoclastogenesis.
a The protein expression of STAT1 and CTSK and b STAT1 immunofluorescence (green) in JQ1 or control vector treated BMCs from 4-week-old male LysM-Cre;Arid1afl/fl mice and littermate control mice after RANKL-induction. c GSEA analysis of DEG profiles in bulk RNA-seq between JQ1 or control vector treated BMCs after RANKL-induction. d Co-IP assay with BRD9 antibody (or IgG) in BMCs during osteoclastic induction, followed by immunoblotting of BRD4 and BRD9. e The protein expression of ARID1A and STAT1 in JQ1 or control vector treated BMCs from 4-week-old male LysM-Cre;Arid1afl/fl mice and littermate control mice after RANKL-induction. f The protein expression of ARID1A, MMP9 and NFATc1 in JQ1, iBRD9 or control vector treated BMCs from 4-week-old male LysM-Cre;Arid1afl/fl mice and littermate control mice after RANKL-induction. All experiments were performed in triplicates unless otherwise stated. Source data are provided in the Source data file.

References

    1. Ferrell JE., Jr Bistability, bifurcations, and Waddington’s epigenetic landscape. Curr. Biol. 2012;22:R458–R466. doi: 10.1016/j.cub.2012.03.045. - DOI - PMC - PubMed
    1. Waddington, C.H. The strategy of the genes. (Routledge, 2014).
    1. Du Z, et al. The regulatory landscape of lineage differentiation in a metazoan embryo. Dev. Cell. 2015;34:592–607. doi: 10.1016/j.devcel.2015.07.014. - DOI - PMC - PubMed
    1. Centore RC, Sandoval GJ, Soares LMM, Kadoch C, Chan HM. Mammalian SWI/SNF chromatin remodeling complexes: emerging mechanisms and therapeutic strategies. Trends Genet. 2020;36:936–950. doi: 10.1016/j.tig.2020.07.011. - DOI - PubMed
    1. Chandler RL, et al. ARID1a-DNA interactions are required for promoter occupancy by SWI/SNF. Mol. Cell Biol. 2013;33:265–280. doi: 10.1128/MCB.01008-12. - DOI - PMC - PubMed

MeSH terms