. 2024 Jul 16;15(1):5829.
doi: 10.1038/s41467-024-49608-z.

A multiomic atlas of the aging hippocampus reveals molecular changes in response to environmental enrichment

Affiliations

A multiomic atlas of the aging hippocampus reveals molecular changes in response to environmental enrichment

Raúl F Pérez et al. Nat Commun. .

Abstract

Aging involves the deterioration of organismal function, leading to the emergence of multiple pathologies. Environmental stimuli, including lifestyle, can influence the trajectory of this process and may be used as tools in the pursuit of healthy aging. To evaluate the role of epigenetic mechanisms in this context, we have generated bulk tissue and single cell multi-omic maps of the male mouse dorsal hippocampus in young and old animals exposed to environmental stimulation in the form of enriched environments. We present a molecular atlas of the aging process, highlighting two distinct axes, related to inflammation and to the dysregulation of mRNA metabolism, at the functional RNA and protein level. Additionally, we report the alteration of heterochromatin domains, including the loss of bivalent chromatin and the uncovering of a heterochromatin-switch phenomenon whereby constitutive heterochromatin loss is partially mitigated through gains in facultative heterochromatin. Notably, we observed the multi-omic reversal of a great number of aging-associated alterations in the context of environmental enrichment, which was particularly linked to glial and oligodendrocyte pathways. In conclusion, our work describes the epigenomic landscape of environmental stimulation in the context of aging and reveals how lifestyle intervention can lead to the multi-layered reversal of aging-associated decline.


Conflict of interest statement

The authors declare no competing interests.

Figures
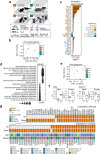
Fig. 1
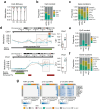
Fig. 1. Transcriptomic and proteomic signatures of aging in the dorsal hippocampus.
a Schematic of the study design. b PCA plot of the transcriptomic profiles across samples and groups. c Bar plot describing the measured aging log2(fold change) across a panel of murine brain aging markers from Ximerakis et al. (2019). The colour of the gene labels indicates up-regulation (orange) or down-regulation (blue) in the original publication. Bar plots are coloured with regards to p < 0.05 or p adj < 0.05 from two-sided Wald tests. d Bubble plot indicating the top 10 significant pathways (FDR < 0.05, one-sided Wallenius tests) found enriched for aging up- and down-regulated genes, in the Gene Ontology Biological Process database. The size of the bubbles indicates the odds ratio of enrichment. e PCA plot of the proteomic profiles across samples and groups. f Boxplots showing the expression measurements for the RNA-seq and SWATH-MS omic layers for the Gfap and Caprin1 genes across young and old subjects. RNA expression is shown in variance stabilizing transformation (VST) values, and protein expression is shown in log2-normalized values. (n = 6 for all groups; p adj < 0.05 across all data from two-sided Wald tests or moderated t-tests for RNA-seq and SWATH-MS data, respectively). All box plots shown indicate median value, interquartile range (IQR), up to 1.5 IQR (whiskers), and individual data points showing minimum and maximum value. g Heatmap showing significant (FDR < 0.05, LISA tests) regulators of aging-associated DEGs determined by LISA analysis using Cistrome brain-associated datasets.
Fig. 2
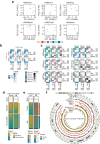
Fig. 2. Methylomic and chromatin accessibility signatures of aging in the dorsal hippocampus.
a Violin plots showing the distribution of EM-seq methylation measurements of CpG sites across groups. Plots are based on a 1 M sample of CpGs. b, c Bar plots describing the proportion of hyper- and hypomethylated aging-DMRs mapped to CpG island (b) or gene (c) locations, as compared to the distribution of all of the profiled CpG sites. d Genomic plots showing the DNA methylation profiling values in young and old subjects of two regions containing aging-DMRs (grey boxes) associated with the Cbln1 and Pink1 genes. Below, the tracks indicate the presence of gene exons, CpG islands and ENCODE murine forebrain P0 enhancer Pp elements. On the right of the plots, the boxplots indicate the RNA-seq expression measurements (VST units) for the Cbln1 and Pink1 genes across young and old subjects (n = 6 for all groups; p adj <0.05 for two-sided Wald tests across all data). All box plots shown indicate median value, interquartile range (IQR), up to 1.5 IQR (whiskers), and individual data points showing minimum and maximum value. e, f Bar plots describing the proportion of up- and down- aging-DARs mapped to CpG islands (e) or gene (f) locations, as compared to the distribution of the consensus peak set (“All”) or the whole genome (“Gen”, 200 bp bins). g Heatmaps showing the significant (FDR < 0.05, one-sided Fisher’s exact tests) LOLA enrichments in log2(odds ratio) of chromatin states associated with aging-DARs, either up-DARs defined with FDR < 0.05 (two-sided Wald tests) or up- and down-DARs defined with unadjusted p < 0.05 (two-sided Wald tests). The code for the ENCODE chromatin states shown is: Promoter, Active (Pr-A), Weak (Pr-W), Bivalent (Pr-B) and Flanking (Pr-F); Transcription, Strong (Tr-S), Permissive (Tr-P) and Initiation (Tr-I); Enhancer, Strong TSS-distal (En-Sd), Strong TSS-proximal (En-Sp), Weak (En-W), Poised TSS-distal (En-Pd) and Poised TSS-proximal (En-Pp); Heterochromatin, Polycomb-associated (Hc-P) and H3K9me3-associated (Hc-H); No significant signal (NS).
Fig. 3
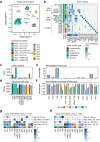
Fig. 3. Chromatin dysregulation of the dorsal hippocampus during aging.
a PCA plots of the epigenomic profiles involving the levels of H3K4me3, H3K4me1, H3K27ac, H3K36me3, H3K27me3 and H3K9me3 across samples and groups. Histone signal is quantified across a consensus peak set for each mark. b Heatmaps showing the log2-fold enrichment of significant intersections (FDR < 0.05 within each set for one-sided permutation regioneR tests) between ChIP-seq aging DERs and ATAC-seq aging DARs, filtered either at FDR < 0.05 or p-value < 0.05 (from two-sided Wald tests). c Heatmaps showing the log2-fold enrichment of significant intersections (FDR < 0.05 within each set for one-sided permutation regioneR tests) between the ChIP-seq aging DERs. DERs are filtered either at FDR < 0.05 or p-value < 0.05 (from two-sided Wald tests). d Heatmaps indicating the levels of H3K27me3 signal at aging DERs (FDR < 0.05, two-sided Wald tests) in young (left) and old (right) samples. The regions are grouped into those with overlapping bivalent domains (top) or not (bottom). Histone signal is represented with BigWig RPGC-normalized values (10 bp bins). e Heatmaps indicating the levels of H3K27me3 (left) and H3K9me3 (right) signal at aging chromatin switching regions, defined as the intersection between aging H3K27me3 up-DERs (FDR < 0.05, two-sided Wald tests) and aging H3K9me3 down-DERs (FDR < 0.05, two-sided Wald tests). The regions are represented for young (top) and old (bottom) samples. Histone signal is represented with BigWig RPGC-normalized values (10 bp bins). f Circos plot describing the distribution of various epigenomic marks across an aging heterochromatin switching genomic region (chr4:144233500-144601999) where global loss of H3K9me3 is coupled with a hotspot of H3K27me3 gains during aging. The “fold” tracks represent the difference in log-CPM values (500 bp bins) between old and young samples, where aging decreases in H3K9me3 and increases in H3K27me3 are coloured, while the opposite trend is coloured in grey.
Fig. 4
Fig. 4. Functional rejuvenation of the dorsal hippocampus in enriched environments.
a Bar plots indicating the total number of DEGs (FDR < 0.05, two-sided Wald tests) with increased or decreased levels in response to EE in young, old or all samples. b Bar plots describing the measured EE log2(fold change) across a panel of EE-associated DEG markers from Wassouf et al. (2018). Each column indicates the change for the effect of EE on all, young or old samples (two-sided Wald tests). The colour of the gene labels indicates up-regulation (orange) or down-regulation (blue) in the original publication. c Bubble plot showing the top 10 significant pathways (FDR < 0.05, one-sided Wallenius tests) found enriched for the top EE down-regulated DEGs (unadjusted p < 0.05, two-sided Wald tests) in the Gene Ontology Biological Process database. The size of the bubbles indicates the log2(odds ratio) of enrichment. d UpSet plot describing the intersections between aging and EEall DEGs (FDR < 0.05, two-sided Wald tests). e Violin plots showing the log2(fold change) values for the aging up- and down-DEGs (FDR < 0.05, two-sided Wald tests) and also, for the same sets of genes, the fold change values with EE (***p < 2.2e-16 for two-sided Wilcoxon rank sum tests). Box plots shown indicate median value, interquartile range (IQR), up to 1.5 IQR (whiskers), and have been cropped at their 2nd and 98th percentiles. f Bar plots indicating the total numbers of DEPs (FDR < 0.05, two-sided moderated t-tests) with increased or decreased levels in response to EE in young, old or all samples. g UpSet plot showing the intersections between aging and EEall DEPs (FDR < 0.05, two-sided moderated t-tests). h Violin plots describing the log2(fold change) values for the aging up- and down-DEPs (FDR < 0.05, two-sided moderated t-tests) and also, for the same sets of genes, the fold change values with EE (***p < 2.2e-16 for two-sided Wilcoxon rank sum tests). Box plots as described in (e). i, j Line plots showing the RNA-seq gene expression values (scaled VST units) of curated genes which show opposing aging and EE changes (i) or rejuvenation specifically in old subjects (j). Box plots shown indicate median value, interquartile range (IQR) and up to 1.5 IQR (whiskers), and individual data lines showing minimum and maximum value.
Fig. 5
Fig. 5. Epigenomic rejuvenation of the dorsal hippocampus in enriched environments.
a UpSet plots showing the intersections between aging and EEall ChIP-seq DERs (unadjusted p < 0.05, two sided Wald tests) for each histone modification. b Heatmap summarizing the significant (FDR < 0.05, one-sided Fisher’s exact tests) intersections between aging and EEall ChIP-seq DERs (unadjusted p < 0.05, two sided Wald tests) across all histone modifications. Significant intersections are coloured on the basis of their odds ratio. c Bar plots describing the numbers of curated DERs which display EE-associated rejuvenation of aging alterations in old samples. d Heatmap showing the significant intersections (FDR < 0.05 for one-sided permutation regioneR tests) between curated rejuvenation DERs and curated rejuvenation DEGs. Significant intersections are coloured by log2(fold enrichment). e, f Genomic plots indicating, in the upper panels, the distribution of epigenomic marks (5mC, ATAC-seq, histone post-translational modifications) across the bodies of the Pcdh15 (e) and Ror1 (f) genes. The measurements shown are either DNA methylation values for EM-seq profiled CpGs or log-CPM values (200 bp bins and normalized to [0–1] scale) for ATAC-seq and ChIP-seq, while the lower tracks represent genes, CpG Islands and ENCODE murine forebrain P0 enhancer elements. Below, highlighted from the upper plots are regions curated as rejuvenated in old samples, and the log-CPM values are shown across the groups accompanied by the difference in log-CPM between old samples and the rest of samples. Finally, the bottom boxplots show the RNA-seq and ChIP-seq values for the gene and the whole region in VST units (n = 3 for all RNA-seq groups and n = 2 for all ChIP-seq groups, the reju-DERs and reju-DEGs were defined as stated in Methods). All box plots shown indicate median value, interquartile range (IQR), up to 1.5 IQR (whiskers), and individual data points showing minimum and maximum value.
Fig. 6
Fig. 6. The single-cell dynamics of aging and environmental enrichment in the dorsal hippocampus.
a Dimensional reduction plot showing the distribution of cells, labelled by major cell type annotations for the multimodal WNN UMAP reduction (NEU: neuron; OLG: oligodendrocyte; OPC: oligodendrocyte progenitor; ASC: astrocyte; MIG: microglia; END: endothelial cell; PER: pericyte; VLM: vascular and leptomeningeal cell). b Heatmap describing the mean gene expression values ([0–1] row-normalized SCTransform units) within each cell type annotation across a representative panel of marker genes. c, d Bar plots showing the total numbers of profiled cells (c) and detected genes (d), segregated by cell type (“L5/6, SUB” contains NP L5/6, PT L5 and SUB cells). e, f Bar plots indicating the percentages (e) or normalized percentages (by maximum value for each cell type) (f) of cell type counts across each cell type and experimental group. g Heatmap describing the significant intersections (FDR < 0.05, one-sided permutation tests) between top (unadjusted p < 0.05, two-sided likelihood ratio tests) scRNA-seq DEGs for the aging and EE comparisons (using all samples) across each cell type. Significant intersections are colour-coded according to fold enrichment. h Heatmap indicating the significant intersections (FDR < 0.05, one-sided permutation tests) between top (unadjusted p < 0.05, two-sided likelihood ratio tests) scATAC-seq DERs for the aging and EE comparisons (using all samples) across each cell type. Significant intersections are colour-coded according to by fold enrichment.

References

    1. Franceschi C, et al. The continuum of aging and age-related diseases: common mechanisms but different rates. Front. Med. 2018;5:61. doi: 10.3389/fmed.2018.00061. - DOI - PMC - PubMed
    1. Kivipelto M, Mangialasche F, Ngandu T. Lifestyle interventions to prevent cognitive impairment, dementia and Alzheimer disease. Nat. Rev. Neurol. 2018;14:653–666. doi: 10.1038/s41582-018-0070-3. - DOI - PubMed
    1. Anguera JA, et al. Integrated cognitive and physical fitness training enhances attention abilities in older adults. Npj Aging. 2022;8:12. doi: 10.1038/s41514-022-00093-y. - DOI - PMC - PubMed
    1. Stern Y. Cognitive reserve in ageing and Alzheimer’s disease. Lancet Neurol. 2012;11:1006–1012. doi: 10.1016/S1474-4422(12)70191-6. - DOI - PMC - PubMed
    1. Qiu C, Fratiglioni L. Aging without dementia is achievable: current evidence from epidemiological research. J. Alzheimers Dis. JAD. 2018;62:933–942. doi: 10.3233/JAD-171037. - DOI - PMC - PubMed

LinkOut - more resources