. 2024 Jul 16;15(1):5960.
doi: 10.1038/s41467-024-50313-0.

Controlled human hookworm infection remodels plasmacytoid dendritic cells and regulatory T cells towards profiles seen in natural infections in endemic areas

Affiliations

Controlled human hookworm infection remodels plasmacytoid dendritic cells and regulatory T cells towards profiles seen in natural infections in endemic areas

Mikhael D Manurung et al. Nat Commun. .

Abstract

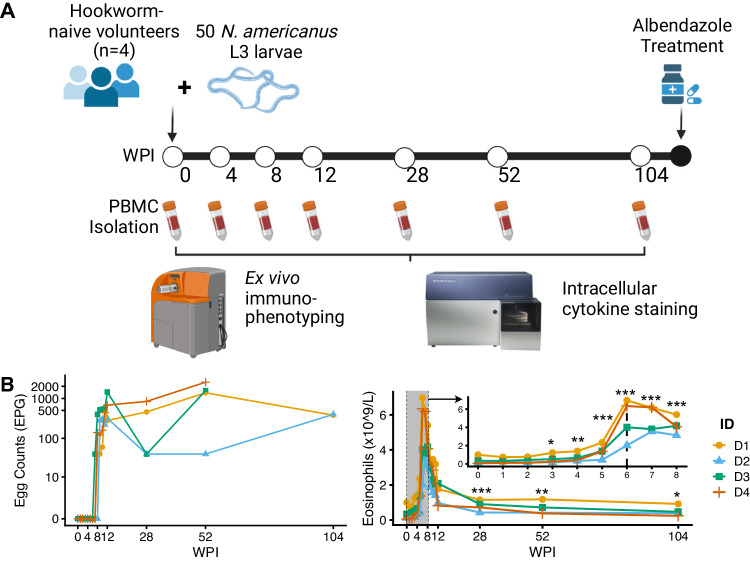
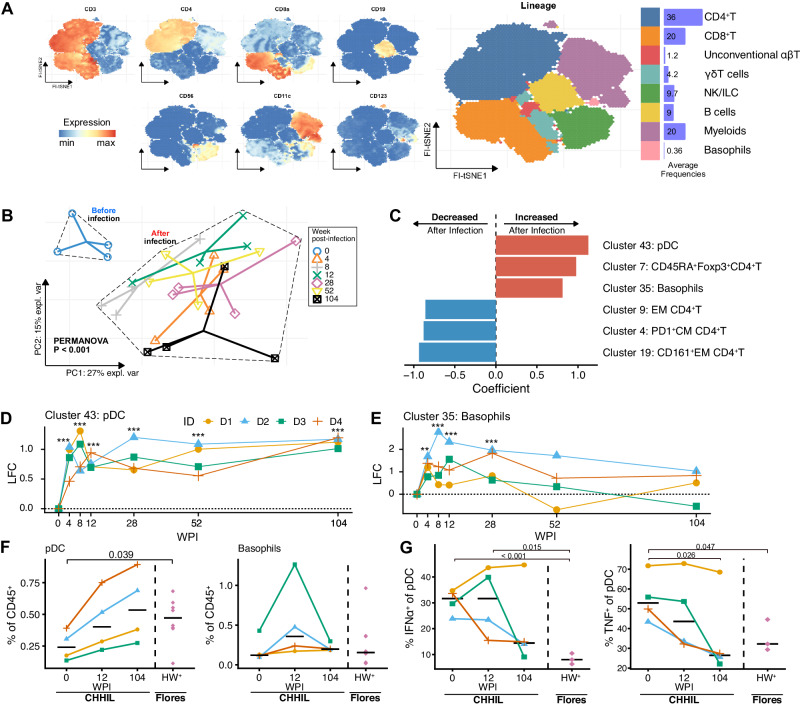
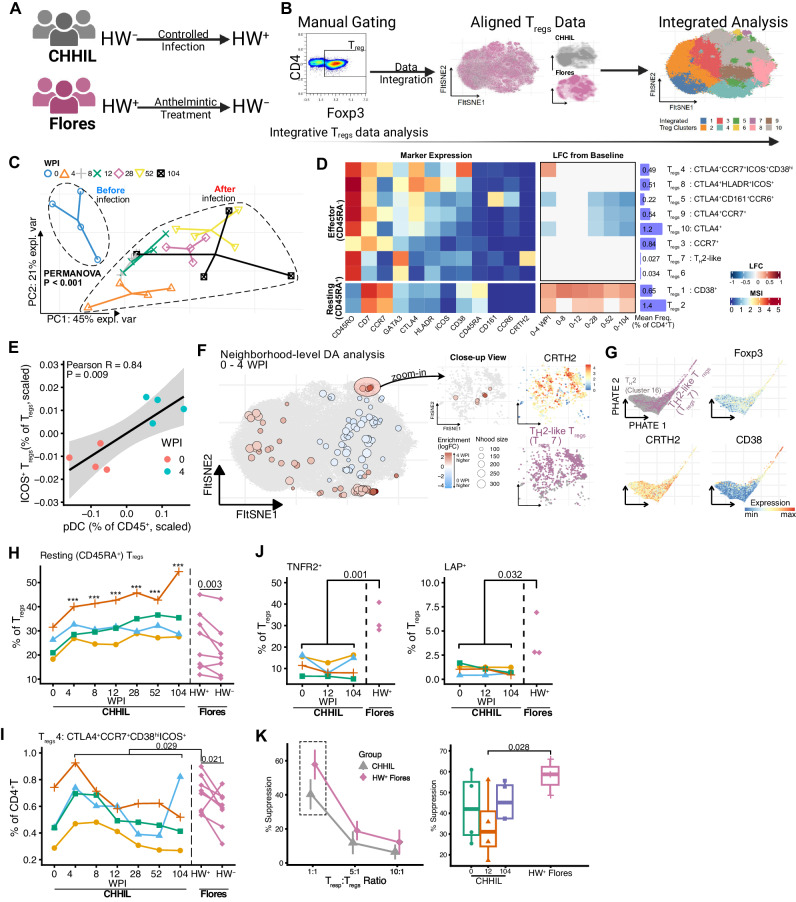
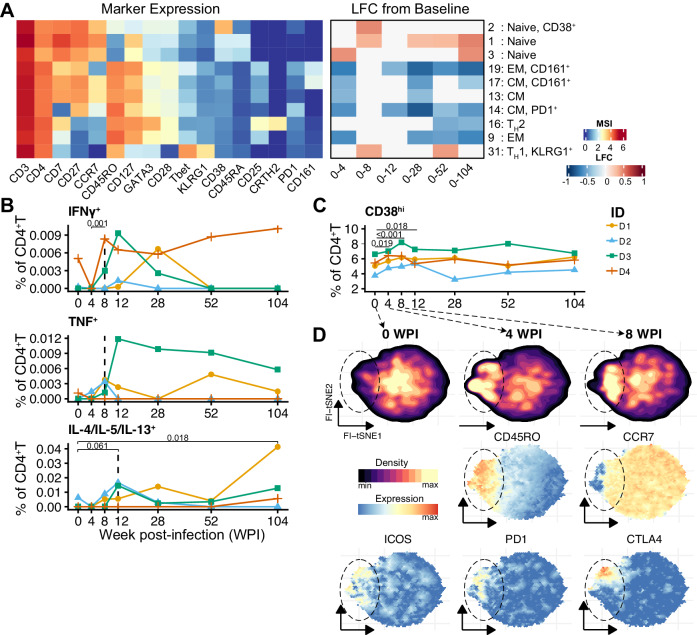
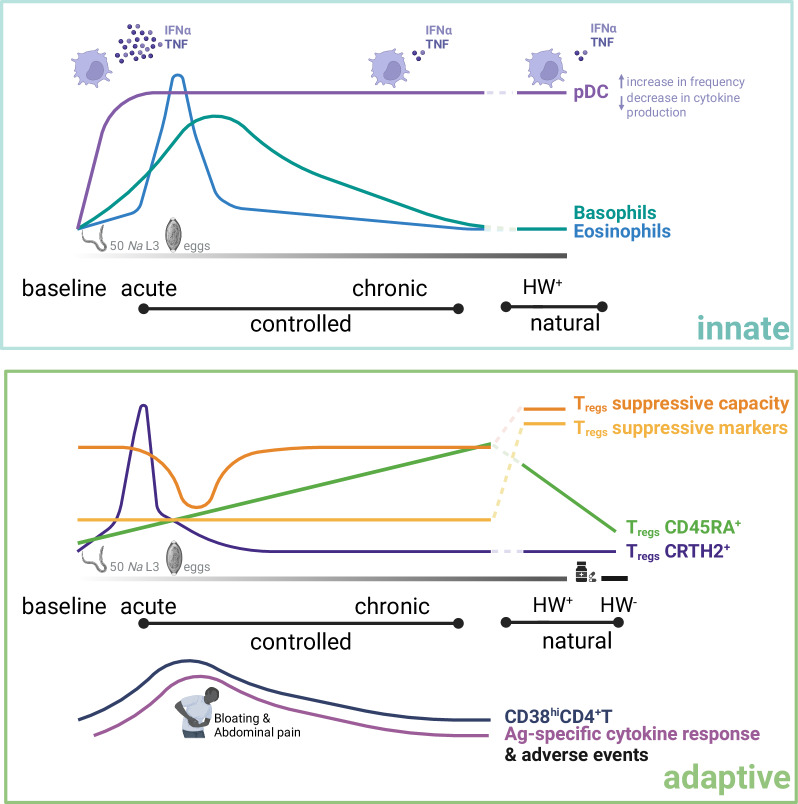
Hookworm infection remains a significant public health concern, particularly in low- and middle-income countries, where mass drug administration has not stopped reinfection. Developing a vaccine is crucial to complement current control measures, which necessitates a thorough understanding of host immune responses. By leveraging controlled human infection models and high-dimensional immunophenotyping, here we investigated the immune remodeling following infection with 50 Necator americanus L3 hookworm larvae in four naïve volunteers over two years of follow-up and compared the profiles with naturally infected populations in endemic areas. Increased plasmacytoid dendritic cell frequency and diminished responsiveness to Toll-like receptor 7/8 ligand were observed in both controlled and natural infection settings. Despite the increased CD45RA+ regulatory T cell (Tregs) frequencies in both settings, markers of Tregs function, including inducible T-cell costimulatory (ICOS), tumor necrosis factor receptor 2 (TNFR2), and latency-associated peptide (LAP), as well as in vitro Tregs suppressive capacity were higher in natural infections. Taken together, this study provides unique insights into the immunological trajectories following a first-in-life hookworm infection compared to natural infections.


Conflict of interest statement

The authors declare no competing interests.

Figures

Fig. 1
Fig. 1. The Controlled Human Hookworm Infection in Leiden (CHHIL) study.
A Study timeline for the hookworm challenge, PBMC isolation, termination of infection with albendazole, and cytometry data acquisition. This figure panel is created with BioRender.com under a Creative Commons Attribution-NonCommercial-NoDerivs 4.0 International license. B Left: Eggs per gram of stool (EPG) as measured by Kato-Katz. Right: Eosinophil counts (x 109/L) from 0 to 104 WPI. The inset plot shows weekly measurements of eosinophils within the first 8 WPI. Changes in eosinophil counts relative to baseline (0 WPI) were tested using a gaussian linear mixed model with Dunnett’s test. EPG, egg per gram; WPI, week(s) post-infection. *P < 0.05, **P < 0.01, ***P < 0.001. Source data are provided as a Source Data file.
Fig. 2
Fig. 2. Mass cytometry reveals global changes in the signature of immune cells after a single infection with 50 Na-L3 larvae.
A FI-tSNE projection of all live, singlet, CD45+ cells, colored by lineage marker expression levels (left panel) or colored by immune cell lineage annotations (right panel). The horizontal barplots indicate the average frequencies of the immune cell lineages relative to total CD45+ cells across samples. B Principal component analysis of immune cell clusters frequencies before (0 WPI) and after infection (4, 8, 12, 28, 52 and 104 WPI). Cell cluster counts were centered log-ratio (CLR) transformed, then within-subject mean centered to take repeated measures into account, and finally scaled to unit variance. The first two principal components explained 42% of the variance in the data. PERMANOVA P-value comparing sample centroids before and after infection is shown. Distinct shapes and colors indicate samples from the four donors for each time point. Solid lines connect the observations toward the centroid for each time point. C PERMANOVA coefficient of multivariate comparison of immune cell cluster composition before and after infection as shown in (B). The top three clusters that contribute the most to the differences for each direction of change are shown. D, E Log2 fold change (LFC) in cluster frequencies (% of CD45+) for clusters 43 and 35 that are annotated as (D) plasmacytoid dendritic cells (pDC), and (E) basophils, respectively. Colors and shapes indicate a distinct individual (ID). Lines connect paired samples. ** FDR < 0.01, *** FDR < 0.001. F Frequencies of manually gated pDC (left) and basophils (right) in CHHIL and helminth-infected Flores donors. Horizontal lines indicate the median for each timepoint or group. Dashed vertical lines demarcate CHHIL (right) and hookworm-infected Flores individuals (HW+ Flores) (left). The changes in cell abundance were tested using a binomial generalized linear mixed effects model. G Frequencies of IFNα- and TNF-producing pDC after in-vitro stimulation with R-848, a TLR-7/8 agonist in CHHIL and Flores subjects. The cytokine frequencies were background subtracted. Differences in cytokine-producing cell frequencies were tested using a linear mixed effects model. Na-L3 Necator americanus L3-larvae, FI-tSNE FFT-accelerated Interpolation-based t-SNE, NK natural killer cells, ILC innate lymphoid cells, PC Principal component, pDC plasmacytoid dendritic cells, EM effector memory, CM central memory, LFC Log2 fold-change, WPI week(s) post-infection, CHHIL Controlled Human Hookworm Infection in Leiden, R-848 resiquimod. Source data are provided as a Source Data file.
Fig. 3
Fig. 3. Helminths infection is associated with CD45RA+ resting Tregs in both controlled and natural infection settings.
A Schematic of hookworm infection status (HW±) with respect to controlled infection or anthelmintic treatment in CHHIL participants or Flores residents, respectively. This figure panel is created with BioRender.com under a Creative Commons Attribution-NonCommercial-NoDerivs 4.0 International license. B Schematic of integrative Tregs data analysis pipeline. Left: Tregs were manually gated from mass cytometry data of CHHIL participants and Flores residents. Center: FI-tSNE projection of mass cytometry data alignment using cyCombine. Colors indicate the study of origin. Right: overlay of Tregs clusters, which was obtained using Cytosplore, on integrated data embedding. C Principal component analysis of Tregs cluster frequencies before (0 WPI) and after infection (4, 8, 12, 28, 52 and 104 WPI). Cell cluster frequencies were calculated relative to total CD4+T cells, within-subject mean-centered to take into account repeated measures, and scaled to unit variance. The first two principal components explained > 65% of the variance in the data. Distinct shapes and colors indicate samples from the four donors for each time point. PERMANOVA P-value comparing Tregs profile before and after infection is shown. D Heatmaps summarising the changes in Tregs cluster frequencies after infection with corresponding marker expression. Left: Heatmap panel showing the median signal intensity of Tregs cluster marker expressions. The Tregs clusters were classified as either resting Tregs (CD45RA+) or effector Tregs (CD45RA-). Center: Log fold changes in Tregs cluster frequencies (as % of total CD4+T cells) relative to baseline (0 WPI). Changes in Tregs cluster frequencies were analyzed using binomial generalized linear mixed effects models. Log2 fold-changes of comparisons with FDR < 0.05 are shown. Right: Average cluster frequencies across samples and annotation of the Tregs clusters. E Correlation between the frequencies of pDC and ICOS+ Tregs between 0 and 4 weeks post-infection. The frequencies were within-subject mean-centered and scaled to unit variance prior to pearson correlation analysis. Each point represents a sample from a particular time point, indicated using the colors. Lines and shaded band represent estimated mean and 95% confidence interval, respectively. F Neighborhood-level differential abundance analysis between 0 and 4 WPI using Milo. Left: Differentially abundant neighborhood of cells (SpatialFDR < 0.1) from Milo analysis comparing enrichment of neighborhoods of cells between 0 and 4 WPI. Red and blue points represent neighborhoods of cells and the layout of these points is determined by the position of the neighborhood index cell in the FItSNE embedding from (B), which is depicted here by the gray points on the background. Color indicates log2 fold change in enrichment, with red and blue color indicates enrichment at 4 and 0 WPI, respectively. Right: Close-up view of differentially abundant neighborhoods from the left panel, showing CRTH2+ neighborhoods (top right) of cells that are annotated as TH2-like Tregs (bottom right). G PHATE embedding of TH2 cells (cluster 16) and TH2-like Tregs (Tregs cluster 7) and overlays of marker expressions. H, I Frequencies of resting (CD45RA+) Tregs (H) and CCR7+CTLA4+CD38hiICOS+ effector Tregs (Tregs cluster 4) (I) in CHHIL (n = 4) and hookworm infected Flores subjects (n = 8). Lines connect paired samples. Vertical dashed lines demarcate the CHHIL and Flores data. Changes in frequencies relative to baseline (CHHIL subjects) or pre-deworming (Flores subjects) were tested using binomial linear mixed models with Dunnett’s contrast. ***P < 0.001 for comparisons of post-infection CHHIL timepoints (4 to 104 WPI) against baseline (0 WPI). J Frequencies of Tregs expressing TNFR2 (left) or TGF-β1 latency-associated peptide (LAP) (right) in CHHIL (n = 4) and hookworm-infected (HW+) Flores subjects (n = 3). Lines connect paired samples. Vertical dashed lines demarcate CHHIL and Flores donors. For the analysis of LAP expression, PBMC were stimulated using PMA/Ionomycin and then frequencies were background subtracted. For the analysis of TNFR2 expression, frequencies after in vitro culture in medium control (RPMI supplemented with 10% FCS) were analyzed. K Percentage (%) suppression of responder T cells (Tresp) proliferation by Tregs in CHHIL and HW+ Flores residents (% suppression = (1 - (Tresp proliferation with Tregs/Tregs proliferation without Tregs)) x 100%). Left: Line plot showing % suppression across varying Tresp: Tregs ratio as shown on the x-axis, summarised across individuals (CHHIL, n = 4; HW+ Flores, n = 3) and technical replicates (n = 3 per sample) within each group. Error bars indicate mean ± standard deviation. Right: Boxplots of percentage suppression by Tregs in 1:1 Tresp:Tregs ratio. Boxplots indicate the median and 25th/75th percentiles with whiskers extending to ±1.5 × IQR. Each data point represents the mean of 3 technical replicates. Differences in cell frequencies and percent suppression were tested using linear mixed-effects models with custom contrast comparing HW+ Flores against all CHHIL samples at 0, 12 and 104 WPI. Tregs regulatory T cells, WPI week(s) post-infection, PC principal component, MSI median signal intensity, FI-tSNE FFT-accelerated Interpolation-based t-SNE. Source data are provided as a Source Data file.
Fig. 4
Fig. 4. Development of hookworm antigen-specific cytokine responses by CD4+T cells and the relevance of ex vivo CD38 expression on CD4+T cells.
A Heatmaps summarizing the changes in the frequencies CD4+T cell cluster frequencies, calculated relative to total CD45+ cells. Statistically significant (FDR < 0.05) log2 fold change (LFC) of cell cluster frequencies relative to the baseline (left) or between consecutive time points (center). Heatmap of median signal intensity of selected markers (right). B Frequencies of CD4+T cells producing IFNγ, TNF or TH2 (IL-4/IL-5/IL-13) cytokines upon stimulation with crude larval antigen of Nippostrongylus brasiliensis. Frequencies of cytokine-producing cells are background subtracted and negative values were set to zero, only for visualization. Lines connect paired samples. The dashed vertical lines highlight the time point at which the frequencies of cytokine-producing cells became detectable. Changes in frequencies were tested using linear mixed-effect models without adjustment for multiple comparisons. C Frequencies of manually gated CD38hiCD4+T cells relative to total CD4+T cells from the ex vivo mass cytometry dataset. Lines connect paired samples. The changes in frequencies were tested using binomial generalized linear mixed effects models with Dunnett’s contrasts. D FItSNE projection of CD38hiCD4+T cells from (C) showing the embedding density (top) at 0, 4, and 8 WPI and the expression of selected markers (middle and bottom). TH1 T helper 1, TH2 T helper 2, CM central memory, EM effector memory, WPI week(s) after infection. Source data are provided as a Source Data file.
Fig. 5
Fig. 5. Schematic summary of immune cell remodeling by human hookworm parasites in controlled and natural infection settings.
Top: trajectories of innate immune cells. Upon hookworm infection, pDC frequencies increased early and persisted through to chronicity, while their cytokine production in response to TLR-7/8 activation decreased steadily, resembling those observed in HW+ individuals in natural settings. The frequencies of basophils and eosinophils peaked around the time hookworm eggs could be detected and declined to a range comparable to that of HW+ individuals in natural settings. Bottom: Trajectories of adaptive immune cells. The frequency of CRTH2+ Tregs increased early after infection, however, prior to the detection of hookworm eggs, their frequency declined, while the frequencies of CD4+T cells expressing CD38 and those producing cytokines upon hookworm antigen stimulation increased between 8 and 12 WPI. Notably, these series of events were accompanied by the occurrence of gastrointestinal adverse events, including bloating and abdominal pain. A dip in Tregs suppressive capacity was also observed during this same period. CD45RA+ Tregs frequencies steadily increased upon infection, eventually reaching a comparable range to those observed in HW+ individuals in natural infection settings, but declined upon anthelmintic treatment. Finally, Tregs suppressive markers and capacity were higher in HW+ individuals in natural infection settings. Lines represent chronological progression of immune parameters; line colors indicate distinct immune parameters. HW± hookworm-positive/-negative, pDC plasmacytoid dendritic cells, Tregs regulatory T cells, Ag antigen. This figure is created with BioRender.com under a Creative Commons Attribution-NonCommercial-NoDerivs 4.0 International license.

References

    1. Loukas A, Maizels RM, Hotez PJ. The yin and yang of human soil-transmitted helminth infections. Int J. Parasitol. 2021;51:1243–1253. doi: 10.1016/j.ijpara.2021.11.001. - DOI - PMC - PubMed
    1. Jia T-W, Melville S, Utzinger J, King CH, Zhou X-N. Soil-Transmitted Helminth Reinfection after Drug Treatment: A Systematic Review and Meta-Analysis. PLOS Neglected Tropical Dis. 2012;6:e1621. doi: 10.1371/journal.pntd.0001621. - DOI - PMC - PubMed
    1. Keiser J, Utzinger J. Efficacy of current drugs against soil-transmitted helminth infections: systematic review and meta-analysis. JAMA. 2008;299:1937–1948. doi: 10.1001/jama.299.16.1937. - DOI - PubMed
    1. de Jong SE, et al. Systems analysis and controlled malaria infection in Europeans and Africans elucidate naturally acquired immunity. Nat. Immunol. 2021;22:654–665. doi: 10.1038/s41590-021-00911-7. - DOI - PubMed
    1. Sandoval, D. M. et al. Adaptive T cells regulate disease tolerance in human malaria. medRxiv, 2021.2008.2019.21262298, 10.1101/2021.08.19.21262298 (2021).