. 2024 Jul 16;15(1):5961.
doi: 10.1038/s41467-024-50392-z.

RNF213 promotes Treg cell differentiation by facilitating K63-linked ubiquitination and nuclear translocation of FOXO1

Affiliations

RNF213 promotes Treg cell differentiation by facilitating K63-linked ubiquitination and nuclear translocation of FOXO1

Xiaofan Yang et al. Nat Commun. .

Abstract

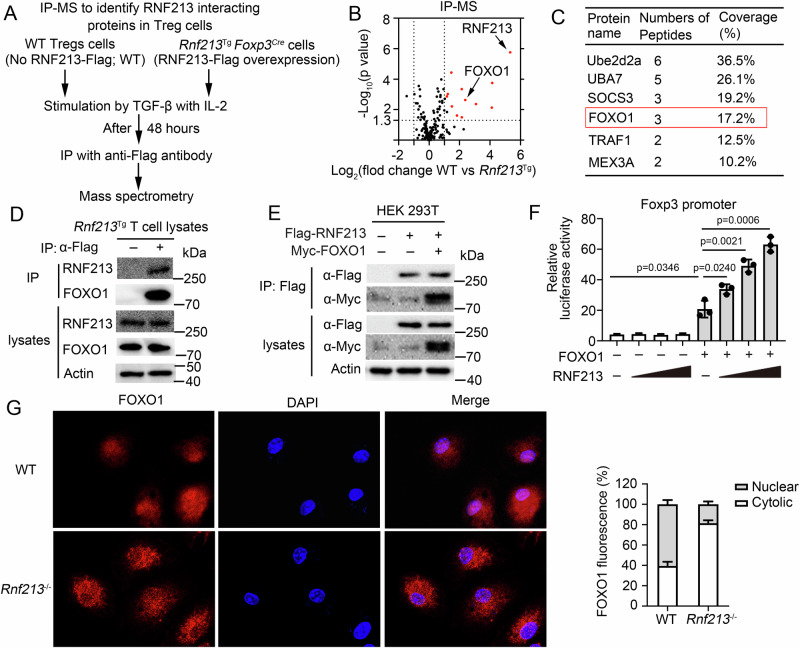
Autoreactive CD4+ T helper cells are critical players that orchestrate the immune response both in multiple sclerosis (MS) and in other neuroinflammatory autoimmune diseases. Ubiquitination is a posttranslational protein modification involved in regulating a variety of cellular processes, including CD4+ T cell differentiation and function. However, only a limited number of E3 ubiquitin ligases have been characterized in terms of their biological functions, particularly in CD4+ T cell differentiation and function. In this study, we found that the RING finger protein 213 (RNF213) specifically promoted regulatory T (Treg) cell differentiation in CD4+ T cells and attenuated autoimmune disease development in an FOXO1-dependent manner. Mechanistically, RNF213 interacts with Forkhead Box Protein O1 (FOXO1) and promotes nuclear translocation of FOXO1 by K63-linked ubiquitination. Notably, RNF213 expression in CD4+ T cells was induced by IFN-β and exerts a crucial role in the therapeutic efficacy of IFN-β for MS. Together, our study findings collectively emphasize the pivotal role of RNF213 in modulating adaptive immune responses. RNF213 holds potential as a promising therapeutic target for addressing disorders associated with Treg cells.


Conflict of interest statement

The authors declare no competing interests.

Figures

Fig. 1
Fig. 1. RNF213 deficiency in CD4+ T cells promoted EAE development and inhibiting Treg cell differentiation.
Rnf213fl/fl and Rnf213fl/flCD4Cre mice were immunized with MOG(35-55) peptide in CFA adjuvant and pertussis toxin to induce EAE. A The graph shows the clinical score of EAE (n = 5 per group). B Concentration of IFN-γ, IL-17, GM-CSF, and IL-10 in serum was measured by ELISA on day 20. C The cells infiltrating the central nervous system (CNS) were re-stimulated with MOG(35-55) peptide directly ex vivo, and the intracellular production of IFN-γ and IL-17A by CD4+ T cells was determined. Pooled data are presented in the right panel. (D) Flow cytometry of Treg cell (CD25+ Foxp3+) in CNS of Rnf213fl/fl and Rnf213fl/flCD4Cre mice on days 20 during EAE. Pooled data are presented in the right panel. Data shown are the mean ± SD. *P < 0.05, **P < 0.01, and ***P < 0.001. P values were calculated using a two-sided, unpaired Student’s t-test (AD). N = 5 (BD) repeats from three independent experiments. Source data are provided as a Source Data file.
Fig. 2
Fig. 2. RNF213 promoted Treg cell differentiation in a T cell-intrinsic manner in vivo.
A Schematic of experimental design of competitive adoptive CD4+ T cell transfer assays. B The cells infiltrating the central nervous system (CNS) were harvested, and the percentages of WT (CD45.1+) and Rnf213/ (CD45.2+) in the CD4+ T cell populations were determined. C, D Flow cytometry of IFNγ+, IL-17A+ CD4+ cells (C) or CD4+ CD25+ Foxp3+ Treg cells (D) in CNS of WT and Rnf213/ mice on days 20 during EAE. E QPCR analysis of Foxp3, TGF-β1, and IL-10 in CD4+ cells isolated from CNS of WT and Rnf213/ mice. Data shown are the mean ± SD. *P < 0.05, **P < 0.01, and ***P < 0.001. P values were calculated using a two-sided, unpaired Student’s t-test in (CE). N = 5 (CE) repeats from three independent experiments. Source data are provided as a Source Data file.
Fig. 3
Fig. 3. RNF213 is essential for Treg cells to suppress T cell-mediated EAE.
A Schematic of experimental design of adoptive CD4+ T cell transfer assays. In detail, Rag1/ mice were transferred with 1 × 106 CD44 CD62L+ CD4+ T cells (Tn) from CD45.1+ mice alone (n = 5) or in combination with Tn from CD45.2+ WT or Rnf213/ Tregs. B The graph shows the clinical score of EAE (n = 5 per group). C Concentration of IL-17 and IL-10 in serum was measured by ELISA on day 20. D The cells infiltrating the central nervous system (CNS) were harvested, and the percentages of CD45.1+ and CD45.2+ in the CD4+ T cell populations was determined. Pooled data of the percentages and cell counts are presented in the right panel. E, F Flow cytometry of IFNγ+, IL-17A+ CD4+ cells (E) or CD4+ CD25+ Foxp3+ Treg cells (F) in CNS of recipient mice on days 20 during EAE. Pooled data of the percentages and cell counts are presented in the right panel. Data shown are the mean ± SD. Ns, no significance, *P < 0.05, **P < 0.01, and ***P < 0.001. P values were calculated using a two-sided, unpaired Student’s t-test in (BF). N = 5 (CF) repeats from three independent experiments. Source data are provided as a Source Data file.
Fig. 4
Fig. 4. RNF213 interacts with FOXO1 and is critical to regulate the translocation of FOXO1 to the nucleus.
A Schema of IP-MS approach to identify RNF213-interacting proteins in Treg cells. B Volcano plot of RNF213-interacting proteins by immunoprecipitation–mass spectrometry (IP-MS) analysis. Red indicates significantly enriched proteins (log2(fold change) >1; t-test adjusted P < 0.05). C The list of Ube2d2a, UBA7, SOCS3, FOXO1, TRAF1 and MEX3A identified by IP-MS analysis. D Immunoprecipitation (IP) and immunoblot (IB) analysis of Treg cells isolated from WT or Rnf213Tg mice. E IP and IB analysis of HEK293 cells transfected with the indicated plasmids for 24 h. F Luciferase activity of HEK293T cells transfected with a luciferase reporter driven by the Foxp3 promoter and expressing vector alone or various combinations (horizontal axis) of FOXO1 and RNF213. G Treg cells were double-stained with anti-FOXO1 (red) Abs and DAPI (nucleus, blue) and then observed by fluorescence microscopy. Scale bars: 50 μm. Quantification of fluorescent digital imaging analysis of FOXO1 expression in the cytosol and the nucleus depicted as the percentage expression levels are presented in the right panel (n = 3). Data shown are the mean ± SD. *P < 0.05, **P < 0.01, and ***P < 0.001. P values were calculated using a two-sided, unpaired Student’s t-test in (F). N = 3 (E) repeats from three independent experiments. Source data are provided as a Source Data file.
Fig. 5
Fig. 5. RNF213-regulated Treg differentiation in a FOXO1-dependent manner.
A Schematic of experimental design for multiple transgenic mice. B The graph shows the clinical score of EAE (n = 5 per group). C Concentration of IL-17 and IL-10 in serum was measured by ELISA on day 20. D Flow cytometry of Treg cell (CD25+ Foxp3+) in CNS on days 20 during EAE. Pooled data are presented in the right panel. Data shown are the mean ± SD. *P < 0.05, **P < 0.01, and ***P < 0.001. P values were calculated using a two-sided, unpaired Student’s t-test in (BD). N = 5 (C), n = 3 (D) repeats from three independent experiments. Source data are provided as a Source Data file.
Fig. 6
Fig. 6. RNF213 promotes FOXO1 K63-linked polyubiquitination and activity through Ubiquitination activity.
A HEK293T cells were co-transfected with a variety of ubiquitin mutants and other indicated plasmids for ubiquitination analysis. B Immunoprecipitation (IP) and immunoblot (IB) analysis of HEK293T cells that were transfected with indicated plasmids for 24 h. DZR double zinc ribbon, AAA ATPases associated with a variety of cellular activities, RING RING finger domain. C Luciferase activity of HEK293T cells transfected with a luciferase reporter driven by the Foxp3 promoter and expressing vector alone or FOXO1, RNF213, and RNF213ΔRING (lacking RING domain). D Flow cytometry of Foxp3 in CD4+ T cells infected with control retrovirus (Vector) or retrovirus expressing RNF213 or RNF213ΔRING differentiated under Treg-polarizing conditions. Pooled data are presented in the right panel. Data shown are the mean ± SD. *P < 0.05, **P < 0.01, and ***P < 0.001. P values were calculated using a two-sided, unpaired Student’s t-test in (C, D). N = 3 (C), n = 5 (D) repeats from three independent experiments. Source data are provided as a Source Data file.
Fig. 7
Fig. 7. RNF213 promoted Treg cell differentiation in human CD4+ T cells.
A, B Purified human naïve CD4+ T cells were stimulated under standard Th0, Th1, Th2, Th17, or Treg conditions and harvested on day 5. RNF213 expression levels were detected by qPCR (A) or western blot (B). C Luciferase activity of HEK293T cells transfected with a luciferase reporter driven by the Foxp3 promoter and expressing vector alone or human FOXO1, RNF213 and RNF213ΔRING (lacking RING domain). D Flow cytometric analysis of intracellular human CD4+ T cells infected with a control retrovirus (Vector) or retrovirus expressing RNF213 or RNF213ΔRING and differentiated under standard Treg conditions. Pooled data are presented in the right panel. E QPCR analysis of Foxp3 in human CD4+ T cells infected with a control retrovirus (Vector) or retrovirus expressing RNF213 or RNF213ΔRING and activated with the indicated amounts of TGF-β for 3 days. F The heatmap displaying RNF213 expression is based on RNA-seq data comparing CD4+ T cells stimulated with or without MOG(35-55) (GSE66763). G QPCR analysis of RNF213 in human CD4+ cells from healthy control (HC) (n = 10) and patients with multiple sclerosis (n = 10). Data shown are the mean ± SD. *P < 0.05, **P < 0.01, and ***P < 0.001. P values were calculated using a two-sided, unpaired Student’s t-test in (CE), and was calculated using a paired Student’s t-test in (G). N = 3 (AE) repeats from three independent experiments. Source data are provided as a Source Data file.

References

    1. Spiljar M, Kuchroo VK. Metabolic regulation and function of T helper cells in neuroinflammation. Semin. Immunopathol. 2022;44:581–598. doi: 10.1007/s00281-022-00959-z. - DOI - PubMed
    1. Rommer PS, et al. Immunological aspects of approved MS therapeutics. Front. Immunol. 2019;10:1564. doi: 10.3389/fimmu.2019.01564. - DOI - PMC - PubMed
    1. Attfield KE, Jensen LT, Kaufmann M, Friese MA, Fugger L. The immunology of multiple sclerosis. Nat. Rev. Immunol. 2022;22:734–750. doi: 10.1038/s41577-022-00718-z. - DOI - PubMed
    1. Borst J, Ahrends T, Bąbała N, Melief CJM, Kastenmüller W. CD4 T cell help in cancer immunology and immunotherapy. Nat. Rev. Immunol. 2018;18:635–647. doi: 10.1038/s41577-018-0044-0. - DOI - PubMed
    1. Sutton CE, et al. Interleukin-1 and IL-23 induce innate IL-17 production from gammadelta T cells, amplifying Th17 responses and autoimmunity. Immunity. 2009;31:331–341. doi: 10.1016/j.immuni.2009.08.001. - DOI - PubMed

MeSH terms

LinkOut - more resources