Clinical Trial
. 2024 Jul 16;15(1):5932.
doi: 10.1038/s41467-024-47000-5.

Immunomic longitudinal profiling of the NeoPembrOv trial identifies drivers of immunoresistance in high-grade ovarian carcinoma

Affiliations
Clinical Trial

Immunomic longitudinal profiling of the NeoPembrOv trial identifies drivers of immunoresistance in high-grade ovarian carcinoma

Olivia Le Saux et al. Nat Commun. .

Abstract

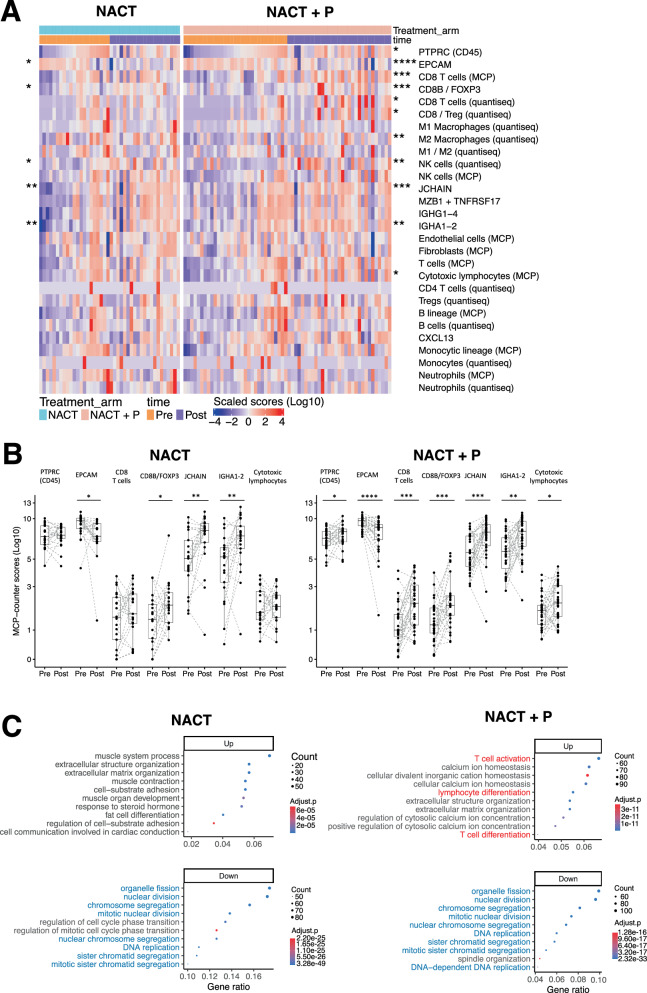
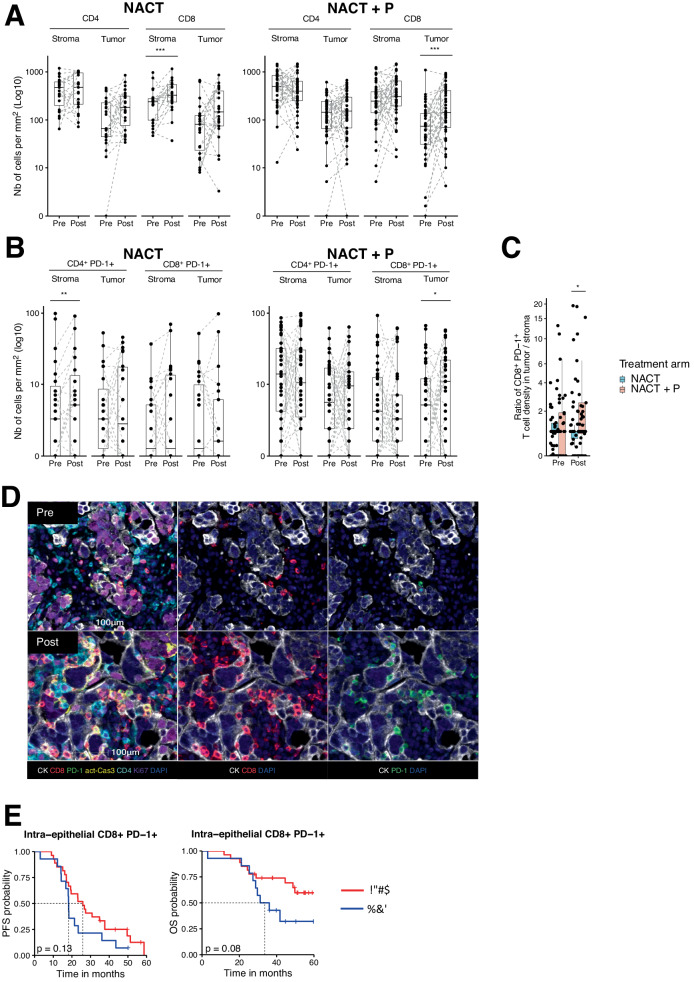
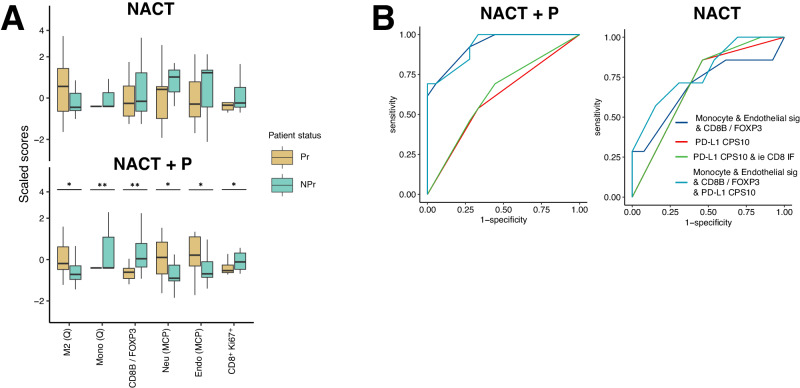
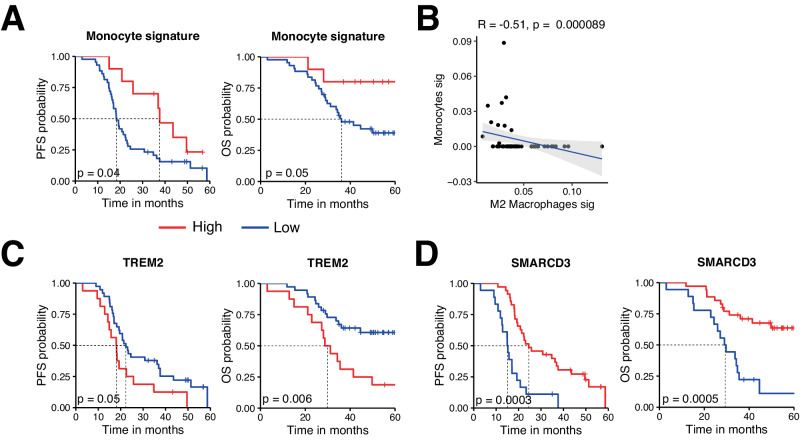
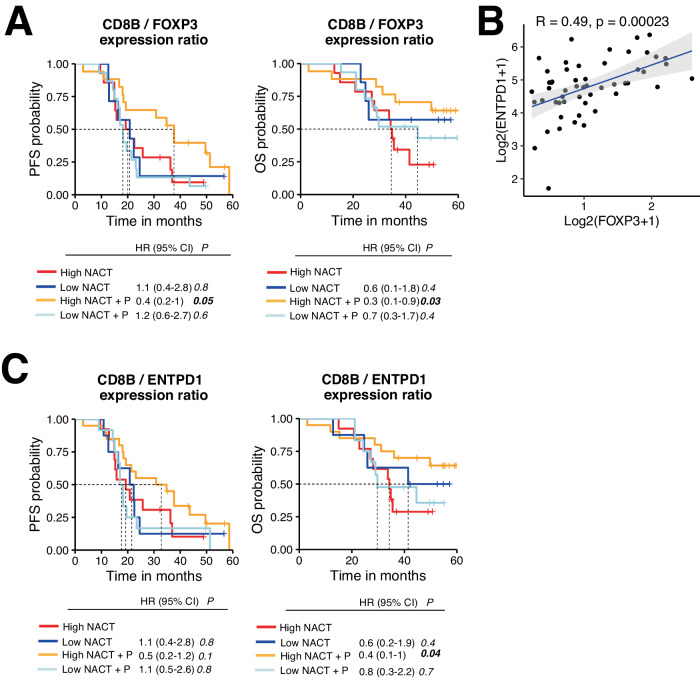
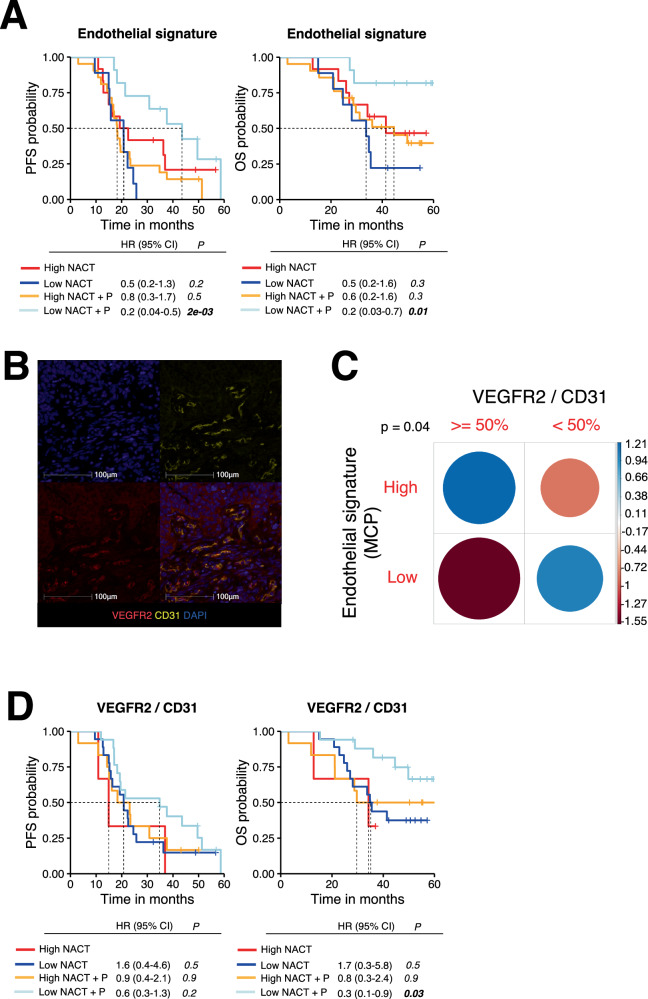
PD-1/PD-L1 blockade has so far shown limited survival benefit for high-grade ovarian carcinomas. By using paired samples from the NeoPembrOv randomized phase II trial (NCT03275506), for which primary outcomes are published, and by combining RNA-seq and multiplexed immunofluorescence staining, we explore the impact of NeoAdjuvant ChemoTherapy (NACT) ± Pembrolizumab (P) on the tumor environment, and identify parameters that correlated with response to immunotherapy as a pre-planned exploratory analysis. Indeed, i) combination therapy results in a significant increase in intraepithelial CD8+PD-1+ T cells, ii) combining endothelial and monocyte gene signatures with the CD8B/FOXP3 expression ratio is predictive of response to NACT + P with an area under the curve of 0.93 (95% CI 0.85-1.00) and iii) high CD8B/FOXP3 and high CD8B/ENTPD1 ratios are significantly associated with positive response to NACT + P, while KDR and VEGFR2 expression are associated with resistance. These results indicate that targeting regulatory T cells and endothelial cells, especially VEGFR2+ endothelial cells, could overcome immune resistance of ovarian cancers.


Conflict of interest statement

O.L.S. reports honoraria from MSD and Clovis, and travel/accommodation/expenses from Eisai. E.C. reports the following, all for an immediate family member: employment with Sanofi; consulting/advisory role for MSD, BMS, Ipsen, and AstraZeneca; speakers’ bureau for BMS, Ipsen, AstraZeneca, and Janssen; research funding from Pfizer; and travel/accommodation/expenses from Janssen. I.R-C reports personal honoraria from Agenus, Blueprint, BMS, PharmaMar, Genmab, Pfizer, AstraZeneca, Roche, GSK, MSD, Deciphera, Mersana, Merck Sereno, Novartis, Amgen, MacroGenics, Tesaro, and Clovis; honoraria to her institution from GSK, MSD, Roche, and BMS; consulting/advisory roles for AbbVie, Agenus, Advaxis, BMS, PharmaMar, Genmab, Pfizer, AstraZeneca, Roche/Genentech, GSK, MSD, Deciphera, Mersana, Merck Sereno, Novartis, Amgen, Tesaro and Clovis; research grant/funding from MSD, Roche and BMS (self) and MSD, Roche, BMS, Novartis, AstraZeneca and Merck Sereno (to institution); and travel support from Roche, AstraZeneca, and GSK. Other authors declare no competing interests.

Figures

Fig. 1
Fig. 1. Impact of neoadjuvant chemotherapy ± Pembrolizumab on the HGSC microenvironment using bulk RNAseq.
A Heatmap depicting the expression level of selected individual genes, gene signatures (MCPcounter and quanTIseq) and gene ratios inferred from bulk RNAseq data of tumors collected before (orange) or after treatment (purple) from patients of the NeoPembrOv trial receiving NACT (blue) or NACT + P (red). Red and Blue colors represent a high and low expression score, respectively. Statistically significant unadjusted p-values from two-sided Wilcoxon signed rank test between pre- and post-treatment samples are indicated on the left for the control arm and on the right for the experimental arm. Patients (x-axis) are ordered according to increasing PTPRC (CD45) expression before treatment and are listed in the same order for post-treatment samples. B Box and dotplots depicting the MCP counter gene signature expression scores in pre- and post-treatment samples for each patient in the NACT arm (left, N = 21 patients) and the NACT + P arm (right, N = 31 patients). The centerline of boxes depicts the median values; the bottom and top box edges correspond to the first and third quartiles. Statistical significance was evaluated using two-sided Wilcoxon signed-rank tests and unadjP values are reported for NACT arm: EPCAM = 0.016; CD8B/FOXP3 = 0.038; JCHAIN = 0.008; IGHA1-2 = 0.004 and NACT + P arm: PTPRC (CD45) = 0.027; EPCAM = 8.66e-05; CD8 T cells = 0.001; CD8B/FOXP3 = 0.001; JCHAIN = 0.001; IGHA1-2 = 0.002; Cytotoxic lymphocytes = 0.027. C Graphs depicting the top 10 pathways (GO BP) enriched in the differentially expressed genes between post- and pre-treatment samples for each treatment arms (upregulated pathways are in the top and down regulated are in the bottom part of the figure). Pathways highlighted in blue are common to both arms (NACT and NACT + P). Pathways highlighted in red are specific to the NACT + P arm. Only genes with a fold-change > 1.5 and an adjusted p-value < 0.05 were considered. Gene ratio represents the percentage of differentially expressed genes (DEG) identified in the pathway, dot size (Count) is representative of the number of DEG considered for pathway analysis and adjusted p-values (adjust.p) were obtained from one-sided Fisher exact test. Source data are provided as a Source Data file.
Fig. 2
Fig. 2. Effect of neoadjuvant chemotherapy +/- Pembrolizumab on T cells in HGSC revealed by multiplex IF tissue imaging.
A Box and dotplots representing the density (number of cells/mm2) of CD4+ and CD8+ cells in the tumor versus stroma in pre- and post-treatment samples of patients receiving NACT (left, N = 21 patients) vs NACT + P (right, N = 31 patients). The centerline of boxes depicts the median values; the bottom and top box edges correspond to the first and third quartiles. Statistical significance was evaluated using two-sided Wilcoxon signed-rank test. unadjP-values are reported. NACT: CD8 Stroma, unadjp =  8.49e-04. NACT + P: CD8 Tumor, unadjp =  7.90e-04. B Box and dotplots representing the number of cells/mm2 (i.e., the density) of CD4+PD-1+ and CD8+PD-1+ cells both in the tumor and stroma pre- and post-treatment in the NACT arm (left, N = 21 patients) and the NACT + P arm (right, N = 31 patients). The centerline of boxes depicts the median values; the bottom and top box edges correspond to the first and third quartiles. Statistical significance was evaluated using two-sided Wilcoxon signed-rank test. unadjP-values are reported. NACT: CD4+ PD-1+ Stroma; unadjp =  2.64e-03. NACT + P: CD8+ PD-1+ Tumor, unadjp =  4.11e-02. C Box and dotplots representing the ratio of CD8+PD-1+ cell density in tumor / CD8+PD-1+ cell density in stroma in pre- and post-treatment samples in patients receiving NACT (blue, N = 21 patients) and patients receiving NACT + P (red, N = 31 patients). The centerline of boxes depicts the median values; the bottom and top box edges correspond to the first and third quartiles. Statistical significance was evaluated using two-sided Wilcoxon rank sum test. Post: unadjp =  2.81e-02. D Representative 7-color multiplex IF images of a tumor sample collected at baseline (pre-treatment, top) and at interval debulking surgery (IDS) (post-treatment, bottom) from patients receiving NACT + P showing an increase in intra-epithelial CD8+PD-1+ cells. The composite image is shown on the left while selected channels are shown on the right. E PFS (left) and OS (right) curves according to the intra-epithelial CD8+PD-1+ density after treatment for patients in NACT + P arm. Patients were stratified based on the best cutoff (High (red), n = 27; Low (blue), n = 14). Statistical comparison of survival curves was performed using the likelihood ratio test. Source data are provided as a Source Data file.
Fig. 3
Fig. 3. Predictive biomarkers of response to NACT + Pembrolizumab.
A Boxplots representing the scaled expression scores of RNAseq gene signatures before treatment and of immune cell densities before treatment that significantly differed between non progressors, NPr, (green-blue, N = 7 NACT and N = 13 NACT + P) and progressors, Pr, (dark yellow, N = 13 NACT and N = 19 NACT + P) receiving NACT (top) versus patients receiving NACT + P (bottom). The centerline of boxes depicts the median values; the bottom and top box edges correspond to the first and third quartiles. Statistical significance was evaluated using two-sided Wilcoxon rank sum test and unadjusted p-values are indicated on top of boxplots. For NACT + P arm, M2 (Q) = 0.037; Mono (Q) = 0.006; CD8B/FOXP3 = 0.008; Neu (MCP) = 0.045; Endo (MCP) = 0.027; CD8+Ki67+ = 0.041 B ROC curves representing the area under curve for the models considering monocyte & endothelial gene signature expression & CD8B/FOXP3 gene expression ratio (dark blue), the same 3 variables and PD-L1 expression (light blue), PD-L1 expression and intra-epithelial CD8+ T cell density at baseline (green) and PD-L1 expression alone (red) in the NACT + P arm (left) vs NACT (right) arm. 95% CI was calculated for the area under the curve of the different models. No adjustment for multiple comparisons was made. Source data are provided as a Source Data file.
Fig. 4
Fig. 4. The monocyte signature, a low TREM2 expression and a high SMARCD3 expression are associated with survival irrespective of treatment arm and are thus prognostic factors.
A, C, D PFS (left) and OS (right) curves of patients included in the NeoPembrOv trial (without distinction of treatment arm) according to the expression of a monocyte gene signature (High (red), n = 10; Low (blue), n = 43) (A), TREM2 gene expression (High (red), n = 16; Low (blue), n = 37) (C) and SMARCD3 gene expression (High (red), n = 35; Low (blue), n = 18) (D). Patients were stratified based on a positive (=high) versus negative (=low) expression score (A), and on the best cut-off (B, C). Statistical comparison of survival curves was performed using the likelihood ratio test. B Spearman correlation between monocyte and type 2 macrophage expression signature. Error bands represents the 95% CI as a shaded gray area. Source data are provided as a Source Data file.
Fig. 5
Fig. 5. A high CD8B/FOXP3 gene expression ratio is associated with increased survival in patients treated with NACT + P.
A, C PFS (left) and OS (right) curves according to the CD8B/FOXP3 expression ratio (High NACT (red), n = 14; Low NACT (dark blue), n = 7; High NACT + P (orange), n = 17; Low NACT + P (light blue), n = 15) (A) and the CD8B/ENTPD1 expression ratio (High NACT (red), n = 13; Low NACT (dark blue), n = 8; High NACT + P (orange), n = 20; Low NACT + P (light blue), n = 12) (C) in each arm. Patients were stratified based on the best cutoff. Statistical comparison of survival curves for NACT + P High vs. NACT High was performed using the likelihood ratio test. B Spearman correlation between log2(TPM + 1) FOXP3 and ENTPD1 gene expression. Error bands represents the 95% CI as a shaded gray area. Source data are provided as a Source Data file.
Fig. 6
Fig. 6. High expression of KDR/VEGFR2 is associated with resistance to NACT + P.
A PFS (left) and OS (right) curves according to the expression of the endothelial gene signature in each arm (High NACT (red), n = 12; Low NACT (dark blue), n = 9; High NACT + P (orange), n = 21; Low NACT + P (light blue), n = 11). Patients were stratified based on the best cutoff. Statistical comparison of survival curves for NACT + P Low vs. NACT Low was performed using the likelihood ratio test. B Representative image of a CD31/VEGFR2 multiplex IF staining showing expression of VEGFR2 (red) on endothelial cells (CD31 in yellow). C Correlation between the endothelial signature expression score and VEGFR2 expression on CD31+ cells assessed by multi-IF. Color intensity and the size of the circle are proportional to the correlation coefficients. Positive values are in blue and denote a positive association while negative values are in red and denote a negative association. Pearson’s χ2 test p-value is displayed. No adjustment for multiple comparisons was made. D PFS (left) and OS (right) curves according to the expression of VEGFR2 on CD31+ endothelial cells ( ≥ 50% vs <50%) in each arm (High NACT (red), n = 3; Low NACT (dark blue), n = 18; High NACT + P (orange), n = 12; Low NACT + P (light blue), n = 17). Statistical comparison of survival curves for NACT + P Low vs. NACT Low was performed using the likelihood ratio test. Source data are provided as a Source Data file.

References

    1. Zhang Y, et al. Global patterns and trends in ovarian cancer incidence: age, period and birth cohort analysis. BMC Cancer. 2019;19:984. doi: 10.1186/s12885-019-6139-6. - DOI - PMC - PubMed
    1. Zhang L, et al. Intratumoral T cells, recurrence, and survival in epithelial ovarian cancer. N. Engl. J. Med. 2003;348:203–213. doi: 10.1056/NEJMoa020177. - DOI - PubMed
    1. Matulonis UA, et al. Antitumor activity and safety of pembrolizumab in patients with advanced recurrent ovarian cancer: results from the phase II KEYNOTE-100 study. Ann. Oncol. 2019;30:1080–1087. doi: 10.1093/annonc/mdz135. - DOI - PubMed
    1. Mesnage SJL, et al. Neoadjuvant chemotherapy (NACT) increases immune infiltration and programmed death-ligand 1 (PD-L1) expression in epithelial ovarian cancer (EOC) Ann. Oncol. 2017;28:651–657. doi: 10.1093/annonc/mdw625. - DOI - PubMed
    1. Leary A, et al. Neoadjuvant chemotherapy alters the balance of effector to suppressor immune cells in advanced ovarian cancer. Cancer Immunol. Immunother. 2021;70:519–531. doi: 10.1007/s00262-020-02670-0. - DOI - PMC - PubMed

Publication types

MeSH terms