. 2024 Jul 16;9(1):38.
doi: 10.1038/s41525-024-00420-0.

Molecular subtypes explain lupus epigenomic heterogeneity unveiling new regulatory genetic risk variants

Collaborators, Affiliations

Molecular subtypes explain lupus epigenomic heterogeneity unveiling new regulatory genetic risk variants

Olivia Castellini-Pérez et al. NPJ Genom Med. .

Abstract

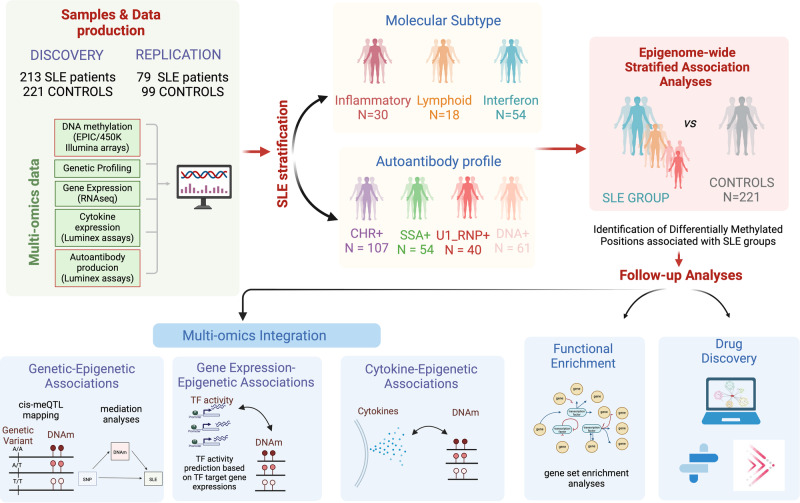
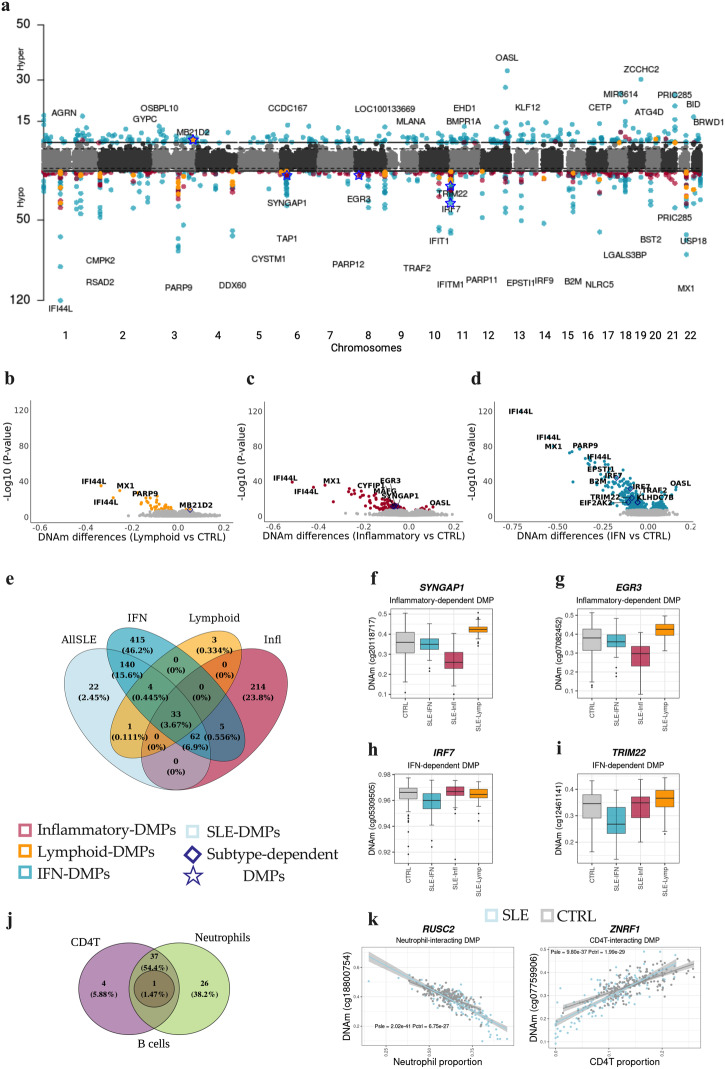
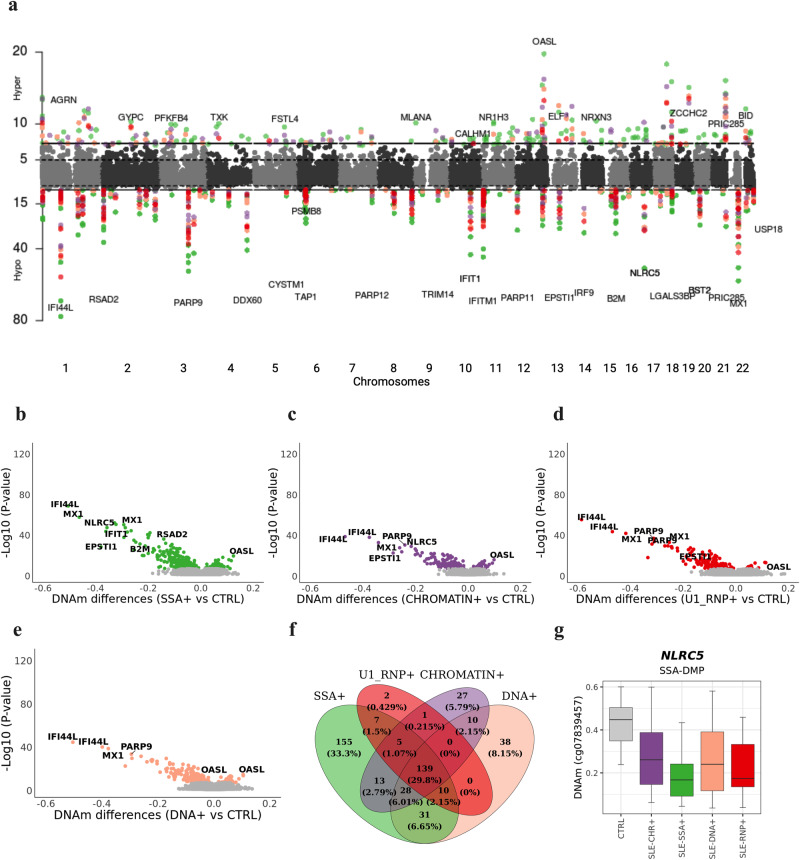
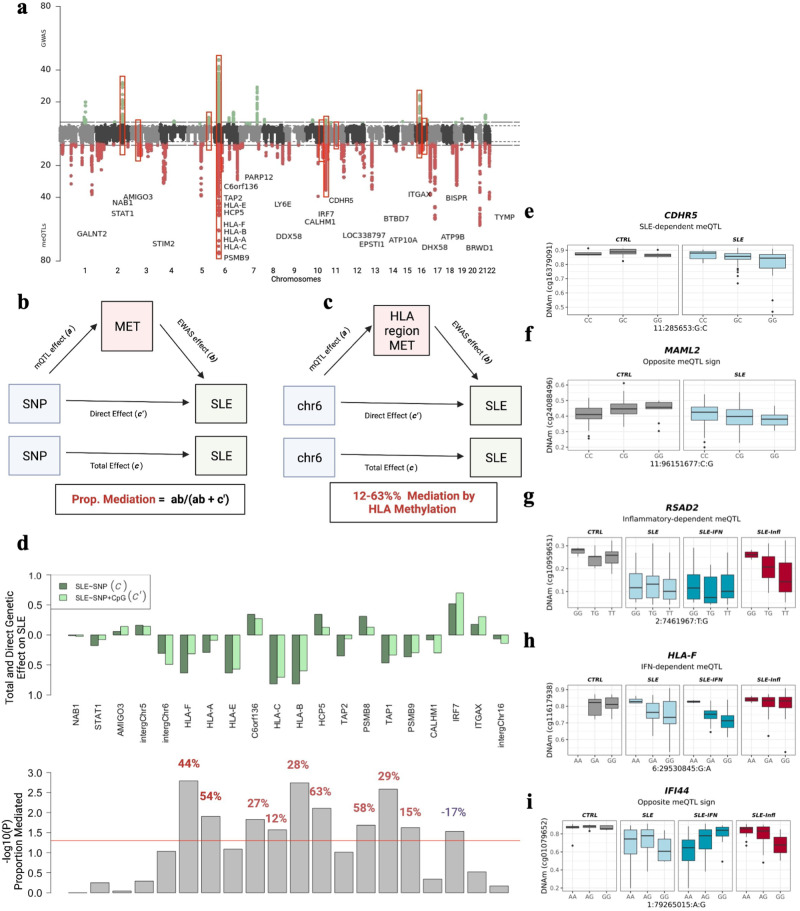
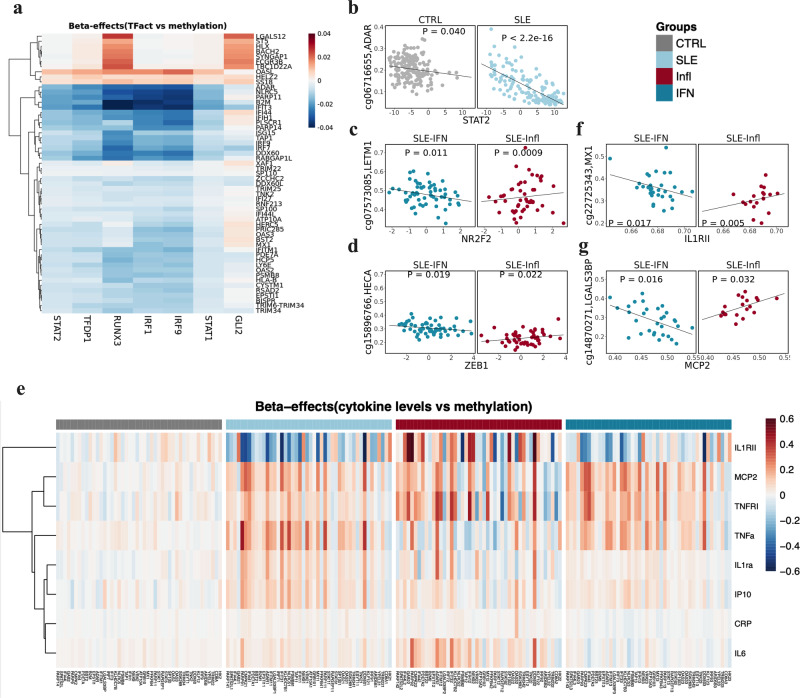
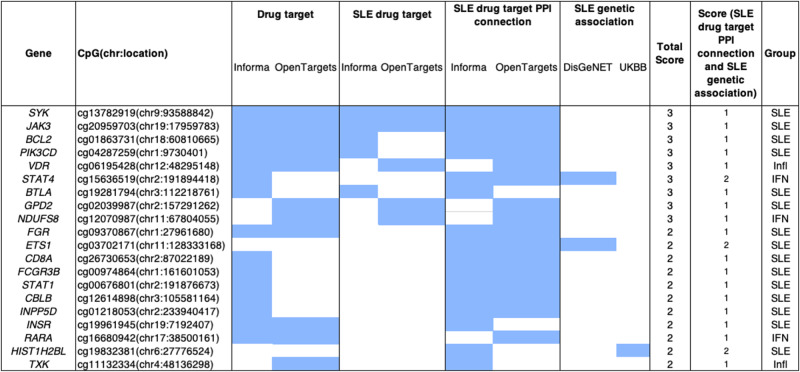
The heterogeneity of systemic lupus erythematosus (SLE) can be explained by epigenetic alterations that disrupt transcriptional programs mediating environmental and genetic risk. This study evaluated the epigenetic contribution to SLE heterogeneity considering molecular and serological subtypes, genetics and transcriptional status, followed by drug target discovery. We performed a stratified epigenome-wide association studies of whole blood DNA methylation from 213 SLE patients and 221 controls. Methylation quantitative trait loci analyses, cytokine and transcription factor activity - epigenetic associations and methylation-expression correlations were conducted. New drug targets were searched for based on differentially methylated genes. In a stratified approach, a total of 974 differential methylation CpG sites with dependency on molecular subtypes and autoantibody profiles were found. Mediation analyses suggested that SLE-associated SNPs in the HLA region exert their risk through DNA methylation changes. Novel genetic variants regulating DNAm in disease or in specific molecular contexts were identified. The epigenetic landscapes showed strong association with transcription factor activity and cytokine levels, conditioned by the molecular context. Epigenetic signals were enriched in known and novel drug targets for SLE. This study reveals possible genetic drivers and consequences of epigenetic variability on SLE heterogeneity and disentangles the DNAm mediation role on SLE genetic risk and novel disease-specific meQTLs. Finally, novel targets for drug development were discovered.


Conflict of interest statement

W.Q., C.Z., S.S., and E.dR. are employees of SANOFI. All other authors have no competing interests.

Figures

Fig. 1
Fig. 1. Overview of the study design.
Schematic outline illustrating the data analysis and the use of patients’ genetic and molecular information to stratify patients into molecularly homogenous groups and autoantibody-positivity profiles to further perform EWAS functional enrichment analyses, meQTL analyses, cytokine association, and drug discovery according to molecular and serological subtypes.
Fig. 2
Fig. 2. Epigenetic signatures of SLE molecular subtypes and cell type interactions.
a Manhattan plot illustrating EWAS results for SLE and different molecular groups when compared with controls. X-axis represents the chromosomic locations of CpG sites and Y-axis represents the log10 (P) obtained in linear regression models. bd Volcano Plots representing EWAS results. The X-axis represents the DNAm differences between each pair of groups tested. e Overlap of genome-wide significant results for each EWAS was performed. fi Examples of subtype dependent-DMPs. Colored dots represent significant DMPs after Bonferroni correction of different groups according to the legend. Diamonds and starts dots represents subtypes-dependent DMPs. j Venn diagram illustrating the overlap of cell-type-interacting DMPs that remain significant after Bonferroni correction. k Scatter plots depicting DNAm changes between SLE and CTRL individuals at a specific CpG site identified as a significant DMP in the cell-type-interacting analysis. Neutrophil proportions are represented on the y-axis in the left plot, while CD4T proportions are depicted on the x-axis in the right plot.
Fig. 3
Fig. 3. Epigenetic signatures of SLE autoantibody profiles.
a Manhattan plot illustrating EWAS results for different groups of SLE patients according to their autoantibody profiles when compared with controls. X-axis represents the chromosomal locations of CpG sites and Y-axis represents the log10 (P) obtained in linear regression models. be Volcano Plots representing EWAS results. The X-axis represents the DNAm differences between each pair of groups tested. f Overlap of genome-wide significant results for each EWAS performed. g Example of DNAm distribution across different autoantibody groups, and healthy subjects. Colored dots represent significant DMPs after Bonferroni correction of different groups according to the legend.
Fig. 4
Fig. 4. Genetic drivers of SLE-epigenetic signatures.
a Top Manhattan plot (MP) shows GWAS results contrasting allele frequencies between a group of SLE patients (N = 4212) and a group of CTRL (N = 4065). Bottom MP illustrates meQTL results for DMPs in the whole sample. X-axis represents the chromosomal locations of CpG sites and the Y-axis represents the log10 (P) obtained in a logistic regression model or meQTL analyses. Genetic associations above the red line marks the statistical association at a significant threshold of P < 1 × 10−06 for logistic associations and FDR < 0.05 for meQTLs. Red boxes show overlap in GWAS and meQTL results and represent meQTLs associated with SLE diagnosis. b Mediation model in which SLE genetic risk is exerted partly through DNAm changes. c Examples of SLE-associated SNPs in chr6 that are mediated by DNAm changes at DMPs in the HLA region. d Mediation results for the best SLE-meQTL-DMPs by gene. Upper barplot shows the Total and the Direct Effect of SLE-associated genetic variants. Botton barplot show the significance of the proportion mediated via DNA met resulted from mediation models. Percentage of mediation is illustrated in red below each bar only for those significant genes (Pproportion mediated < 0.05) ei Group-dependent meQTL effects. e A meQTL significant effect is observed among SLE patients (FDR < 0.05) but not in the CTRL population (P > 0.05). f A meQTL significant effect is observed in SLE patients and CTRLs but with different signs. g A meQTL significant effect is observed among SLE from inflammatory group (FDR < 0.05) but not in the CTRL population or in the IFN group (P > 0.05). h A meQTL significant effect is observed among SLE from IFN group (FDR < 0.05) but not in the CTRL population or in the inflammatory group (P > 0.05). i A meQTL with opposite direction effects between Inflammatory-IFN subtypes.
Fig. 5
Fig. 5. Relationship between SLE-epigenetic signatures, transcription factor activity, and cytokine production.
a Heatmap representing SLE-dependent associations between DNAm at DMPs and TFact inferred from RNAseq data. b SLE dependent example showing the effect between TFact STAT2 and DNAm at ADAR gene vs CTRL. c, d Subtypes dependent examples showing the effect between TFact ZEB1 and NR2F2 and DNAm at SPATS2L and LETM1 genes. e Heatmap showing the effect distribution of CpGs-genes associated to cytokine levels exhibiting group specificity. Color gradient from blue to red correspond to effect sizes. f, g Examples for cytokine opposite associations at DNAm levels for inflammatory and IFN subtypes.
Fig. 6
Fig. 6. Representative SLE Epigenomic signature genes.
We list the top 20 (of the 549 genes from the identified 974 CpG sites) based on summary of gene total scores derived from individual criteria (filled box indicates criterion satisfied). Filled boxes indicate an overlap with the data source described in each column. For full results, see Supplementary Data.

References

    1. Rider V, et al. Gender bias in human systemic lupus erythematosus: a problem of steroid receptor action? Front. Immunol. 2018;9:611. doi: 10.3389/fimmu.2018.00611. - DOI - PMC - PubMed
    1. Nehar-Belaid D, et al. Mapping systemic lupus erythematosus heterogeneity at the single-cell level. Nat. Immunol. 2020;21:1094–1106. doi: 10.1038/s41590-020-0743-0. - DOI - PMC - PubMed
    1. Bentham J, et al. Genetic association analyses implicate aberrant regulation of innate and adaptive immunity genes in the pathogenesis of systemic lupus erythematosus. Nat. Genet. 2015;47:1457–1464. doi: 10.1038/ng.3434. - DOI - PMC - PubMed
    1. Wang Y-F, et al. Identification of 38 novel loci for systemic lupus erythematosus and genetic heterogeneity between ancestral groups. Nat. Commun. 2021;12:772. doi: 10.1038/s41467-021-21049-y. - DOI - PMC - PubMed
    1. Kariuki SN, et al. Trait-stratified genome-wide association study identifies novel and diverse genetic associations with serologic and cytokine phenotypes in systemic lupus erythematosus. Arthritis Res. Ther. 2010;12:R151. doi: 10.1186/ar3101. - DOI - PMC - PubMed

LinkOut - more resources