. 2024 Jul 16;15(1):5536.
doi: 10.1038/s41467-024-49631-0.

Controlling 229Th isomeric state population in a VUV transparent crystal

Affiliations

Controlling 229Th isomeric state population in a VUV transparent crystal

Takahiro Hiraki et al. Nat Commun. .

Abstract

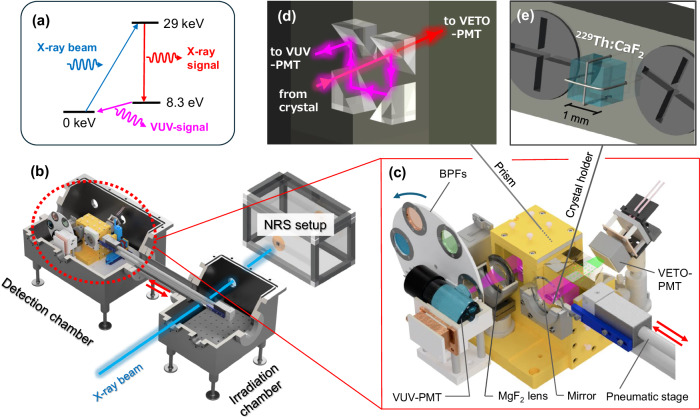
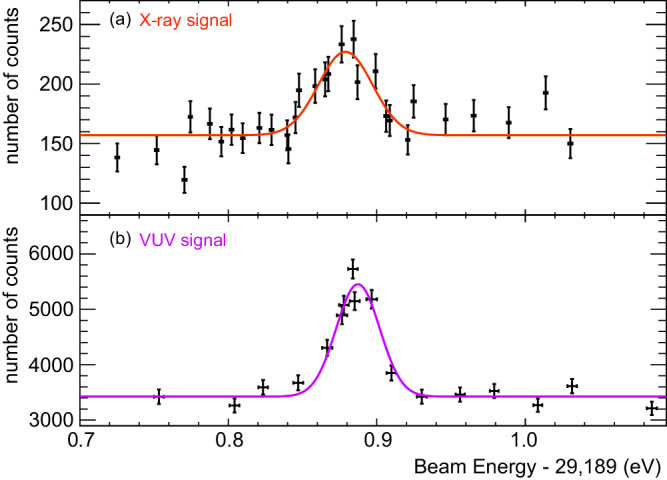
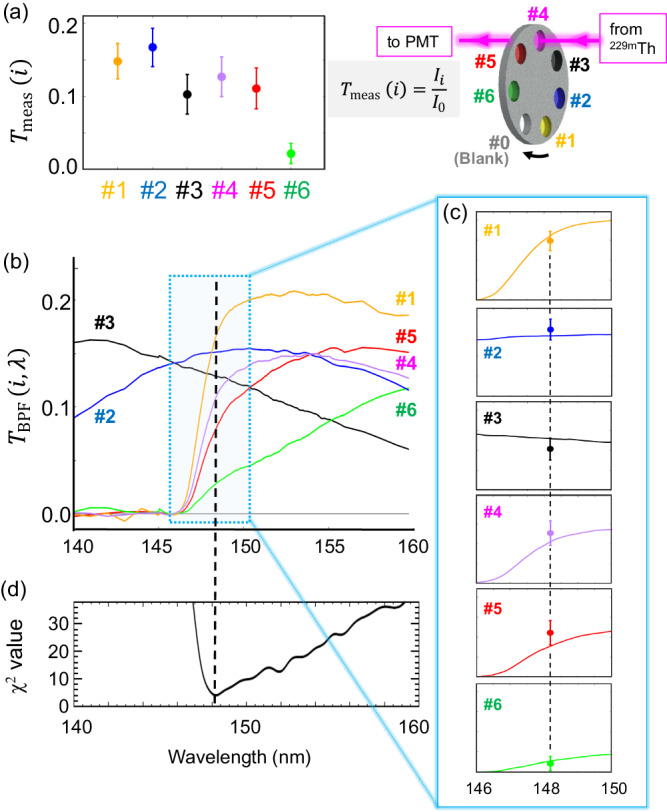
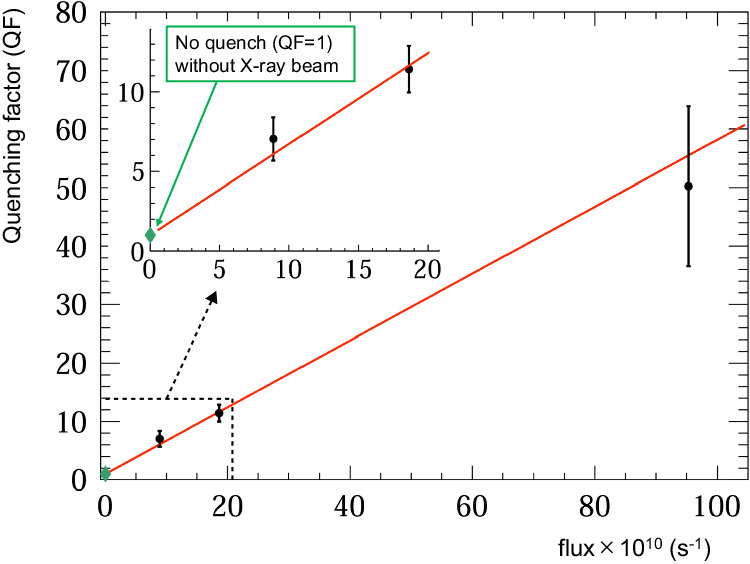
The radioisotope thorium-229 (229Th) is renowned for its extraordinarily low-energy, long-lived nuclear first-excited state. This isomeric state can be excited by vacuum ultraviolet (VUV) lasers and 229Th has been proposed as a reference transition for ultra-precise nuclear clocks. To assess the feasibility and performance of the nuclear clock concept, time-controlled excitation and depopulation of the 229Th isomer are imperative. Here we report the population of the 229Th isomeric state through resonant X-ray pumping and detection of the radiative decay in a VUV transparent 229Th-doped CaF2 crystal. The decay half-life is measured to 447(25) s, with a transition wavelength of 148.18(42) nm and a radiative decay fraction consistent with unity. Furthermore, we report a new "X-ray quenching" effect which allows to de-populate the isomer on demand and effectively reduce the half-life. Such controlled quenching can be used to significantly speed up the interrogation cycle in future nuclear clock schemes.


Conflict of interest statement

The authors declare no competing interests.

Figures

Fig. 1
Fig. 1. Experimental setup.
a The nuclear levels of 229Th and the scheme of isomer excitation and the observable signals (X-ray and VUV signals). b Overview of the system for isomer excitation and the detection of radiative decay. c Setup around the wavelength filtering devices inside the detection chamber; the moving target holder, the parabolic mirror, the prism set, the MgF2 lens, the band-pass filters, the VUV-PMT, and the VETO-PMT. d The four consecutive prisms with dichroic mirror coating inside the wavelength filtering device. e Enlarged view of the thorium-doped crystal and the crystal holder. The crystal was fixed by using stainless wires.
Fig. 2
Fig. 2. Measured resonance spectra.
a The resonance spectrum of X-ray fluorescence (NRS signals) obtained with the thorium nitrate target. b The resonance spectrum of VUV-photon signals obtained with the 229Th:CaF2 crystal. The horizontal axes of (a) and (b) indicate the absolute X-ray beam energy (offset by 29,189 eV). The vertical axis is the number of PMT counts in 1800 s after a beam irradiation time of ~600 s. The error bars in these plots represent the 68% confidence interval of statistical uncertainty. The background components (the constant offset in each Gaussian) show the beam-induced luminescence and radioluminescence from each target.
Fig. 3
Fig. 3. Determination of the isomer transition wavelength.
a The measured transmissions of the radiation from the thorium isomer through the band-pass filters (BPFs), expressed as Tmeas(i) (i = 1–6). b The transmission spectra TBPF(i, λ) for each BPF. c The six overlaid plots between TBPF(i, λ) and Tmeas(i) for each BPF, where the Tmeas(i) are located at the best-fit wavelength (see the text). d The calculated χ2 distribution defined as Eq. (1). The error bars in (a) and (c) represent the 68% confidence interval of statistical uncertainty.
Fig. 4
Fig. 4. Time evolution of 229mTh production and its decay.
a The observed time evolution of isomer production. The data points show the observed VUV counts at the time of zero in the decay signal at each excitation period (X-ray beam irradiation time). The solid black curve indicates the result of fitting with a build-up function (see the text). The dashed blue line represents the expected time evolution if T1/2(ir) equals to T1/2. Here, we scaled the amplitude of this curve to match the fitted function at infinite irradiation time. b The observed temporal profile of the isomeric decay signal after beam irradiation time of 600 s. The data points show the observed VUV counts at each elapsed time after the excitation beam was switched off. The blue solid line represents the result of fitting with an exponential decay function. The bottom row in (a) and (b) shows the corresponding residual plots for each fitting procedure. The error bars in these plots represent the 68% confidence interval of statistical uncertainty.
Fig. 5
Fig. 5. Scaling of quenching factor T1/2/T1/2(ir) with X-ray beam flux.
The horizontal axis indicates the weighted average beam intensity in photons per second. The inset shows an enlarged view near the zero-flux region. The green diamond-shaped point indicates the quenching factor at zero flux, which is equal to one. The point with the flux of 18.6 × 1010/s corresponds to the excitation dynamics depicted in Fig. 4b. The error bars represent the 68% confidence interval of statistical uncertainty. The solid line indicates a fit with a linear function where the intercept is fixed at one.
Fig. 6
Fig. 6. An example of the waveform of the oscilloscope.
Time origin t = 0 indicates the timing of the triggered event from the VUV-PMT. Some strong peaks in the waveform of the VETO-PMT are caused by radioluminescence. a Waveform taken at the beginning of one measurement. b Waveform taken at the end of one measurement.
Fig. 7
Fig. 7. The wavelength dependence of total detection efficiency of the isomeric radiation.
This total efficiency curve is estimated by multiplying the wavelength dependence of each efficiency in eq. (10).
Fig. 8
Fig. 8. Determination of wavelength using different dichroic mirrors.
a Reflectance of different dichroic mirror sets used for determination of the wavelength of radiative decay photon from 229mTh. b The obtained energy spectra of VUV-signal with the three different dichroic mirror sets. Each point corresponds to a measurement result with a beam irradiation period of 600 s. The error bars represent the 68% confidence interval of statistical uncertainty. Solid lines show the simultaneous result of a Gaussian fit with a constant background of the three spectra, where center and width are the common parameters. Color of each line in (a) corresponds to that in (b).

References

    1. Peik E, Tamm C. Nuclear laser spectroscopy of the 3.5 eV transition in Th-229. Euro. Phys. Lett. 2003;61:181. doi: 10.1209/epl/i2003-00210-x. - DOI
    1. Campbell CJ, et al. Single-ion nuclear clock for metrology at the 19th decimal place. Phys. Rev. Lett. 2012;108:120802. doi: 10.1103/PhysRevLett.108.120802. - DOI - PubMed
    1. Peik E, Tamm C. Nuclear clocks for testing fundamental physics. Quantum Sci. Technol. 2021;6:034002. doi: 10.1088/2058-9565/abe9c2. - DOI
    1. Beeks K, et al. The thorium-229 low-energy isomer and the nuclear clock. Nat. Rev. Phys. 2021;3:238. doi: 10.1038/s42254-021-00286-6. - DOI
    1. Flambaum VV. Enhanced effect of temporal variation of the fine structure constant and the strong interaction in 229Th. Phys. Rev. Lett. 2006;97:092502. doi: 10.1103/PhysRevLett.97.092502. - DOI - PubMed