. 2024 Jul 16;14(1):16387.
doi: 10.1038/s41598-024-63212-7.

At-admission prediction of mortality and pulmonary embolism in an international cohort of hospitalised patients with COVID-19 using statistical and machine learning methods

Collaborators, Affiliations

At-admission prediction of mortality and pulmonary embolism in an international cohort of hospitalised patients with COVID-19 using statistical and machine learning methods

Munib Mesinovic et al. Sci Rep. .

Abstract

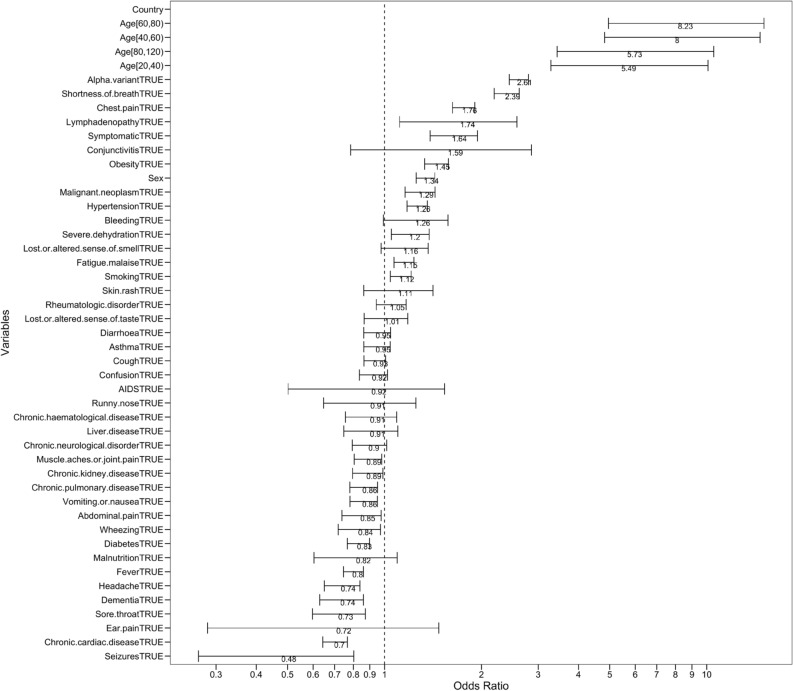
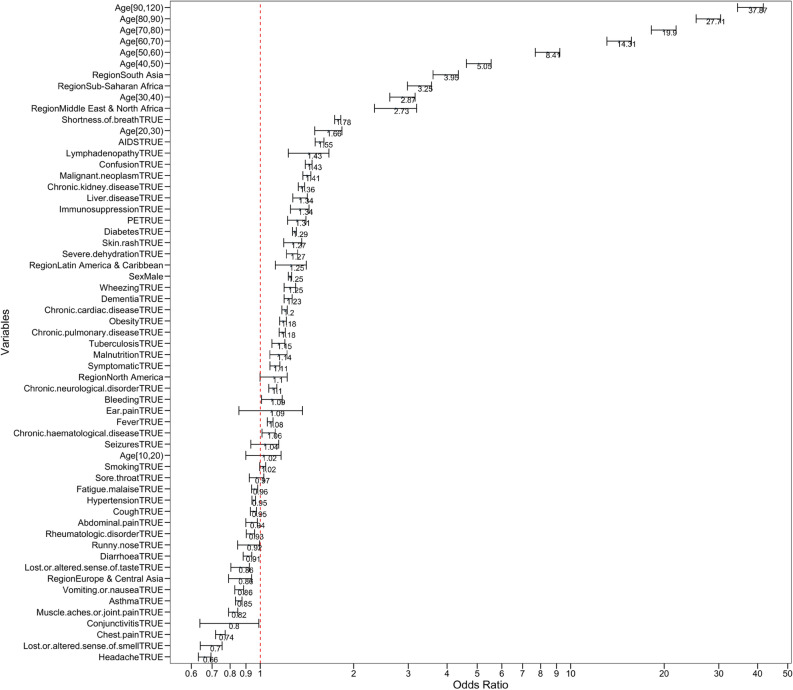
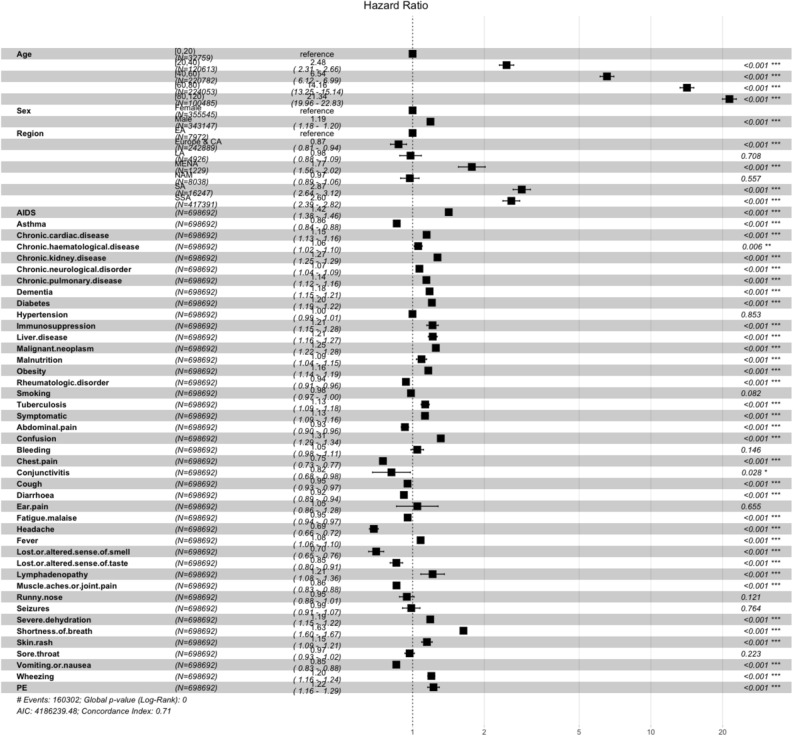
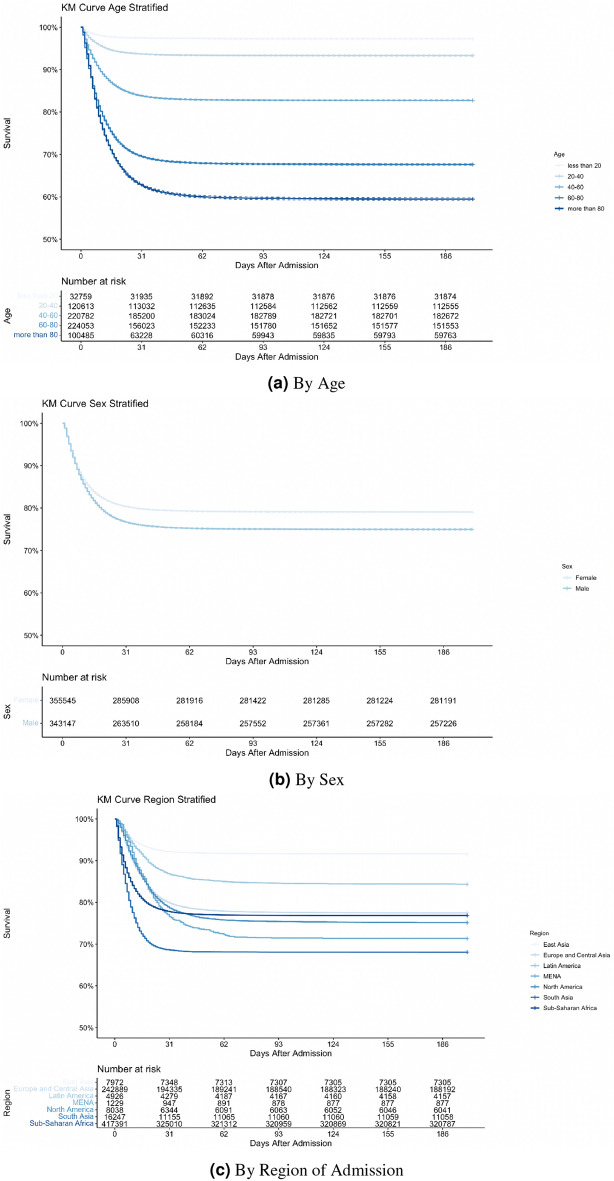
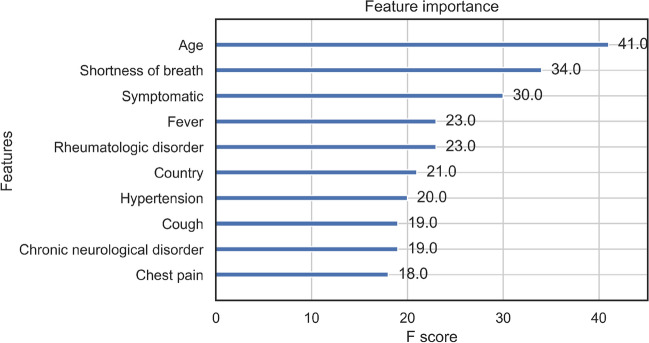
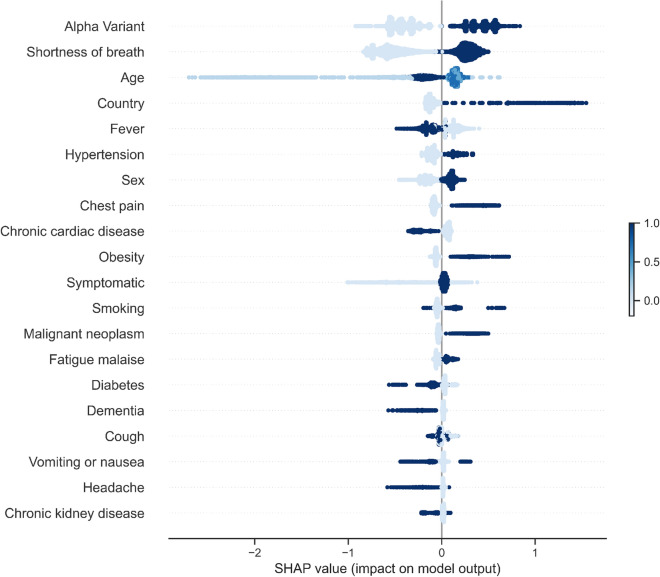
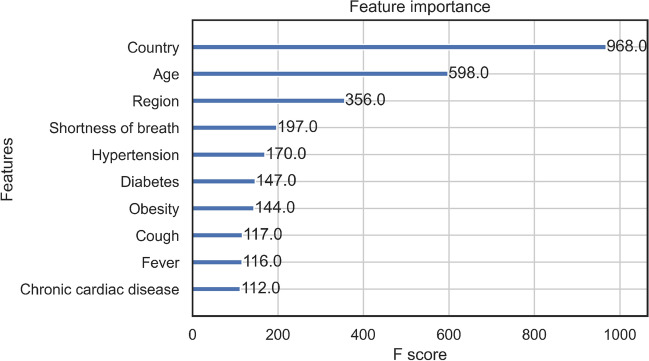
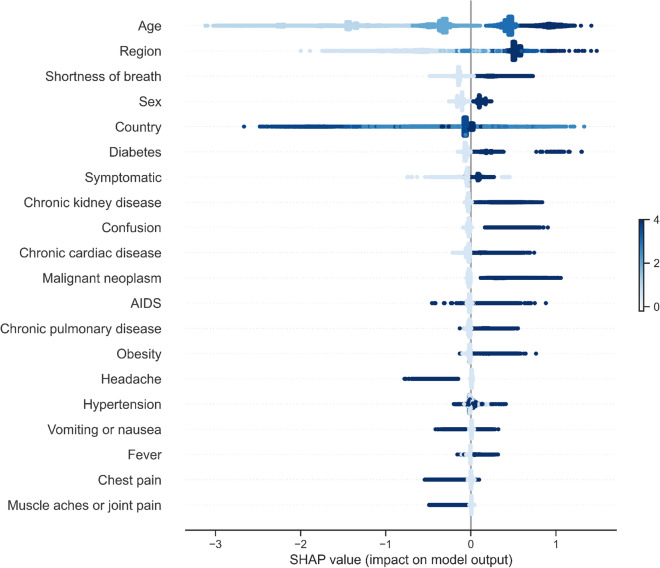
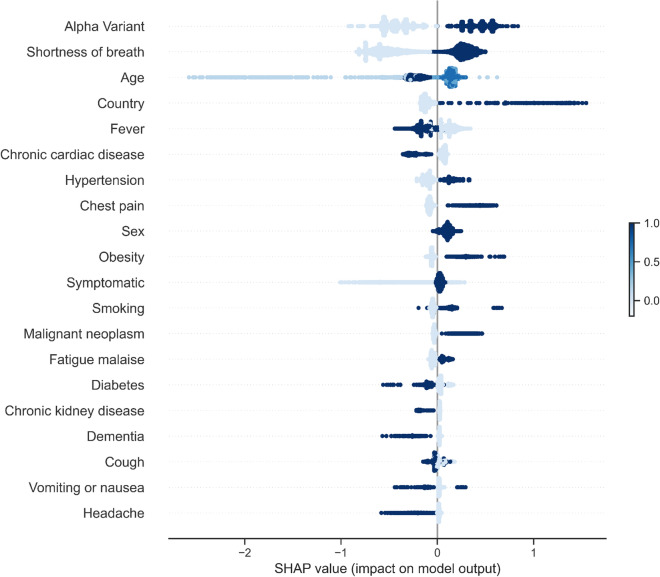
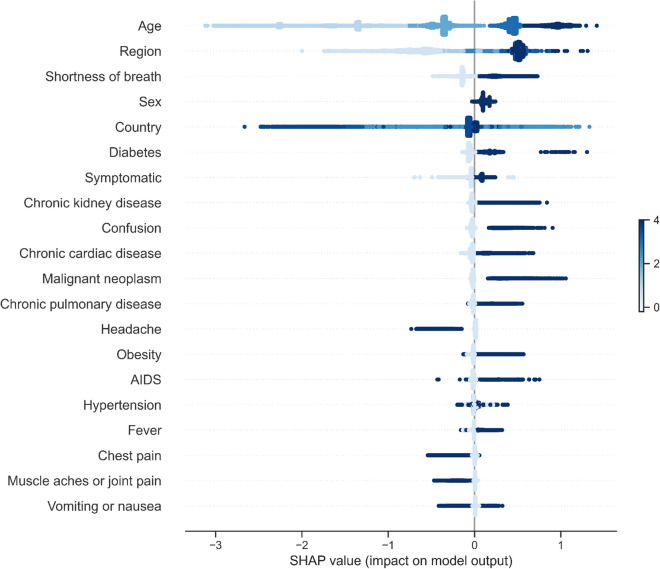
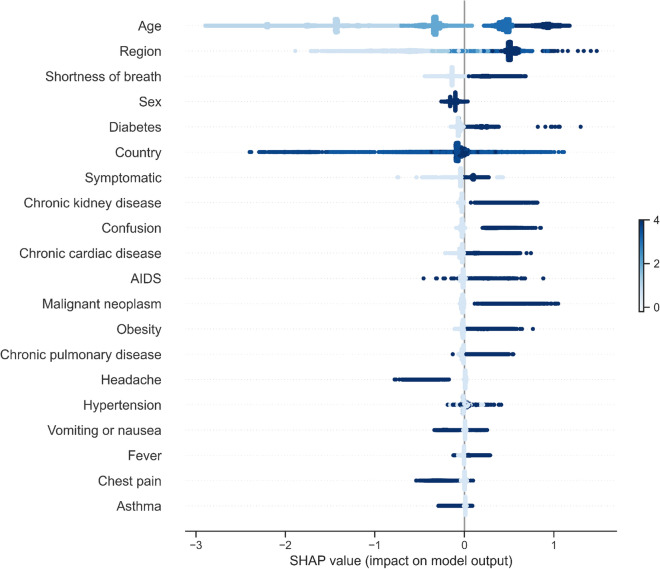
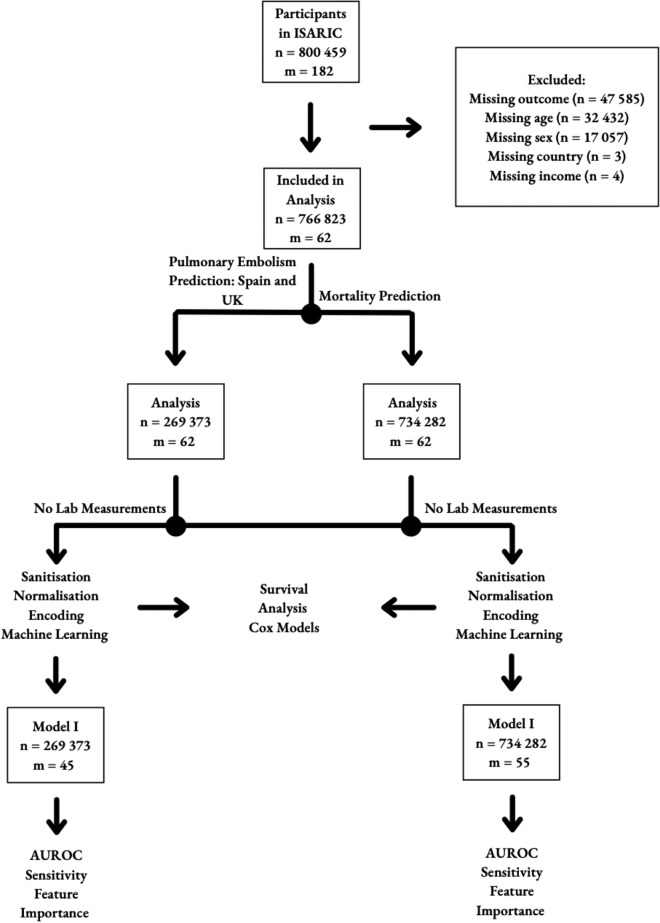
By September 2022, more than 600 million cases of SARS-CoV-2 infection have been reported globally, resulting in over 6.5 million deaths. COVID-19 mortality risk estimators are often, however, developed with small unrepresentative samples and with methodological limitations. It is highly important to develop predictive tools for pulmonary embolism (PE) in COVID-19 patients as one of the most severe preventable complications of COVID-19. Early recognition can help provide life-saving targeted anti-coagulation therapy right at admission. Using a dataset of more than 800,000 COVID-19 patients from an international cohort, we propose a cost-sensitive gradient-boosted machine learning model that predicts occurrence of PE and death at admission. Logistic regression, Cox proportional hazards models, and Shapley values were used to identify key predictors for PE and death. Our prediction model had a test AUROC of 75.9% and 74.2%, and sensitivities of 67.5% and 72.7% for PE and all-cause mortality respectively on a highly diverse and held-out test set. The PE prediction model was also evaluated on patients in UK and Spain separately with test results of 74.5% AUROC, 63.5% sensitivity and 78.9% AUROC, 95.7% sensitivity. Age, sex, region of admission, comorbidities (chronic cardiac and pulmonary disease, dementia, diabetes, hypertension, cancer, obesity, smoking), and symptoms (any, confusion, chest pain, fatigue, headache, fever, muscle or joint pain, shortness of breath) were the most important clinical predictors at admission. Age, overall presence of symptoms, shortness of breath, and hypertension were found to be key predictors for PE using our extreme gradient boosted model. This analysis based on the, until now, largest global dataset for this set of problems can inform hospital prioritisation policy and guide long term clinical research and decision-making for COVID-19 patients globally. Our machine learning model developed from an international cohort can serve to better regulate hospital risk prioritisation of at-risk patients.


Figures

Figure 1
Figure 1
Adjusted odds ratios for PE with 95% confidence intervals.
Figure 2
Figure 2
Adjusted odds ratios for death with 95% confidence intervals.
Figure 3
Figure 3
Adjusted hazard ratios for mortality with 95% confidence intervals.
Figure 4
Figure 4
Kaplan–Meier survival curve for COVID-19 patients stratified by a) age, b) sex, and c) region.
Figure 5
Figure 5
Feature importance from XGBoost PE prediction model using F1-score gain method (average contribution of each feature to predictive performance).
Figure 6
Figure 6
XGBoost feature importance with SHAP for PE. The values in the legend being higher or darker colour in the plot correspond to higher values of that feature contributing to the prediction either for stronger positive prediction (more colour points for the feature on the right side of the vertical line) or stronger negative prediction of outcome otherwise.
Figure 7
Figure 7
Feature importance from XGBoost mortality prediction model using F1-score gain method (average contribution of each feature to predictive performance).
Figure 8
Figure 8
XGBoost feature importance with SHAP for mortality. The values in the legend being higher or darker colour in the plot correspond to higher values of that feature contributing to the prediction either for stronger positive prediction (more colour points for the feature on the right side of the vertical line) or stronger negative prediction of outcome otherwise.
Figure 9
Figure 9
XGBoost feature importance with SHAP for PE (only men). The values in the legend being higher or darker colour in the plot correspond to higher values of that feature contributing to the prediction either for stronger positive prediction (more colour points for the feature on the right side of the vertical line) or stronger negative prediction of outcome otherwise.
Figure 10
Figure 10
XGBoost feature importance with SHAP for PE (only women). The values in the legend being higher or darker colour in the plot correspond to higher values of that feature contributing to the prediction either for stronger positive prediction (more colour points for the feature on the right side of the vertical line) or stronger negative prediction of outcome otherwise.
Figure 11
Figure 11
XGBoost feature importance with SHAP for mortality (only men). The values in the legend being higher or darker colour in the plot correspond to higher values of that feature contributing to the prediction either for stronger positive prediction (more colour points for the feature on the right side of the vertical line) or stronger negative prediction of outcome otherwise.
Figure 12
Figure 12
XGBoost feature importance with SHAP for mortality (only women). The values in the legend being higher or darker colour in the plot correspond to higher values of that feature contributing to the prediction either for stronger positive prediction (more colour points for the feature on the right side of the vertical line) or stronger negative prediction of outcome otherwise.
Figure 13
Figure 13
Age distribution for all patients stratified by death outcome.
Figure 14
Figure 14
Age distribution for UK and Spain patients.
Figure 15
Figure 15
Flowchart of framework with machine learning model to predict the risk of PE and mortality at admission.

References

    1. WHO. Novel coronavirus (2019-ncov): situation report, 11. (2020).
    1. University, J. H. Covid-19 dashboard by the center for systems science and engineering (csse) (2022).
    1. Yang X, et al. Clinical course and outcomes of critically ill patients with sars-cov-2 pneumonia in Wuhan, China: A single-centered, retrospective, observational study. Lancet Respir. Med. 2020;8:475–481. doi: 10.1016/S2213-2600(20)30079-5. - DOI - PMC - PubMed
    1. Liao S-C, Shao S-C, Chen Y-T, Chen Y-C, Hung M-J. Incidence and mortality of pulmonary embolism in covid-19: A systematic review and meta-analysis. Crit. Care. 2020;24:1–5. - PMC - PubMed
    1. Knight SR, et al. Prospective validation of the 4c prognostic models for adults hospitalised with covid-19 using the isaric who clinical characterisation protocol. Thorax. 2021;77:606–615. doi: 10.1136/thoraxjnl-2021-217629. - DOI - PMC - PubMed