. 2024 Jul 16;14(1):16459.
doi: 10.1038/s41598-024-65410-9.

SGLT2 inhibitors attenuate endothelial to mesenchymal transition and cardiac fibroblast activation

Affiliations

SGLT2 inhibitors attenuate endothelial to mesenchymal transition and cardiac fibroblast activation

Kevin Schmidt et al. Sci Rep. .

Abstract

Beneficial effects of sodium glucose co-transporter 2 inhibitors (SGLT2is) in cardiovascular diseases have been extensively reported leading to the inclusion of these drugs in the treatment guidelines for heart failure. However, molecular actions especially on non-myocyte cells remain uncertain. We observed dose-dependent inhibitory effects of two SGLT2is, dapagliflozin (DAPA) and empagliflozin (EMPA), on inflammatory signaling in human umbilical vein endothelial cells. Proteomic analyses and subsequent enrichment analyses discovered profound effects of these SGLT2is on proteins involved in mitochondrial respiration and actin cytoskeleton. Validation in functional oxygen consumption measurements as well as tube formation and migration assays revealed strong impacts of DAPA. Considering that most influenced parameters played central roles in endothelial to mesenchymal transition (EndMT), we performed in vitro EndMT assays and identified substantial reduction of mesenchymal and fibrosis marker expression as well as changes in cellular morphology upon treatment with SGLT2is. In line, human cardiac fibroblasts exposed to DAPA showed less proliferation, reduced ATP production, and decelerated migration capacity while less extensive impacts were observed upon EMPA. Mechanistically, sodium proton exchanger 1 (NHE1) as well as sodium-myoinositol cotransporter (SMIT) and sodium-multivitamin cotransporter (SMVT) could be identified as relevant targets of SGLT2is in non-myocyte cardiovascular cells as validated by individual siRNA-knockdown experiments. In summary, we found comprehensive beneficial effects of SGLT2is on human endothelial cells and cardiac fibroblasts. The results of this study therefore support a distinct effect of selected SGLT2i on non-myocyte cardiovascular cells and grant further insights into potential molecular mode of action of these drugs.

Keywords: Cardiovascular diseases; Cell migration; Endothelial cell; Fibroblasts; Inflammation; Oxygen consumption; Sodium-glucose transporter 2 inhibitors.


Conflict of interest statement

T.T. is founder and CSO/CMO of Cardior Pharmaceuticals GmbH, a wholly-owned subsidiary of Novo Nordisk A/S (outside of the content of this manuscript). All other authors have no conflict of interest.

Figures
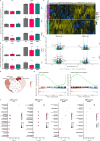
Figure 1
Figure 1
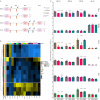
SGLT2is influence inflammatory signaling as well as mitochondrial parameters and actin cytoskeleton. (A) NF-kB dependent luciferase activity in human embryonal kidney 293FT reporter cells. Applied concentrations of dapagliflozin (DAPA) and empagliflozin (EMPA) are indicated on the right (n = 3). (B) Relative mRNA expression of NF-kB downstream targets intercellular adhesion molecule (ICAM) 1 (top) and interleukin (IL) 6 (bottom) in human umbilical vein endothelial cells treated with 100 µM DAPA or EMPA or the respective control (Ctrl) (n = 3). (C) Heatmap showing by-protein Z-scores of intensities of proteins that are differentially regulated within the presented dataset (ǀintensity differenceǀ > 1 and adjusted p-value < 0.05). Hierarchical clustering was done based on Euclidean distance. Child and parent row dendrograms are separated by a dashed line (n = 3). (D) Volcano plots depicting dysregulated proteins by pairwise comparison (indicated above) in vehicle (veh) and polyinosinic:polycytidylic acid (polyIC) exposed HUVECs. (E) Venn-diagrams highlighting the overlap of all proteins that are regulated compared to the respective Ctrl among different groups investigated in proteomics analysis. (F) Analysis of pairwise dysregulated proteins (comparison indicated above) in veh and polyIC stimulated HUVECs for overrepresentation of gene ontology (GO) terms. Analysis was done with Enrichr. Dashed line indicates p-value cutoff. (G) Gene set enrichment analysis of proteins for comparison of DAPA (left) and EMPA (right) versus Ctrl in unstimulated HUVECs. Relevant terms are plotted, ranking was based on respective expression differences. a.u., arbitrary units; norm., normalized; β-gal, β-galactosidase; HPRT, hypoxanthine–guanine phosphoribosyltransferase.
Figure 2
Figure 2
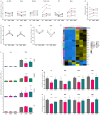
Sodium-glucose co-transporter 2 inhibitors influence HUVEC metabolism and migration. (A) Exemplary oxygen consumption rate (OCR) profile (top, 8 technical replicates) and values for mitochondrial respiration calculated based on OCR profiles (bottom, n = 3) of Seahorse Mito Stress test assays of human umbilical vein endothelial cells (HUVECs) treated as indicated in EGM-2. In the upper graph, dashed lines separate measurement intervals between injections of different compounds (described above, “Basal “ means no compound added), means and standard errors are shown for measurements at each time point. FCCP, carbonyl cyanide-p-trifluoromethoxyphenylhydrazone; R/A, rotenone/antimycin A; Non_Mito, non-mitochondrial oxygen consumption; Basal, basal respiration; Maximal, maximal respiration; ATP, ATP production; Spare, spare respiratory capacity. (B) Representative extracellular acidification rate (ECAR) profile (top, 8 technical replicates) and ECAR values normalized (norm.) to Control (Ctrl) / vehicle (veh) group at the “Basal “ assay stage (bottom, n = 3). (C) Exemplary graph illustrating reactive oxygen species (ROS) levels in HUVECs treated as indicated assessed with H2DCFDA assay (top, 6 technical replicates). Means (solid lines) and standard errors (dashed lines) are shown. a.u., arbitrary units. Area under curve (AUC) of relative fluorescence units (RFU) curves (bottom, n = 4). (D) Relative areas covered (RAC) of the initial wound area in scratch assays of human umbilical vein endothelial cells (HUVECs) normalized to control (Ctrl) treated, vehicle (veh) receiving cells (right, n = 3). Representative “DAPI “ channel images of HUVECs (veh group) stained with Hoechst33342 are shown on the left. Wound borders at 0 h and 16 h are outlined in red. (E) Area and number of meshes formed by (treated) HUVECs on Matrigel after 24 h were evaluated by processing acquired z-projected bright field images (examples on the left) with the Angiogenesis Analyzer plugin for Fiji. Paired t-testing had to be applied due to high variations among the individual biological replicates (n = 3). Scale bar (green), 500 µm. DAPA, dapagliflozin; EMPA, empagliflozin; polyIC, polyinosinic:polycytidylic acid.
Figure 3
Figure 3
SGLT2i regulate EndMT. (A) Schematic representation of the experimental design to assess the influence of sodium-glucose co-transporter inhibitors (SGLT2is) on endothelial to mesenchymal transition (EndMT). Human umbilical vein endothelial cells (HUVECs) were seeded on day 0, 24 h prior to exchange of media. Groups were described as “EMT “, receiving EndMT medium from day 1 until the end of the experiment, or “Rev “, changing to EGM-2 after 6 days of EndMT induction. The second part of the name indicates the first day of treatment application. (B) Heatmap showing by-gene Z-scores of mRNA expression levels normalized (norm.) to β-glucuronidase (GUSB) of several genes from different categories assessed by quantitative real-time polymerase chain reaction. Hierarchical clustering was done based on Euclidean distance. Child and parent row dendrograms are separated by a dashed line (n ≥ 4). (C) Relative expression of representative genes for each assessed category. Bar outlines are colored according to the “category “ legend in (B). DAPA, dapagliflozin; EMPA, empagliflozin; Ctrl, control; TAGLN, transgelin; PECAM, platelet endothelial cell adhesion molecule; COL, collagen; IL, interleukin; PFKP, phosphofructokinase, platelet; CDKN, cyclin-dependent kinase inhibitor.
Figure 4
Figure 4
Dapagliflozin regulates fibroblast proliferation and migration. (A) Values for mitochondrial respiration calculated based on oxygen consumption rate profiles of primary human cardiac fibroblasts (HCFs) from different origins. Non_Mito, non-mitochondrial oxygen consumption; Basal, basal respiration; Maximal, maximal respiration; ATP, ATP production; Spare, spare respiratory capacity (n = 6). (B) Extracellular acidification rate values at the different Seahorse Mito Stress test assay “Basal “ stage. FCCP, carbonyl cyanide-p-trifluoromethoxyphenylhydrazone; R/A, rotenone/antimycin A (n = 6). (C) Percentage of carboxyfluorescein succinimidyl ester stained HCFs above the defined intensity threshold (n = 4). (D) Area under curve (AUC) of relative areas covered (RAC) of the initial wound area in scratch assays of HCFs over time normalized to control (Ctrl) treated, vehicle (veh) receiving cells (n = 3). (E) Heatmap showing by-gene Z-scores of mRNA expression levels in human cardiac fibroblasts (HCFs) receiving indicated treatments. Expression levels of several genes from different categories assessed by quantitative real-time polymerase chain reaction were normalized (norm.) to β-glucuronidase (GUSB) and hypoxanthine–guanine phosphoribosyltransferase (HPRT). Hierarchical clustering was done based on Euclidean distance. Child and parent column dendrograms are separated by a dashed line (n = 3). (F) Relative expression of representative genes for each assessed category. Bar outlines are colored according to the “category” legend in (E). (G) Area under curve (AUC) of relative areas covered (RAC) of the initial wound area in scratch assays of human umbilical vein endothelial cells over time normalized to control (Ctrl) treated cells transfected with scrambled siRNA (scr) (n = 3). (H) Relative content of 5-bromo-2'-deoxyuridine (BrdU) incorporated over 24 h into DNA of replicating HCFs under indicated conditions. Targets of siRNA transfections are indicated above (n = 3). DAPA, dapagliflozin; EMPA, empagliflozin; TGFb, transforming growth factor β; ACTC1, cardiac muscle alpha actin; CDKN, cyclin-dependent kinase inhibitor; COL, collagen; IL, interleukin; SMIT, sodium-myoinositol transporter 1; SMVT, sodium-multivitamin transporter; NHE, sodium-proton exchanger.
Figure 5
Figure 5
Overview of cardiovascular-protective effects of SGLT2is. SGLT2is regulate activation of endothelial cells after stress stimuli by interfering with expression of cytokines and adhesion molecules which are crucial for recruitment and activation of immune cells. Endothelial to mesenchymal transition is reduced by SGLT2is thereby altering pro-fibrotic signaling and fibroblast activation. A direct interference of SGLT2is with features of activated fibroblasts such as proliferation and migration reduces overall fibrotic load and adverse tissue remodeling ultimately hindering disease progression. Created in Biorender.com.

References

    1. Ehrenkranz JRL, Lewis NG, Ronaldkahn C, Roth J. Phlorizin: a review. Diabetes Metab. Res. Rev. 2005;21:31–38. doi: 10.1002/dmrr.532. - DOI - PubMed
    1. Uthman L, et al. Direct cardiac actions of sodium glucose cotransporter 2 inhibitors target pathogenic mechanisms underlying heart failure in diabetic patients. Front. Physiol. 2018;9:1575. doi: 10.3389/fphys.2018.01575. - DOI - PMC - PubMed
    1. Heerspink HJL, et al. Dapagliflozin in patients with chronic kidney disease. N. Engl. J. Med. 2020;383:1436–1446. doi: 10.1056/NEJMoa2024816. - DOI - PubMed
    1. Zinman B, et al. Empagliflozin, cardiovascular outcomes, and mortality in type 2 diabetes. N. Engl. J. Med. 2015;373:2117–2128. doi: 10.1056/NEJMoa1504720. - DOI - PubMed
    1. Perkovic V, et al. Canagliflozin and renal outcomes in type 2 diabetes and nephropathy. N. Engl. J. Med. 2019;380:2295–2306. doi: 10.1056/NEJMoa1811744. - DOI - PubMed

MeSH terms

LinkOut - more resources