. 2024 Jul 16;15(1):5980.
doi: 10.1038/s41467-024-50362-5.

Metabolic imaging across scales reveals distinct prostate cancer phenotypes

Affiliations

Metabolic imaging across scales reveals distinct prostate cancer phenotypes

Nikita Sushentsev et al. Nat Commun. .

Abstract

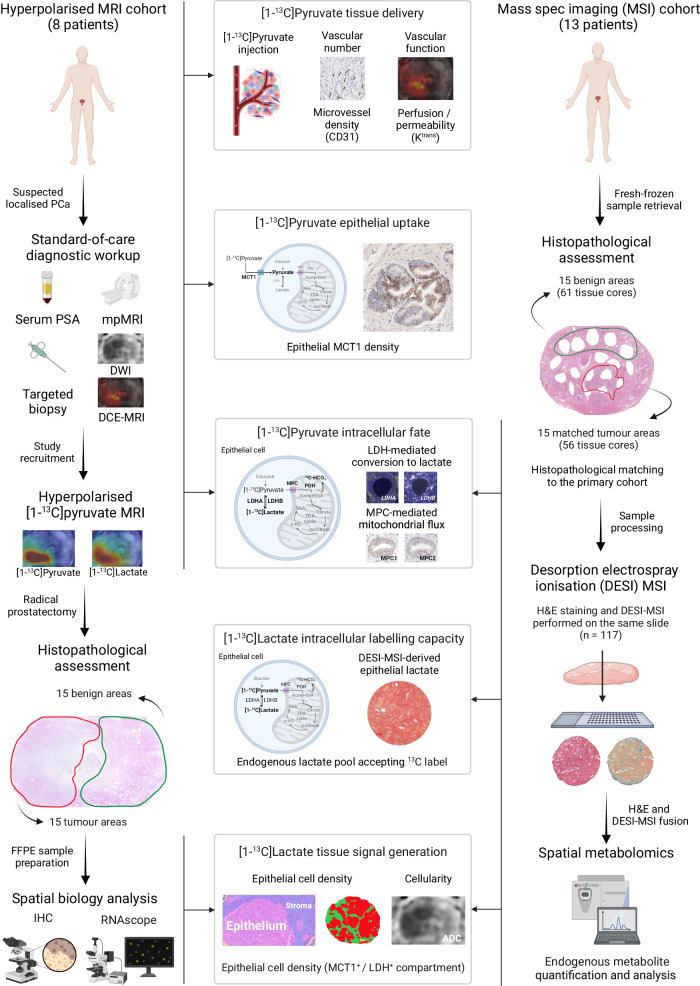
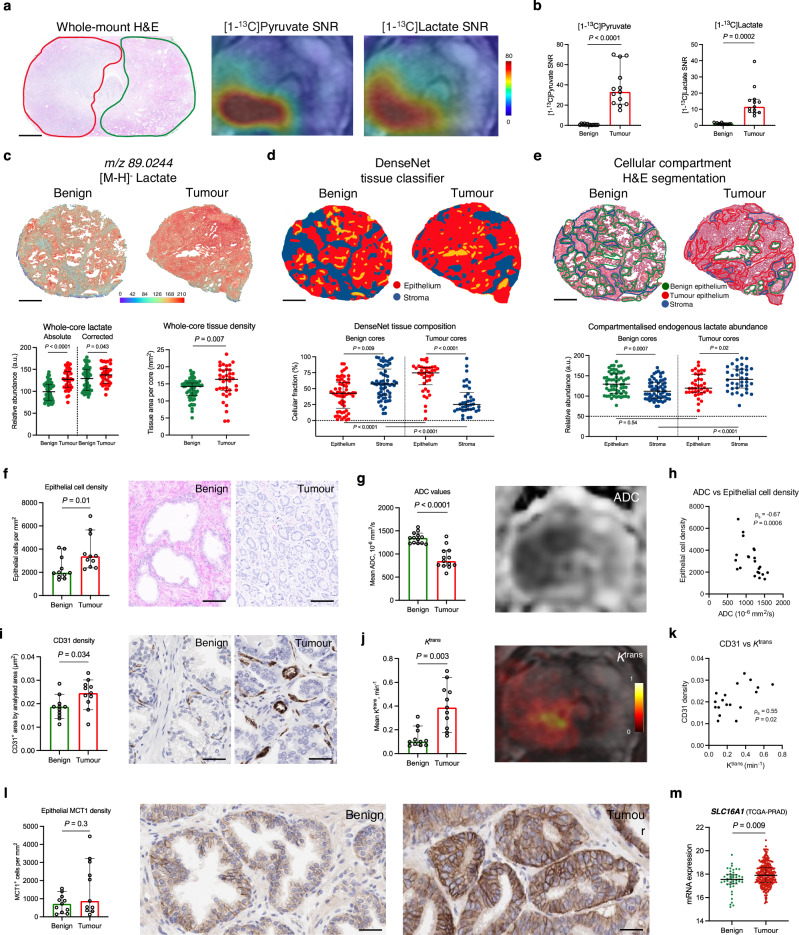
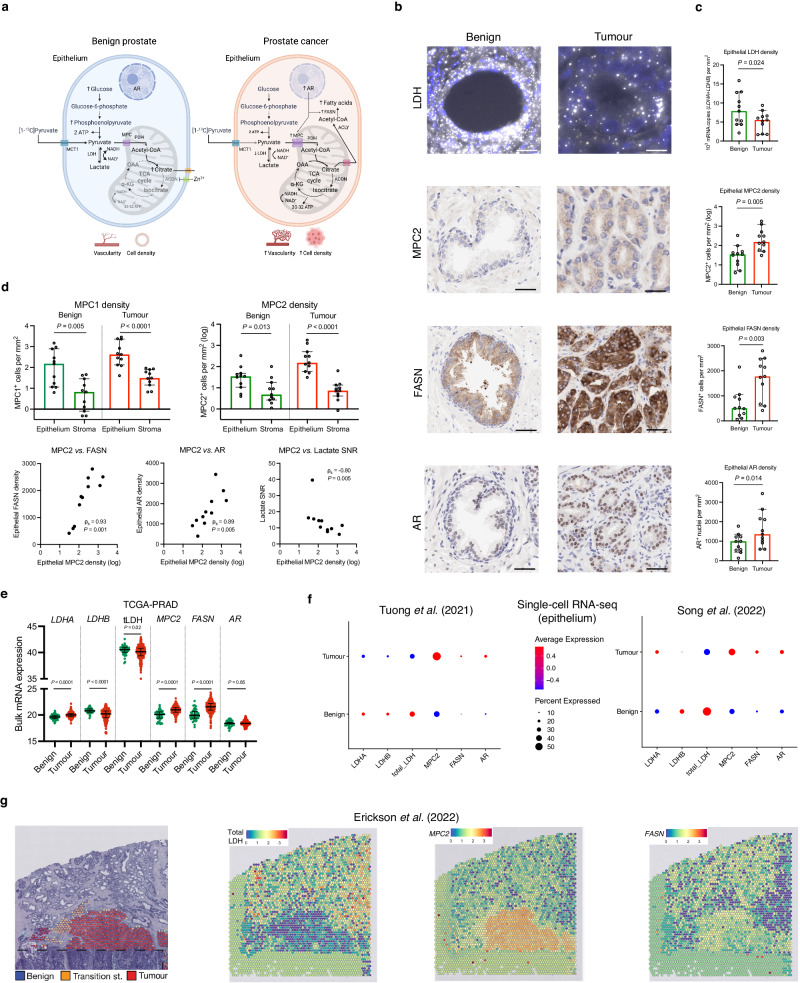
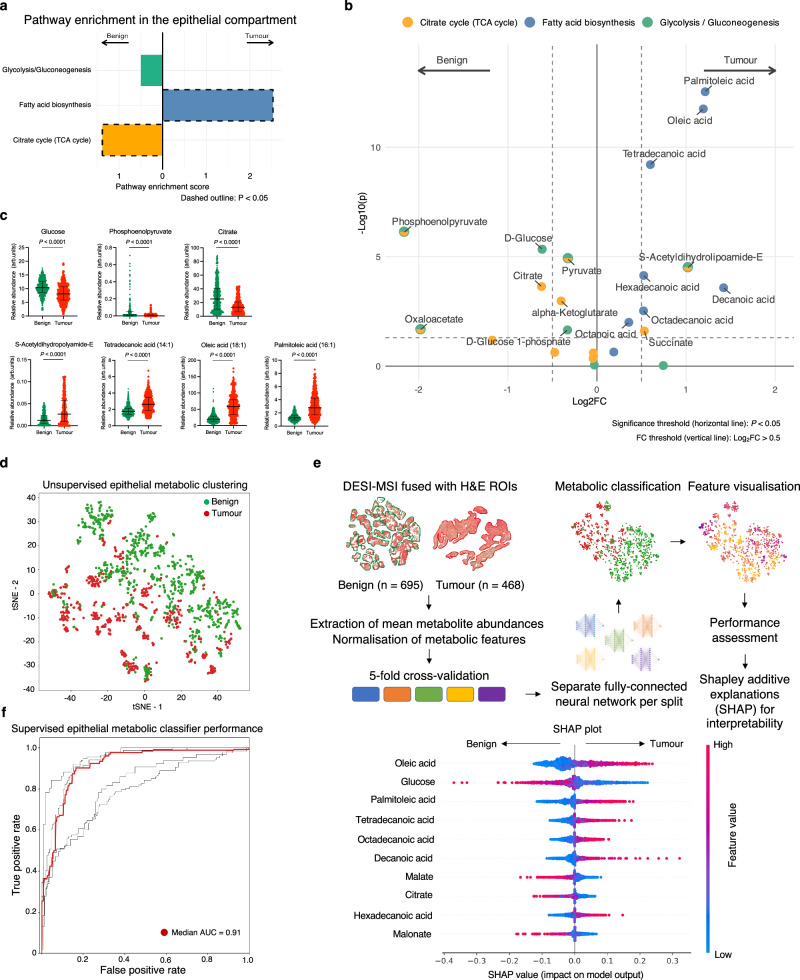
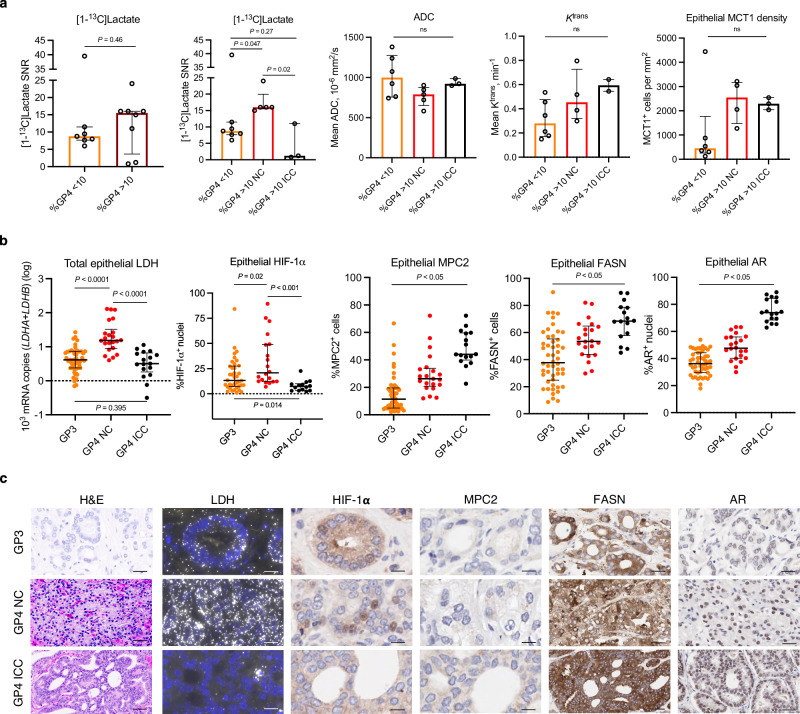
Hyperpolarised magnetic resonance imaging (HP-13C-MRI) has shown promise as a clinical tool for detecting and characterising prostate cancer. Here we use a range of spatially resolved histological techniques to identify the biological mechanisms underpinning differential [1-13C]lactate labelling between benign and malignant prostate, as well as in tumours containing cribriform and non-cribriform Gleason pattern 4 disease. Here we show that elevated hyperpolarised [1-13C]lactate signal in prostate cancer compared to the benign prostate is primarily driven by increased tumour epithelial cell density and vascularity, rather than differences in epithelial lactate concentration between tumour and normal. We also demonstrate that some tumours of the cribriform subtype may lack [1-13C]lactate labelling, which is explained by lower epithelial lactate dehydrogenase expression, higher mitochondrial pyruvate carrier density, and increased lipid abundance compared to lactate-rich non-cribriform lesions. These findings highlight the potential of combining spatial metabolic imaging tools across scales to identify clinically significant metabolic phenotypes in prostate cancer.


Conflict of interest statement

G.H., L.F., D.B., J.R., S.L., J.Y.T., S.T.B., and R.J.A.G. are AstraZeneca employees. F.A.G. has research support from GE Healthcare and AstraZeneca, grants from GlaxoSmithKline, and has consulted for AstraZeneca on behalf of the University of Cambridge. The remaining authors declare no competing interests.

Figures

Fig. 1
Fig. 1. Study design.
This clinical study included two prospective surgical cohorts of PCa patients whose imaging data and surgical specimens were analysed to measure five biological factors that can influence clinical [1-13C]lactate labelling. In the Hyperpolarised MRI cohort (n = 8 patients), quantitative 1H-MRI, immunohistochemistry (IHC), and RNAscope data were used to infer tissue delivery, epithelial uptake, and the intracellular metabolic fate of [1-13C]pyruvate in 15 tumour and 15 benign areas. This was complemented by spatial metabolomic analysis of a set of histologically matched fresh-frozen benign (n = 61) and tumour (n = 56) samples from a DESI-MSI cohort (n = 13 patients), which enabled us to assess the endogenous lactate pool as a measure of the cellular capacity for [1-13C]labelling. Digital pathology data from both cohorts were used to quantify the density of epithelial cells as a measure of tissue capacity for generating detectable [1-13C]lactate signal. Tumour characteristics and methods are detailed in Table 1 and Methods. This figure was created with BioRender.com and released under a Creative Commons Attribution-NonCommercial-NoDerivs 4.0 International license.
Fig. 2
Fig. 2. Biological validation of the ability of HP-13C-MRI to detect PCa by differentiating it from the healthy prostate.
a Representative whole-mount H&E section of a surgical FFPE sample obtained from a patient who harboured a single focus of ISUP GG2 PCa (red outline) that showed increased [1-13C]pyruvate and [1-13C]lactate signal on corresponding HP-13C-MRI maps compared to contralateral benign prostate (green outline). b Plots comparing [1-13C]pyruvate and [1-13C]lactate SNR derived from the ROIs encompassing areas of HP-13C-MRI-visible PCa (n = 13 samples from n = 8 patients) and contralateral benign prostate (n = 13 samples from n = 8 patients) from the hyperpolarised MRI cohort. c Representative fused H&E and DESI-MSI lactate maps of benign and tumour FF cores from the spatial metabolomics cohort. Plots on the left compare the absolute and tissue-density-corrected whole-core DESI-MSI derived lactate abundance between the benign (n = 61) and tumour (n = 38) cores; plots on the right compare the whole-core tissue density between the two specimen types. d DenseNet tissue classifier outputs overlaid on the H&E images of representative benign (n = 61) and tumour (n = 38) cores, with the below plots comparing epithelial and stromal cell fractions both within and across the benign and tumour cores. e H&E maps of representative benign (n = 61 samples from n = 13 patients) and tumour (n = 38 samples from n = 13 patients) cores with manually segmented areas of benign epithelium (green), tumour epithelium (red), and stroma (blue) used to derive DESI-MSI measured of endogenous lactate abundance compared in the below plots between and across benign and tumour cores. Plots and representative images comparing epithelial cell density (f), 1H-MRI-derived ADC (g), CD31 density (i), 1H-MRI-derived Ktrans (j), and epithelial MCT1 density (l) between the benign (n = 11) and tumour (n = 11) areas from the hyperpolarised MRI cohorts. Present Spearman’s correlation plots comparing ADC values with epithelial cell density (h), as well as CD31 with Ktrans (k) derived from both benign and tumour areas. m Plot comparing TCGA-PRAD derived SLC16A1 mRNA expression between the benign (n = 45) and tumour (n = 293) prostatectomy samples from n = 293 patients. All plots are scatterplots with bars (lines are median values, bars are interquartile ranges) with P derived using the two-sided Mann–Whitney U test or Wilcoxon signed-rank test, as appropriate. Scale bars in a, ce, and fl denote 5 mm, 1 mm, and 50 μm, respectively. Source data are provided as a Source Data file.
Fig. 3
Fig. 3. The role of mitochondrial pyruvate import in PCa metabolic reprogramming and its impact on clinical [1-13C]lactate labelling.
a Schematic representation of the proposed differences in the metabolic fate of [1-13C]pyruvate between the benign and malignant prostatic epithelium, with the latter showing increased mitochondrial pyruvate uptake via AR-regulated MPCs to fuel both the restored TCA cycle and FASN-catalysed fatty acid biosynthesis. b Representative fluorescent RNAscope images of epithelial mRNA LDHA (gold) and LDHB (white) expression, along with IHC images of epithelial MPC2, FASN, and AR expression in the benign and malignant glands. c Scatterplots with bars comparing the expression of epithelial LDH, MPC2, FASN, and AR density between the benign (n = 11 samples) and tumour (n = 11 samples) areas from the HP-13C-MRI cohort (n = 7 patients). d Top: Plots comparing the log-transformed epithelial and stromal MPC1 and MPC2 densities in the benign (n = 11 samples) and tumour (n = 11 samples) areas from the HP-13C-MRI cohort (n = 7 patients). Bottom: Spearman’s correlation plots comparing tumour epithelial MPC2 density against tumour epithelial FASN and AR densities, as well as HP-13C-MRI-derived [1-13C]lactate SNR. e Mixed box-and-whisker and scatterplots comparing TCGA-PRAD derived bulk mRNA expression of LDHA, LDHB, total LDH, MPC2, FASN, and AR between benign (n = 45) and tumour (n = 293) prostatectomy samples from n = 293 patients. f Average expression dot plots comparing single-cell RNA-seq epithelial expression of the same genes from publicly available EGAS00001005787 (left) and GSE176031 (right) datasets. g H&E map of a surgical specimen including areas of benign and malignant prostate with corresponding spatial transcriptomics maps demonstrating the expression of total LDH, MPC2, and FASN obtained from a publicly available EGAS00001006124 dataset. In ce, lines are median values and bars are interquartile ranges, with P derived using the two-sided Mann–Whitney U test or Wilcoxon signed-rank test, as appropriate. Scale bars denote 5–10 μm. Source data are provided as a Source Data file. d was created with BioRender.com and released under a Creative Commons Attribution-NonCommercial-NoDerivs 4.0 International license.
Fig. 4
Fig. 4. Spatially resolved metabolic profiling of the benign and malignant prostatic epithelium.
a Outputs of the DESI-MSI-derived MPEA demonstrating comparative enrichment of KEGG glycolysis, fatty acid biosynthesis, and TCA cycle pathways in benign (n = 695) and tumour (n = 468) ROIs from the spatial metabolomics cohort (n = 13 patients). b Volcano plot showing individual differentially enriched metabolites from the three KEGG pathways between the benign and tumour ROIs; P were derived using the FDR-corrected Wilcoxon rank sum test. c Mixed box-and-whisker and scatterplots comparing epithelial abundance of the key differentially enriched metabolites between benign and tumour epithelial ROIs; the data are presented as median and interquartile range; P were derived using the two-tailed Mann–Whitney U test; the sample size in each plot varies depending on the number of outliers excluded using the ROUT method (Q = 5%). For illustrative purposes, outliers were removed using the ROUT method with Q = 5%. d tSNE plot of DESI-MSI data acquired from the benign and tumour ROIs focusing on ions corresponding to metabolites related to the three KEGG pathways. e Summary diagram describing the key steps in developing a deep learning based metabolic tissue classifier using DESI-MSI derived metabolites from the three KEGG pathways to discriminate between benign and tumour epithelial ROIs; the SHAP plot lists the ten most important metabolites used by the final model to achieve a median performance of 0.91 presented in an AUC plot in f. Source data are provided as a Source Data file.
Fig. 5
Fig. 5. Comparative assessment of biological factors underpinning HP-13C-MRI-visibility of biopsy-proven PCa.
a, b Whole-mount H&E, ADC, along with [1-13C]pyruvate and [1-13C]lactate SNR maps demonstrating the presence of large, cellular ISUP GG3 lesions with dominant ICC component that were HP-13C-MRI occult compared to contralateral small-volume foci of ISUP GG2 disease with <5% non-cribriform GP4 glands. c Comparator case of a HP-13C-MRI-visible large cribriform ISUP GG3 tumour that was also visible on 1H-MRI ADC. d Representative H&E slides, along with corresponding IHC-derived CD31, MCT1, MPC2, FASN, AR, and RNAscope-derived total LDH images obtained from HP-13C-MRI-visible and HP-13C-MRI-occult lesions shown in ac. e Mixed box-and-whisker and scatterplots comparing [1-13C]pyruvate and [1-13C]lactate SNR, epithelial cell density, CD31 density, as well as epithelial MCT1, LDH, MPC2, FASN, and AR density between HP-13C-MRI-visible (n = 13 samples) and HP-13C-MRI-occult (n = 2 samples) lesions from the hyperpolarised MRI cohort (n = 8 patients). ad include images from three separate patients; imaging and staining were not repeated. In e, the data points for the 13C-visible ICC tumour are coloured in black. Scale bars in ac and d denote 5 mm and 5–50 μm, respectively. Source data are provided as a Source Data file.
Fig. 6
Fig. 6. Comparative metabolic characterisation of intermediate-risk PCa with varying percentage and phenotype of GP4 disease.
a Scatterplots with bars comparing clinical [1-13C]lactate labelling between tumours divided based on the percentage (far left; n = 7 samples for low %GP4 and n = 8 samples for high %GP4 lesions, respectively) and histological subtype (second from left; n = 7 samples for low %GP4, n = 5 samples for non-cribriform high %GP4, and n = 3 samples for cribriform high %GP4 lesions, respectively) of GP4 disease from n = 8 patients. Intergroup comparisons of 1H-MRI-derived tumour ADC and Ktrans, as well as tissue-based epithelial MCT1 density are also presented. b Mixed box-and-whisker and scatterplots comparing tissue-based total epithelial LDH, nuclear HIF-1α, MPC2, FASN, and nuclear AR between ROIs harbouring individual GP3 (n = 50), non-cribriform GP4 (n = 22), and GP4 ICC (n = 17) glands from n = 8 patients. c Representative H&E, RNAscope, and IHC images illustrating differential expression of tissue-based metabolic biomarkers between the three Gleason pattern glands. In a, b, the data are presented as median (denoted by the bars or boxes) with interquartile range (denoted by the bars or whiskers). P were derived using the two-sided Mann–Whitney U test. Source data are provided as a Source Data file. Scale bars denote 5–50 μm.
Fig. 7
Fig. 7. Spatially resolved metabolic phenotyping of intermediate-risk human PCa.
a Mixed box-and-whisker plots comparing DESI-MSI derived epithelial lactate abundance between cores derived from lesions with low %GP4 (n = 19 samples) and high %GP4 (n = 19 samples) (far left), as well as between cores sub-stratified by the division of high %GP4 lesions into those with dominant non-cribriform (n = 10 samples) and cribriform (n = 9 samples) GP4 component (second left) from n = 13 patients. Plots demonstrating intergroup comparison of epithelial palmitoleic acid pool and epithelial cell fraction are also presented; the data are presented as median (boxes) with interquartile ranges (whiskers); P were derived using the two-sided Mann–Whitney U test. b Representative fused H&E and DESI-MSI lactate and palmitoleic acid images demonstrating differential metabolite abundance between GP3 (yellow), GP4 non-cribriform (red), and GP4 cribriform (black) glands. c MPEA outputs demonstrating differential enrichment of glycolysis, TCA cycle, and fatty acid biosynthesis KEGG pathways and individual metabolites between ROIs classified as benign and GP3 (n = 360), non-cribriform GP4 (n = 70), and cribriform GP4 (n = 36) glands from n = 13 patients; P were derived using the FDR-corrected Wilcoxon signed-rank test. d Diagram summarising the key results of this study and highlighting the presence of lactate-rich non-cribriform and lactate-poor, fatty acid-rich cribriform GP4 phenotypes within intermediate-risk PCa. Source data are provided as a Source Data file. d was created with BioRender.com and released under a Creative Commons Attribution-NonCommercial-NoDerivs 4.0 International license.

References

    1. Kurhanewicz J, et al. Hyperpolarized 13C MRI: path to clinical translation in oncology. Neoplasia (U.S.) 2019;21:1–16. doi: 10.1016/j.neo.2018.09.006. - DOI - PMC - PubMed
    1. Sushentsev N, et al. Hyperpolarised 13C-MRI identifies the emergence of a glycolytic cell population within intermediate-risk human prostate cancer. Nat. Commun. 2022;13:1–12. - PMC - PubMed
    1. Nelson SJ, et al. Metabolic imaging of patients with prostate cancer using hyperpolarized [1-13C]pyruvate. Sci. Transl. Med. 2013;5:198ra108. doi: 10.1126/scitranslmed.3006070. - DOI - PMC - PubMed
    1. Granlund KL, et al. Hyperpolarized MRI of human prostate cancer reveals increased lactate with tumor grade driven by monocarboxylate transporter 1. Cell Metab. 2020;31:105–114.e3. doi: 10.1016/j.cmet.2019.08.024. - DOI - PMC - PubMed
    1. Chen HY, et al. Hyperpolarized 13C-pyruvate MRI detects real-time metabolic flux in prostate cancer metastases to bone and liver: a clinical feasibility study. Prostate Cancer Prostatic Dis. 2020;23:269–276. doi: 10.1038/s41391-019-0180-z. - DOI - PMC - PubMed