

Protozoan communities serve as a strong indicator of water quality in the Nile River
- PMID: 39014015
- PMCID: PMC11252277
- DOI: 10.1038/s41598-024-66583-z
Protozoan communities serve as a strong indicator of water quality in the Nile River
Abstract
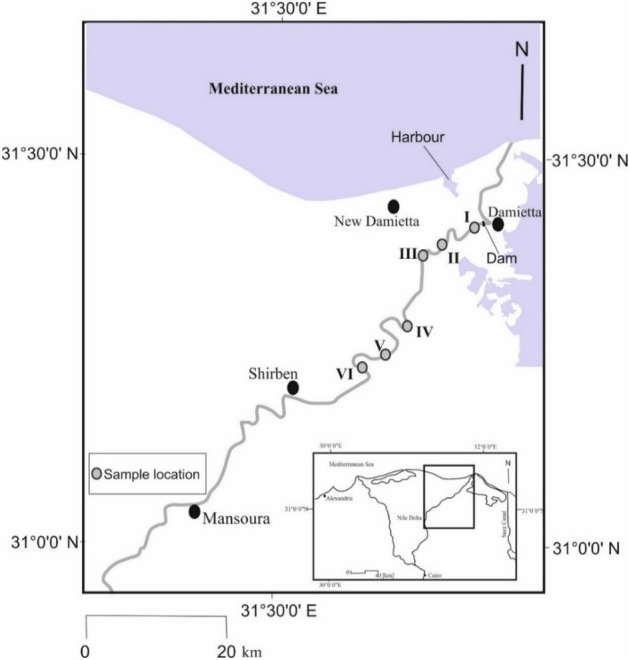
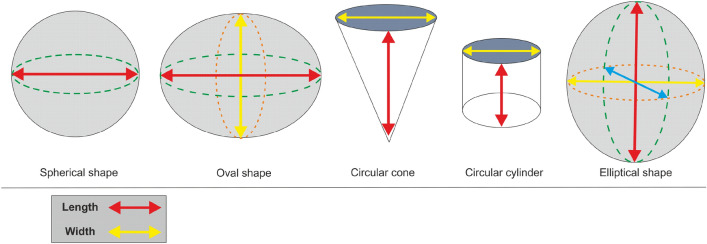
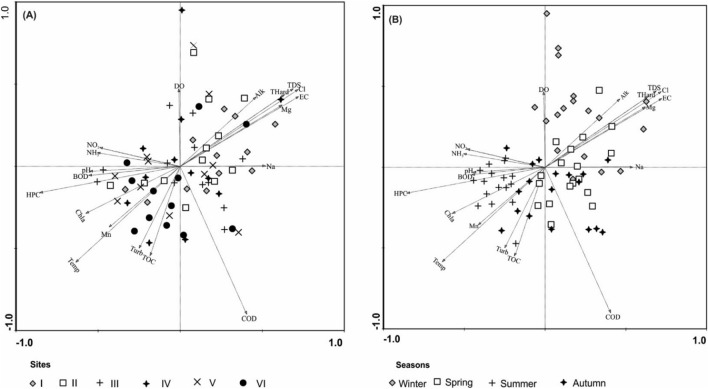
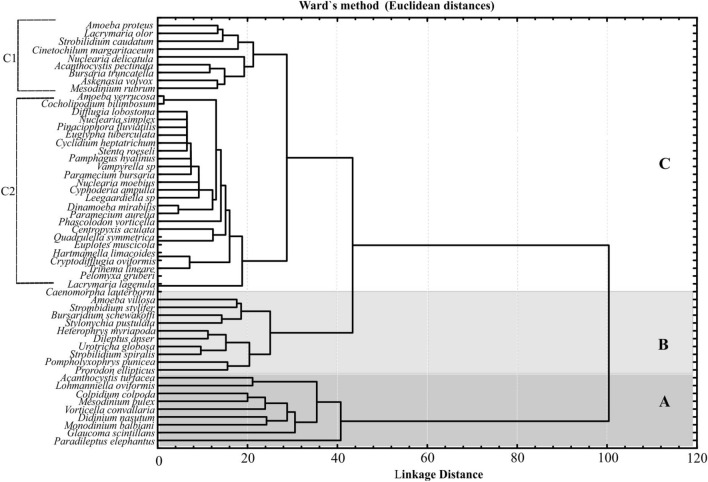
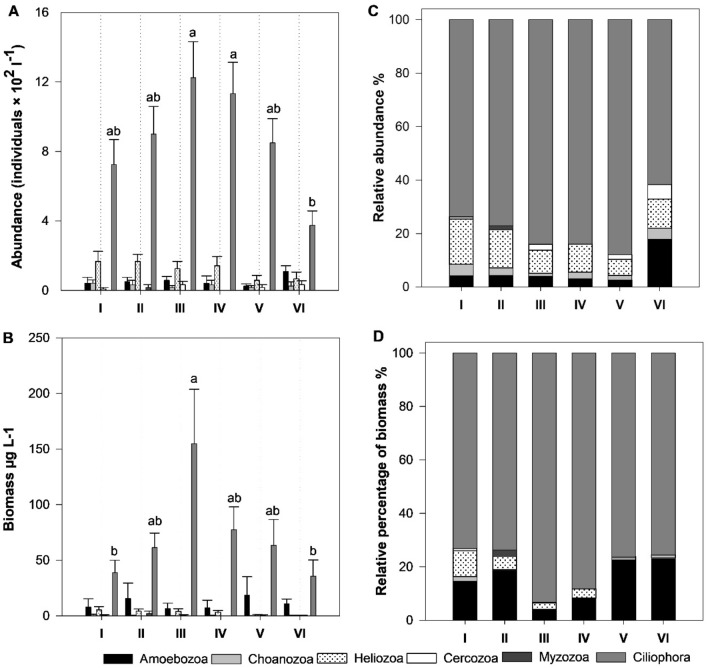
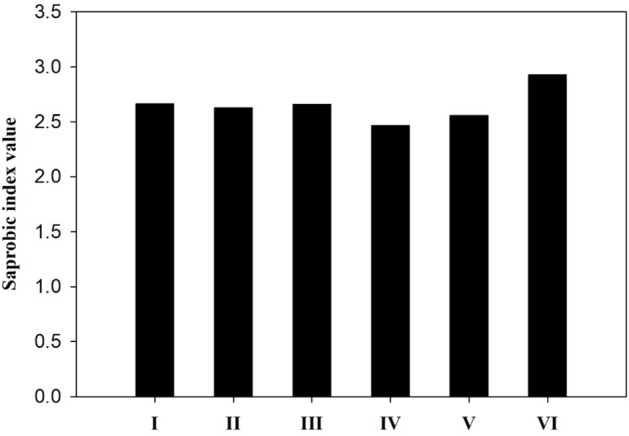
The relationship between the protozoan communities and environmental variables was studied in the Nile River to evaluate their potential as water quality indicators. Protozoans were sampled monthly at six sampling sites in the Nile's Damietta Branch across a spatial gradient of environmental conditions during a 1-year cycle (February 2016-January 2017). The Protozoa community was comprised of 54 species belonging to six main heterotrophic Protozoa phyla. The abundance (average, 1089 ± 576.18 individuals L-1) and biomass (average, 86.60 ± 106.13 μg L-1) were comparable between sites. Ciliates comprised the majority of protozoan species richness (30 species), abundance (79.72%), and biomass (82.90%). Cluster analysis resulted in the distribution of protozoan species into three groups, with the most dominant species being the omnivorous ciliate Paradileptus elephantinus. Aluminium, fluoride, and turbidity negatively affected abundance and biomass, while dissolved oxygen and potassium positively impacted biomass. Of the dominant species recorded over the study area, the amoebozoa Centropyxis aculeata was associated with runoff variables, while the bacterivorous ciliates Colpidium colpoda, Glaucoma scintillans, and Vorticella convallaria were related to the abundance of heterotrophic bacteria, phytoplankton biomass, and total organic carbon. Total dissolved salts, PO4, NH3, NO2, dissolved oxygen, and total organic carbon were the strongest causative factors for protozoa distribution. The α-Mesosaprobic environment at site VI confirmed a high load of agricultural runoffs compared to other sites. This study demonstrates that protozoans can be a potential bioindicator of water quality status in this subtropical freshwater river system.
Keywords: Bioindicator; Nile River Damietta branch; Protozoa; Water quality.
© 2024. The Author(s).
Conflict of interest statement
The authors declare no competing interests.
Figures


References
-
- Negm AM. The Nile River. 1. Springer; 2017.
-
- Hassan FA. A river runs through Egypt: Nile floods and civilization. Geotimes. 2005;50:22–25.
-
- Radwan TM, Blackburn GA, Whyatt JD, Atkinson PM. Dramatic loss of agricultural land due to urban expansion threatens food security in the Nile Delta, Egypt. Remote Sens. 2019;11:332. doi: 10.3390/rs11030332. - DOI
MeSH terms
LinkOut - more resources
Full Text Sources
