

Spatial heterogeneity in climate change effects across Brazilian biomes
- PMID: 39014072
- PMCID: PMC11252347
- DOI: 10.1038/s41598-024-67244-x
Spatial heterogeneity in climate change effects across Brazilian biomes
Abstract
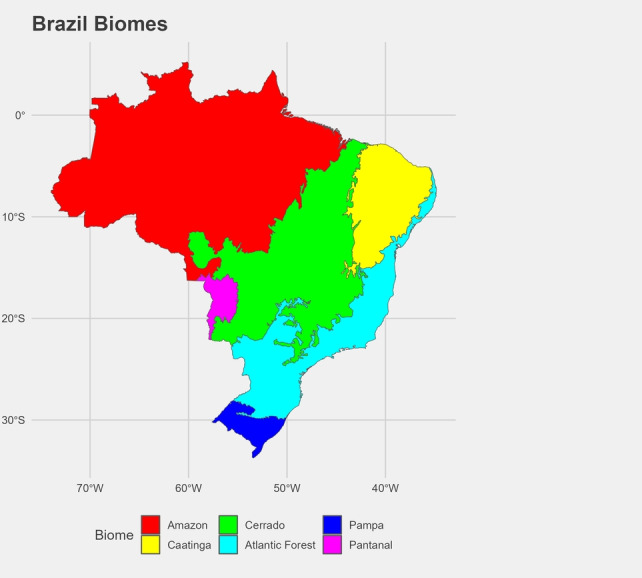
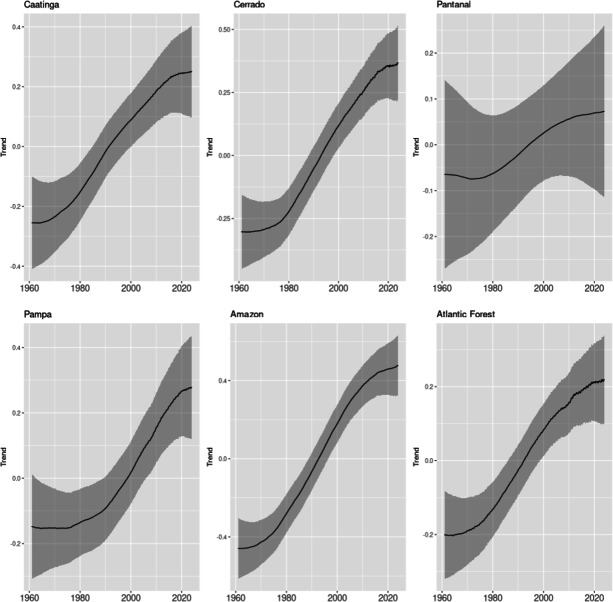
We present a methodology designed to study the spatial heterogeneity of climate change. Our approach involves decomposing the observed changes in temperature patterns into multiple trend, cycle, and seasonal components within a spatio-temporal model. We apply this method to test the hypothesis of a global long-term temperature trend against multiple trends in distinct biomes. Applying this methodology, we delve into the examination of heterogeneity of climate change in Brazil-a country characterized by a spectrum of climate zones. The findings challenge the notion of a global trend, revealing the presence of distinct trends in warming effects, and more accelerated trends for the Amazon and Cerrado biomes, indicating a composition between global warming and deforestation in determining changes in permanent temperature patterns.
Keywords: Climate change; Local climate change; Spatial heterogeneity; Spatio-temporal models; Structural time series.
© 2024. The Author(s).
Conflict of interest statement
The authors declare no competing interests.
Figures


References
-
- Ellery M, Scholes W, Mentis RJ. An initial approach to predicting the sensitivity of the South African grassland biome to climate change. S. Afr. J. Sci. 1991;87(10):499–503. doi: 10.10520/AJA00382353_7196. - DOI
-
- Salazar LF, Nobre CA, Oyama MD. Climate change consequences on the biome distribution in tropical South America. Geophys. Res. Lett. 2007 doi: 10.1029/2007GL029695. - DOI
-
- Salazar LF, Nobre CA. Climate change and thresholds of biome shifts in Amazonia. Geophys. Res. Lett. 2010 doi: 10.1029/2010GL043538. - DOI
-
- de Oliveira G, Araújo M B, Rangel T F, et al. Conserving the Brazilian semiarid (Caatinga) biome under climate change. Biodivers. Conserv. 2012;21(12):2913–2926. doi: 10.1007/s10531-012-0346-7. - DOI
MeSH terms
Grants and funding
LinkOut - more resources
Full Text Sources
Medical
