. 2024 Sep;21(9):1634-1645.
doi: 10.1038/s41592-024-02335-1. Epub 2024 Jul 16.

A systematic search for RNA structural switches across the human transcriptome

Affiliations

A systematic search for RNA structural switches across the human transcriptome

Matvei Khoroshkin et al. Nat Methods. 2024 Sep.

Abstract

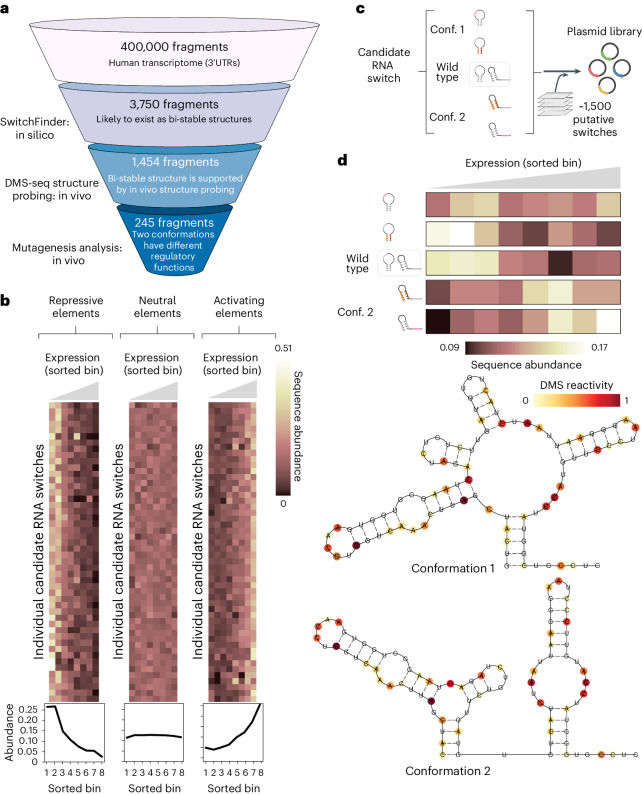
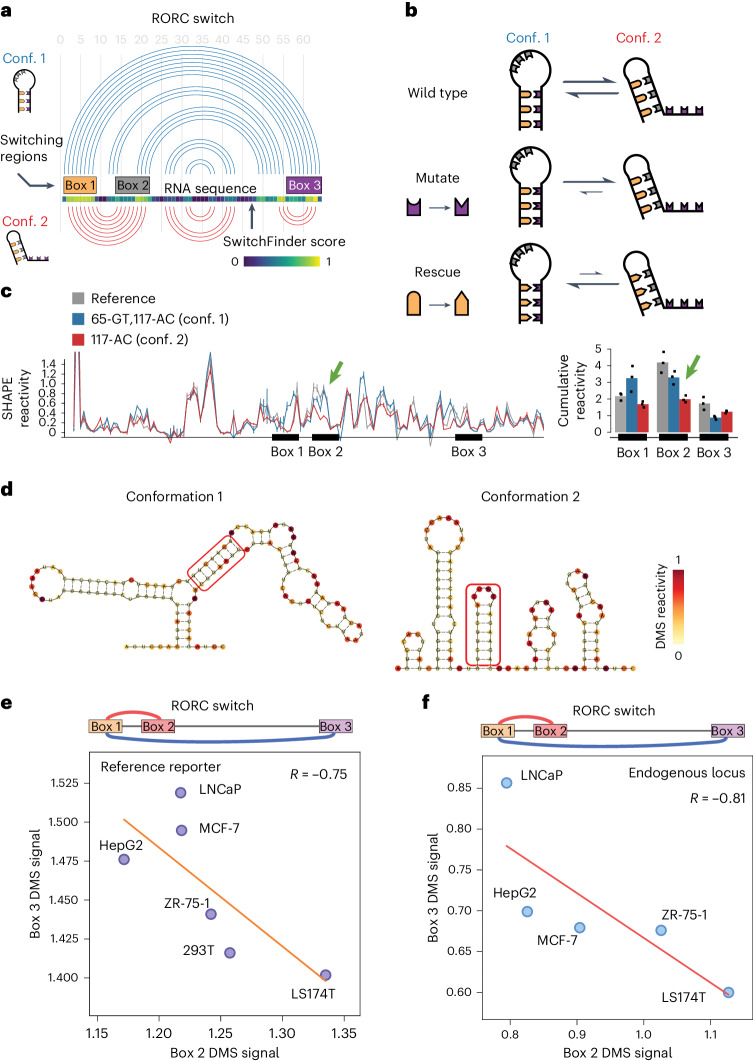
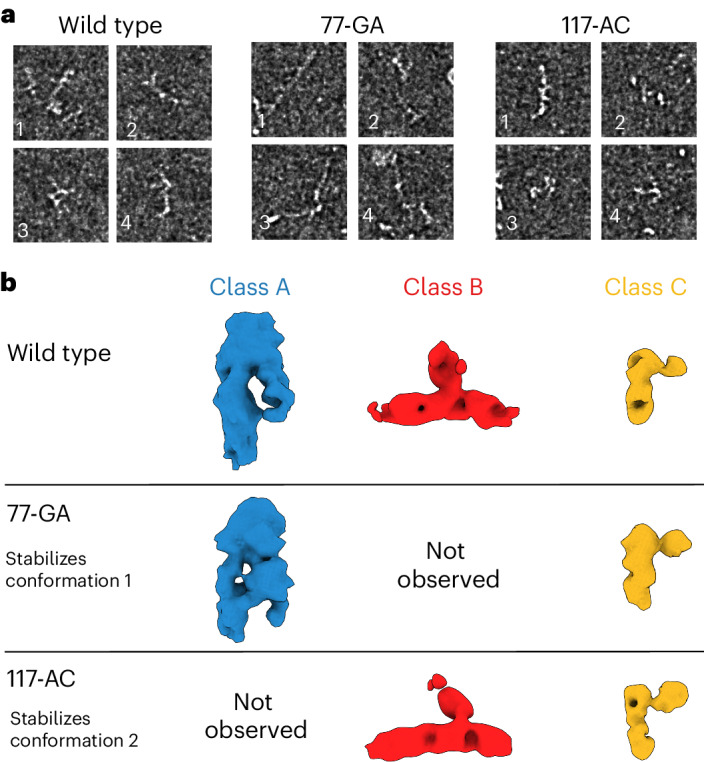
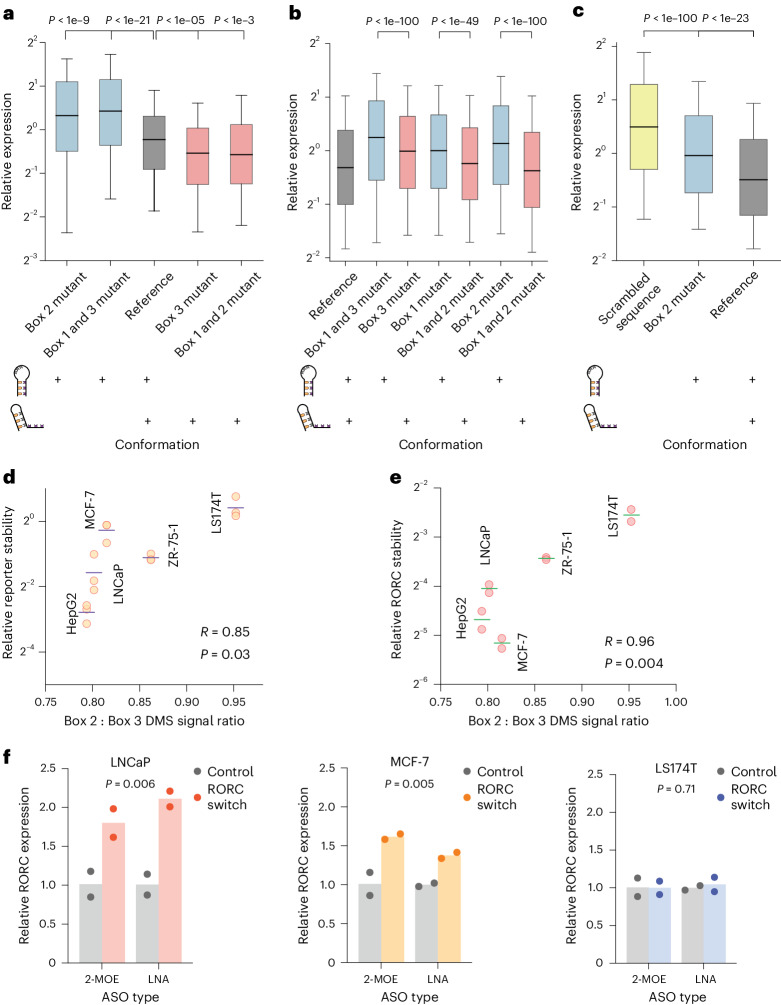
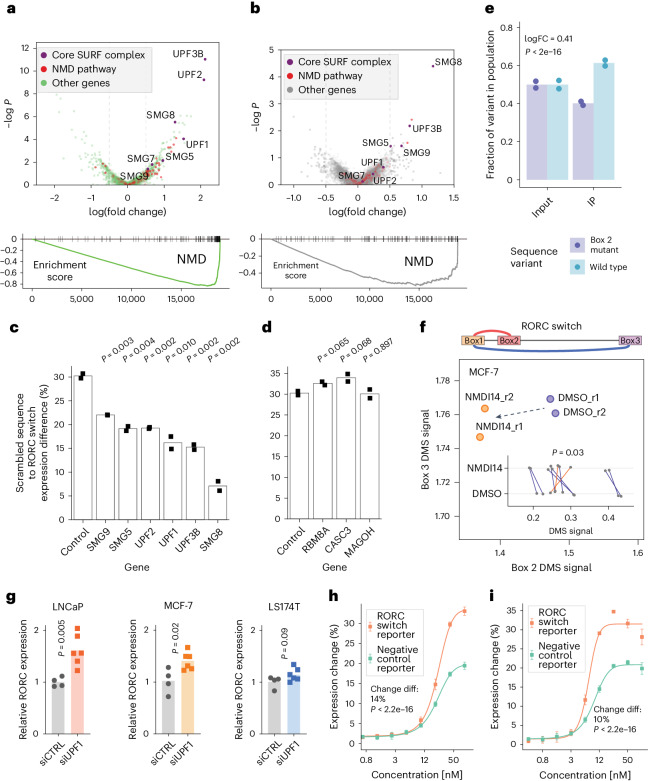
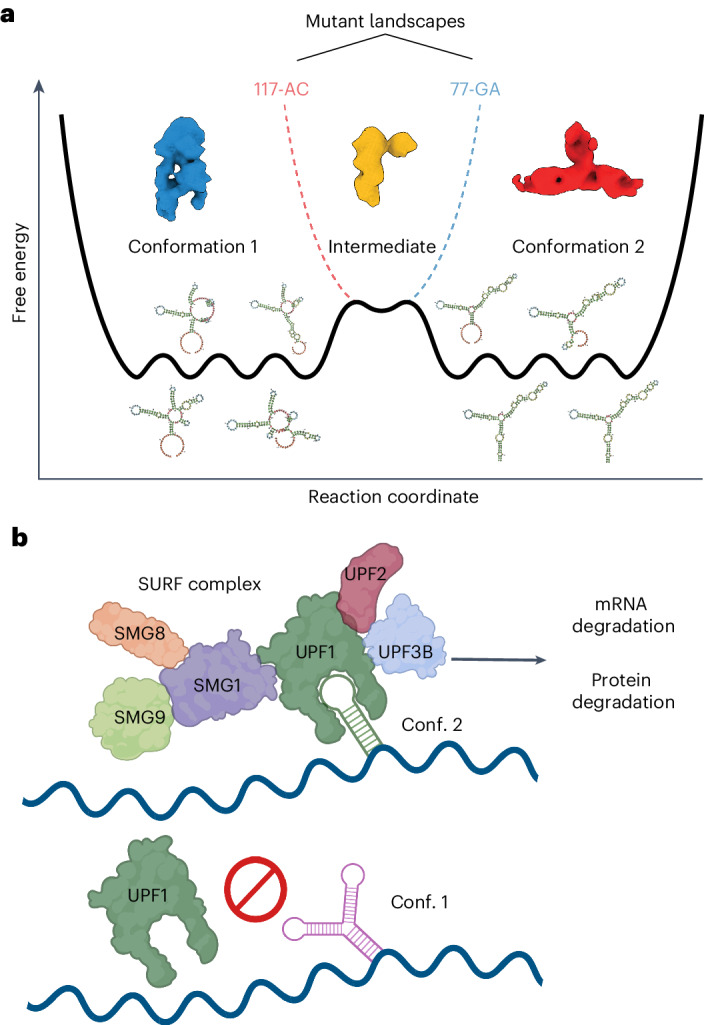
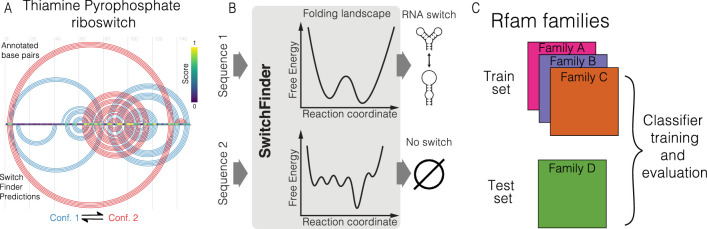
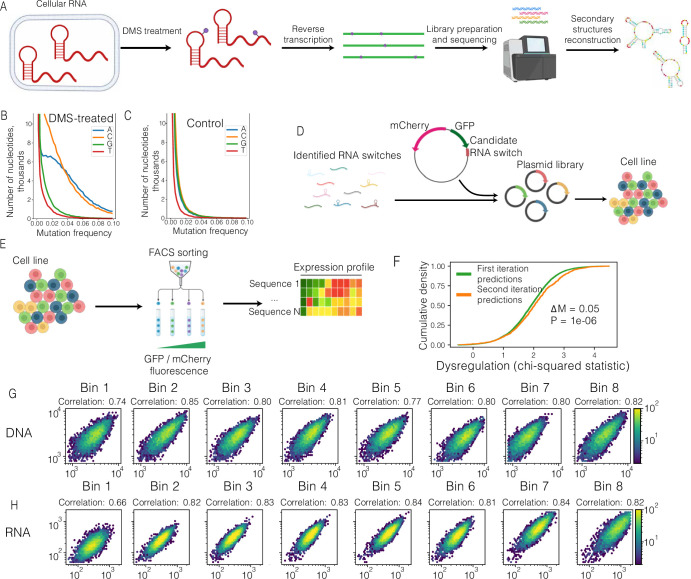
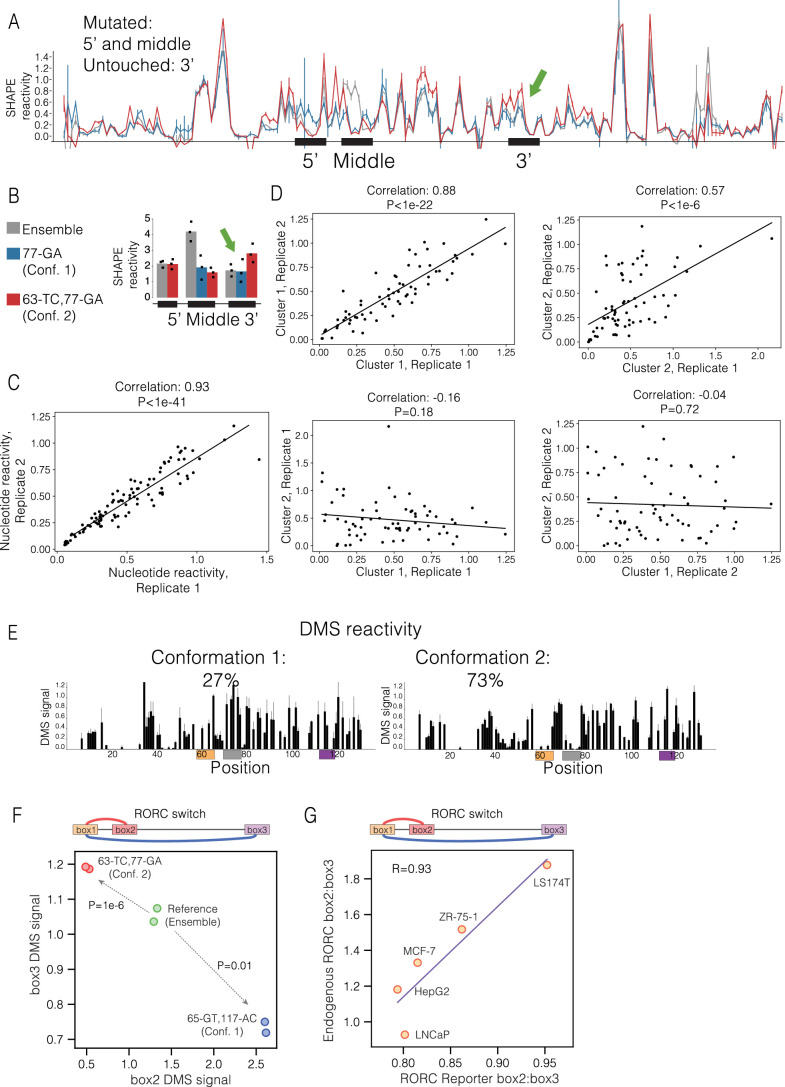
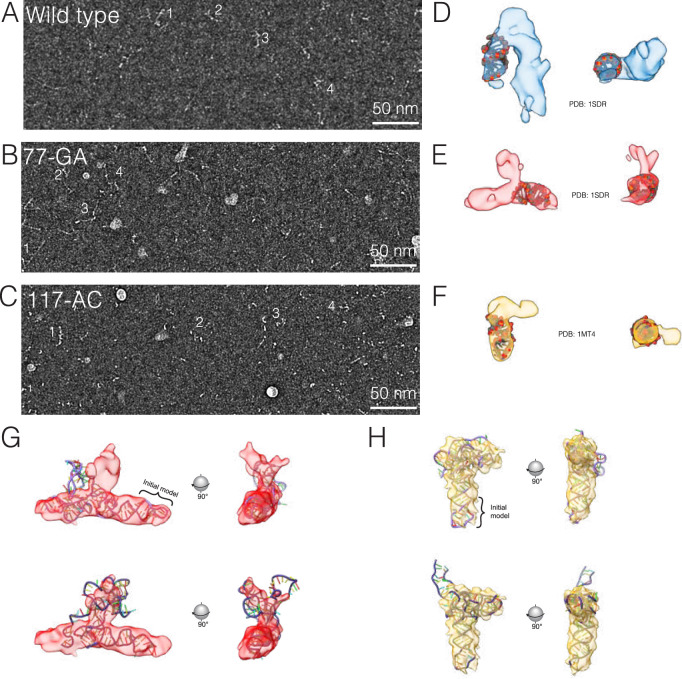
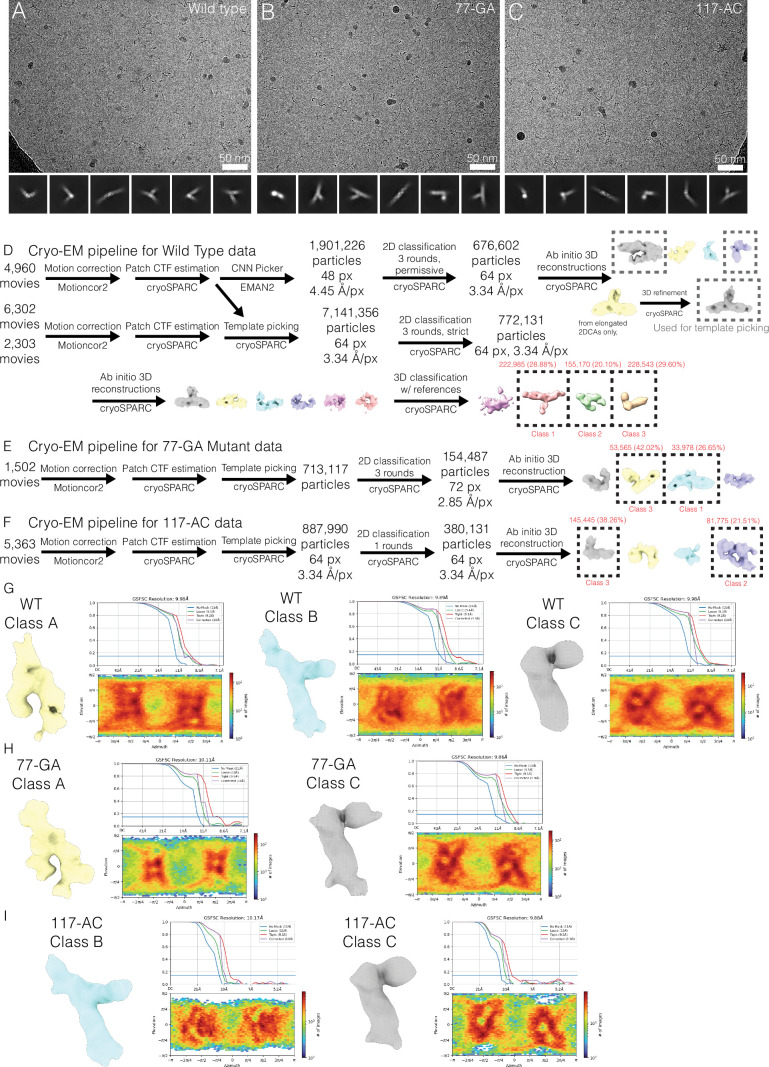
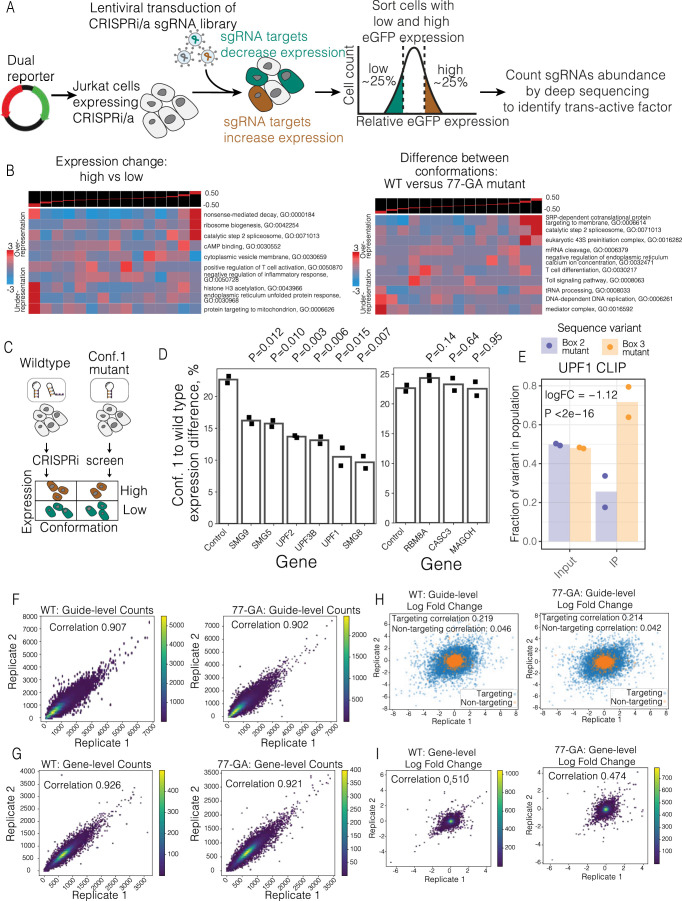
RNA structural switches are key regulators of gene expression in bacteria, but their characterization in Metazoa remains limited. Here, we present SwitchSeeker, a comprehensive computational and experimental approach for systematic identification of functional RNA structural switches. We applied SwitchSeeker to the human transcriptome and identified 245 putative RNA switches. To validate our approach, we characterized a previously unknown RNA switch in the 3' untranslated region of the RORC (RAR-related orphan receptor C) transcript. In vivo dimethyl sulfate (DMS) mutational profiling with sequencing (DMS-MaPseq), coupled with cryogenic electron microscopy, confirmed its existence as two alternative structural conformations. Furthermore, we used genome-scale CRISPR screens to identify trans factors that regulate gene expression through this RNA structural switch. We found that nonsense-mediated messenger RNA decay acts on this element in a conformation-specific manner. SwitchSeeker provides an unbiased, experimentally driven method for discovering RNA structural switches that shape the eukaryotic gene expression landscape.


Conflict of interest statement

M.K. and H.G. are inventors on a provisional patent related to this study. L.A.G. has filed patents on CRISPR functional genomics. The other authors have no competing interests.

Figures

Fig. 1
Fig. 1. SwitchFinder identifies candidate RNA switches in the human genome.
a, Example of SwitchFinder locating the RNA switch in the VEGFA mRNA sequence. b, Receiver operating characteristic (ROC) curves of SwitchFinder predictions of RNA switches from the common Rfam families. SwitchFinder was applied to a mix of real sequences and their shuffled counterparts (with preserved dinucleotide content). ROC curves measure its ability to correctly select the real sequences. AUC, area under the ROC curve; riboswitch families, c-di-GMP-I (Cyclic di-GMP); FMN, flavin mononucleotide; NiCo, nickel or cobalt ions; SAM, S-adenosyl-l-methionine; THF, tetrahydrofolate; TPP, thiamine pyrophosphate. c, AUCs of RNA switch predictions across the Rfam families for two models: SwitchFinder and SwiSpot. Each dot represents one Rfam family. The lines show the change in accuracy between the two models. The families that have higher AUCs for SwitchFinder are shown with blue lines; the ones that have higher AUCs for SwiSpot are shown in red. P value calculated with the paired two-sided t-test (P = 0.00056). d, AUCs of RNA switch predictions across various groups of natural and synthetic riboswitches, calculated as in b.
Fig. 2
Fig. 2. MPRA captures the functional difference between the conformations of candidate RNA switches.
a, Overview of SwitchSeeker, the platform for RNA switch identification, applied to the 3ʹUTRs of the human transcriptome. b, Examples of regulatory elements identified by the functional screen. Each row represents a single candidate RNA switch, each column represents a single bin defined by the reporter gene expression (eGFP fluorescence, normalized by mCherry fluorescence). Bin 1 corresponds to the cells with the lowest eGFP fluorescence, bin 8 corresponds to the highest. The value in each cell is the relative abundance of the given RNA switch in the given bin, normalized across the eight bins. The three plots show examples of candidate switches with repressive, neutral and activating effects on gene expression. The plots below show cumulative sequence abundances across all of the candidate switches in each group. c, The set-up of the massively parallel mutagenesis analysis. For each candidate RNA switch, we design four mutated sequence variants. Two of them lock the switch into conformation 1, and the other two lock it into conformation 2. A sequence library is then generated (Extended Data Fig. 2d), in which each candidate RNA switch is represented by the four mutated sequence variants, along with the reference sequence. d, Example of a high-confidence candidate RNA switch identified using the massively parallel mutagenesis analysis. Bottom: Two alternative conformations as predicted by SwitchSeeker. The RNA secondary structure probing data collected with the Structure Screen is shown in color. The Gibbs free energy difference between the two predicted conformations is 2.4 kcal per mol. Top: The effect of the candidate RNA switch locked in one or another conformation on reporter gene expression. Each row corresponds to a single sequence variation that locks the RNA switch into one of the two conformations. Each column represents a single bin defined by the reporter gene expression. The value in each cell is the relative abundance of the given RNA switch in the given bin, normalized across the eight bins.
Fig. 3
Fig. 3. A fragment of RORC 3ʹUTR forms an ensemble of two alternative structures.
a, Arc representation of the two alternative conformations of the RORC RNA switch as predicted by SwitchSeeker. The two conformations are shown in blue and red, respectively. Left: The schematic representations of the two conformations, as used throughout the article. b, The set-up of mutation–rescue experiments. The switching regions are color coded as in a. A-U and C-G base pairing is shown with compatible shapes (triangle and half-circle). The two conformations of the switch reside in the equilibrium state. Mutation of the Box 3 region disrupts the base pairing between the Box 1 and the Box 3 regions. This causes a shift of the equilibrium towards conformation 2. Rescue mutation of the Box 1 switching region restores the base pairing between Box 1 and Box 3, but at the same time it disrupts the base pairing between Box 1 and Box 2. Therefore, the equilibrium shifts towards conformation 1. c, In vitro SHAPE reactivity of the RORC RNA switch sequence in vitro. Left: SHAPE reactivity profiles for the reference sequence (in gray) and for the mutation–rescue pair of sequences (blue, 65-GT,117-AC; red, 117-AC). Shown is the average for three replicates with the respective error bars (s.d.). The SHAPE reactivity changes in the nonmutated regions are highlighted with bold arrows. Right: Barplots of cumulative SHAPE reactivity in the switching regions. d, Secondary structures of the two conformations of RORC RNA switch predicted by the RNAstructure algorithm guided by the DMS reactivity data. The base pairing of Box 1 with either Box 3 (conformation 1) or Box 2 (conformation 2) is highlighted by a red frame. The two clusters were identified using the DRACO unsupervised deconvolution algorithm. e, Accessibility of the Box 2 (x axis) and Box 3 (y axis) regions of the RORC element across cell lines, as measured with DMS-MaPseq (normalized reactivity, see Methods). The cell lines were engineered to express a GFP reporter containing the RORC switch sequence in the 3ʹUTR, and the accessibility of the reporter mRNA was measured with DMS-MaPseq. Linear regression is shown with an orange line. f, Accessibility of the Box 2 (x axis) and Box 3 (y axis) regions of the RORC element in the endogenous RORC mRNA, as measured with DMS-MaPseq (normalized reactivity, see Methods).
Fig. 4
Fig. 4. Cryo-EM of RORC 3ʹ mRNA is consistent with dynamic exchange in a shallow energy landscape.
a, Cryo-EM of wild-type RORC mRNA, 77-GA mutant and 117-AC mutant, as representative examples of qualitatively different compact and extended RNA-like particles. Different morphologies are indicated by numbered labels. Source micrographs were phase-flipped, Gaussian filtered and contrast inverted for display (see Extended Data Fig. 5). Scale bars, 50 nm. b, Three structural classes of the refolded RORC 3ʹ mRNA element as determined on cryo-EM processing, with RNA-like features (top). Further cryo-EM imaging and 3D classification of the 77-GA mutant (middle) and 117-AC mutant (bottom) indicate that Class A is present in wild-type and 77-GA samples but absent from the 117-AC sample, and Class B is conversely present in wild-type and 117-AC samples but absent from the 77-GA mutant. Class C is common to all three samples. We thus assign Class A as the conformation 1 state, and Class B as the conformation 2 state. We propose Class 3 to represent a partly folded intermediate that is not disrupted in the mutated constructs.
Fig. 5
Fig. 5. The two alternative conformations of the RORC RNA switch have opposing effects on target gene expression.
ac, Box plots of the relative expression of the reporter construct across different RNA conformations and sequences in HEK293 cells (a), reciprocal mutations (b) and primary Th17 cells (c). Relative expression is quantified as the ratio of eGFP to mCherry fluorescence for individual cells, as measured by flow cytometry (n = 10,000 cells). The boxes shows the quartiles of the dataset, with the central line indicating the median value; the whiskers extend from the 10th to the 90th percentile. The colors denote specific RNA conformations or sequences: conformation 1 in blue, conformation 2 in red, reference sequence in gray, and a scrambled sequence in yellow. The diagrams below the box plots show the balance of the two conformations in the RNA populations, with existing conformations marked by a ‘+’ sign. Statistical significance was determined with a two-sided independent t-test. a, The mutations left to right: 73-CCCTATGA; 61-TATATAA,116-TTATATA; reference; 116-CCCTAAG; 62-GCACAGT,73-ACTGTGC. P values left to right: 1.1e−10, 2.6e−22, 1.6e−06, 0.00025. b, Effect of the shift in equilibrium between two conformations of the RORC switch on reporter gene expression for reciprocal mutations. The mutation–rescue experiments were performed as shown in Fig. 3b. The mutations left to right: reference; 65-GT,117-AC; 117-AC; 66-AC; 66-AC,74-GT; 77-GA; 63-TC,77-GA. P values left to right: 7.1e−117, 3.6e−50, 5.9e−260. c, Effect of shift in the equilibrium between two conformations of the RORC switch on reporter gene expression in primary Th17 T cells. Human CD4+ T cells were infected with lentiviral constructs carrying one of the three sequences in the reporter gene’s 3ʹUTR, and subsequently differentiated into Th17 cells. The mutations left to right: scrambled RORC RNA switch; 77-GA; reference. P values left to right: 1.7e−124, 2.6e−24. d,e, Scatterplots of the relationship between the relative conformation ratio of the RORC element, as measured with DMS-MaPseq in reporter-expressing cell lines, and stability of the reporter mRNA (n = 3 replicates) (d) and the endogenous RORC mRNA (n = 2 replicates) (e), as measured by RT-qPCR following the α-amanitin treatment. The reporter contains the eGFP ORF, followed by the 3ʹUTR containing the RORC RNA switch sequence. Horizontal lines represent the mean of mRNA stability. Correlation of mean stability and the relative conformational ratio was measured using the Pearson correlation coefficient. f, Effect of ASOs on endogenous RORC mRNA expression, as measured by RT-qPCR. The targeting ASOs are complementary to Box 2 of the RNA switch; the control ASOs have the same nucleotide composition as the targeting ones but do not target the RORC RNA switch sequence. P values were determined using the two-sided independent t-test, comparing the RORC-targeting and control ASOs, independent of the ASO chemistry. n = 2 replicates. LNA, locked nucleic acids.
Fig. 6
Fig. 6. Genome-wide CRISPRi screen identifies SURF complex as acting downstream of the RORC RNA switch.
a, Top: Expression change: high versus low: comparison of sgRNA representation between the bottom and the top quantiles of reporter gene expression (across both reference and 77-GA mutant cell lines), represented as a volcano plot. Genes, annotated as part of the NMD pathway by gene ontology (GO), are colored in red. The core components of the canonical NMD pathway are colored in purple and labeled. All other genes are colored in green. Bottom: Gene set enrichment analysis (GSEA) plot for the NMD pathway for the above comparison. −logP: negative logarithm of P value. b, Differences between conformations: wild type versus the 77-GA mutant. Comparison of ratios between top and bottom expression quantiles for the two cell lines. Higher values on the x axis indicate that sgRNAs targeting this gene have a stronger effect on reporter gene expression in the reference cell line compared with the 77-GA mutant cell line. Top: ‘ratio of ratios’ comparison represented as a volcano plot. Genes are colored as in a. Bottom: GSEA plot for the NMD pathway for the above comparison. −logP: negative logarithm of P value. c,d, The effect of knockdown of SURF (c) and EJC (d) member proteins on the RORC RNA switch reporter gene expression, relative to a scrambled sequence. The individual genes were knocked down using the CRISPRi system in both the reference and the scrambled cell lines, then the change of reporter gene expression was measured using flow cytometry (n = 2 replicates). The bar plots show the ratio of the expression of the scrambled sequence to that of the wild-type sequence of the RORC RNA switch. P values were calculated using the two-sided Student’s t-test. e, Bar plots of the fractions of reads carrying the wild-type RORC switch sequence or B77-GA mutant variant in the UPF1 cross-linking and immunoprecipitation (CLIP) library. Left: input RNA libraries, extracted from the wild-type and 77-GA mutant-expressing Jurkat cells, mixed at a 1:1 ratio. Right: libraries after anti-UPF1 immunoprecipitation (IP). The fractions are normalized by the variant fractions in the input libraries. The P value was calculated using the translation efficiency ratio test. FC, fold change. n = 2 replicates. f, The effect of NMDI14 on the accessibility of the Box 2 and the Box 3 regions of the RORC element, as measured by DMS-MaPseq. Changes in individual nucleotide accessibility are shown on the inner plot. Statistical significance was determined using a two-sided independent t-test. g, The effect of UPF1 knockdown on endogenous RORC mRNA expression, as measured by RT-qPCR (control, n = 4 replicates; UPF1 knockdown, n = 6 replicates). siCTRL, non-targeting dicer-substrate small interfering RNA; siUPF1, UPF1-targeting dicer-substrate small interfering RNA. P values were calculated using the two-sided Student’s t-test. h,i, Effect of the proteasome inhibitors carfilzomib (h) and bortezomib (i) on the RNA switch-mediated expression change (n = 4 replicates). Data are given as the mean ± s.d. Statistical significance was determined using dose–response modeling followed by ANOVA, to compare the fitted models to assess differences in the effect of the inhibitors on the RNA switch-mediated expression.
Fig. 7
Fig. 7. The proposed mechanism of RORC RNA switch functioning.
a, Schematic diagram of a shallow energy landscape for the RORC 3ʹ mRNA element. Shallow global minima characterizing the conformation 1 (cryo-EM Class A) and conformation 2 (cryo-EM Class B) structures themselves comprise multiple local minima in which various secondary structure elements fold or unfold while preserving overall tertiary structure and biological activity. These local minima are illustrated by secondary structure models for various DRACO cluster members. The two global minima are separated by a kinetic barrier that represents a partially folded intermediate (cryo-EM Class 3). The two dashed lines indicate alterations to the global landscape exhibited by the mutant sequences, blue for the 77-GA mutant and red for the 117-AC mutant. These altered landscapes eliminate one of the global minima without disrupting the intermediate. b, Proposed mechanism of the RORC RNA switch. The RNA switch exists in an ensemble of two states. One of them is recognized by the SURF complex; such recognition triggers mRNA degradation (likely to be mediated by SMG5) and protein degradation (mediated by the proteasome), thus affecting gene expression.
Extended Data Fig. 1
Extended Data Fig. 1. SwitchFinder identifies saddles in RNA folding energy landscape.
a Example of SwitchFinder locating the thiamine pyrophosphate RNA switches within the mRNA sequence. Top: arc representation of the RNA base pairs that change between the two conformations of the E.coli TPP RNA switch, as in (Barsacchi et al. ). The two conformations are shown in red and blue, respectively. Bottom: the two conformations of the RNA switch as predicted by SwitchFinder. Middle: SwitchFinder score reflecting the likelihood of a given nucleotide to be involved in two mutually exclusive base pairings. b Scheme of SwitchFinder model. SwitchFinder analyzes RNA folding energy landscape of a given RNA sequence and assigns higher score to the landscapes that demonstrate riboswitch-like features. c The set-up for evaluating the ability of a model to find RNA switches from novel families. At the classifier training step, riboswitches from one of the Rfam families get separated into the ‘test set’, while the model gets trained on the riboswitches from other Rfam families. The test set then is used to evaluate the model performance.
Extended Data Fig. 2
Extended Data Fig. 2. Overview of high-throughput screening approaches for improved RNA switch predictions.
a Overview of DMS-MaPseq workflow. Mammalian cells are treated with DMS. DMS-modified nucleotides cause mutations when cDNA is synthesized from RNA templates. The cDNA libraries are sequenced, the DMS-caused mutations are counted, providing the Watson-Crick face accessibility estimates for each A- or C- nucleotide. b Cumulative mutation frequency in DMS-treated candidate RNA switches, separated by nucleotide. c Cumulative mutation frequency in nontreated candidate RNA switches, separated by nucleotide. d Overview of the library generation workflow for Massively Parallel Reporter Assay (MPRA). Sequences of candidate RNA switches are synthesized as DNA oligonucleotides and cloned into a reporter vector into 3ʹUTR region of a eGFP cDNA. The plasmid library is packaged into lentiviral particles, and used for infecting mammalian cells. The infection is performed at low MOI (infection rate) to ensure that most cells get only a single plasmid copy. e Overview of the MPRA workflow. A population of mammalian cells is separated into bins based on GFP/mCherry fluorescence ratio. In the schematic, cells are colored according to the sequence they carry in the 3ʹUTR of the GFP reporter. f Cumulative density plot of dysregulation values, comparing the candidate RNA switches predicted in first and second (DMS-MaPseq informed) iterations of SwitchFinder. Dysregulation values are estimated using chi-square test for every individual candidate RNA switch across 8 expression bins. Median difference (∆M) and P value (calculated using Mann-Whitney U-test) are shown. g Correlations of read counts of gDNA libraries between the biological replicates of massively parallel mutagenesis analysis. h Correlations of read counts of RNA libraries between the biological replicates of massively parallel mutagenesis analysis.
Extended Data Fig. 3
Extended Data Fig. 3. In vitro SHAPE reactivity of the RORC RNA switch sequence in vitro.
a SHAPE reactivity profiles for the reference sequence and for the mutation–rescue pair of sequences (blue - ‘77-GA’, red - ‘63-TC,77-GA’). Shown is the average for 3 replicates with the respective error bars (SD). The SHAPE reactivity changes in the nonmutated regions are highlighted in bold arrows. b Barplots of cumulative SHAPE reactivity within the switching regions for the reference sequence (in gray) and for the mutation–rescue pair of sequences (blue - ‘77-GA’, red - ‘63-TC,77-GA). N replicates = 3. c Scatter plot showing the reproducibility of the DMS signal between two replicates. Each dot represents a single nucleotide. Normalized DMS signal is shown on both axes. Correlation and P value is determined with Pearson correlation coefficient (P = 1.59-42). d Scatter plots showing the reproducibility of the DRACO clusters between replicates (N = 2). Each replicate’s reads were clustered with DRACO, the DMS reactivity was calculated for each cluster; the clusters were subsequently matched between replicates. Shown are DMS reactivities for a given cluster in a given replicate; each dot represents a single nucleotide. Correlation and P value is determined with Pearson correlation coefficient. P values left to right: 2.60e-23,3.62e-07,0.18,0.73. e DMS reactivities of the two clusters identified by the DRACO unsupervised deconvolution algorithm (Morandi et al. ). The algorithm was run on two replicates independently, and identified the same clusters in both of them. The ratios of the clusters reported by DRACO are 22% to 78% in replicate 1 and 32% to 68% in replicate 2. The ratio shown is an average between the two replicates. The switching regions are shown in color. f The effect of sequence mutations in the ‘Box 2’ and ‘Box 3’ regions of RORC element on their reactivity, as measured by DMS-MaPseq in a reporter cell line. P values were determined using the two-sided independent T-test. g Correlation of relative proportions of the two conformations between the reporter context and the endogenous RORC mRNA. Linear regression is shown with a line. The relative conformations’ proportion is defined as the ratio of reactivities of Box 2:Box 3.
Extended Data Fig. 4
Extended Data Fig. 4. Qualitative modeling of cryo-EM data.
(a–c) Source cryo-EM images for the example particles shown in Fig. 4a, with phase-flipping to correct contrast and CTF delocalization. The WT image (A) evinces a greater diversity of particles, while 77-GA (B) appears to contain primarily elongated particles and those of 117-AC (C) seem more compact. The data collection statistic is available in Data file S7. (d-f) Cryo-EM 3D classes A, B, and C of the WT RORC RNA overlaid with stereotypical RNA tertiary structures from the PDB including dsRNA B-helix and RNA hairpin. Features representing the major groove and a hairpin are visible in regions of the maps. (g, h) Pairs of high-scoring models created by DRRAFTER for WT 3D classes B and C with density overlaid. The pre-positioned, idealized RNA structures used as initial models are indicated by a bracket. Although the individual models are of low-confidence, they demonstrate that the class densities likely represent all or the majority of the RNA molecule.
Extended Data Fig. 5
Extended Data Fig. 5. Cryo-EM image processing and validation.
(a-c) Representative micrographs and 2D class averages for RORC RNA switch WT sequence (A), 77-GA (B) and 117-AC (C). The data collection statistic is available in Data file S7. (d) Schematic cryo-EM image processing pipelines for WT RORC RNA. During template picking, templates and micrographs were low-pass filtered to 20 Å. (e, f) Schematic cryo-EM image processing pipelines for 77-GA (E), and 117-AC (F) mutants. During template picking, templates and micrographs were low-pass filtered to 20 Å. (g) Gold-standard half-map refinement volume, FSC curves, and orientation distribution plot for 3D classes from WT RNA sample. (h) Gold-standard half-map refinement volume, FSC curves, and orientation distribution plot for 3D classes from 77-GA sample. (i) Gold-standard half-map refinement volume, FSC curves, and orientation distribution plot for 3D classes from 117-AC sample.
Extended Data Fig. 6
Extended Data Fig. 6. Differentiation of Th17 cells from primary human CD4+ cells.
Representative fluorescence-activated cell sorting plots of human primary Th17 cells, infected with RORC RNA switch 3ʹUTR reporter. On the day 5 of differentiation, each sample was split in half; one half was analyzed for mCherry and GFP expression (shown in Fig. 5c), the other half was stained for the expression of CD4, FoxP3, IL-13, IL-17A, IFN-gamma. The cells expressing a given marker are highlighted with a frame and a fraction of the parental cellular population is given. Each sample was analyzed in 4 replicates; a single representative replicate is displayed. CD4 is a marker for T-helper cells, including Th17. FoxP3 is typically associated with regulatory T cells, contrasting the pro-inflammatory role of Th17 cells. IL-13 and IL-17A are cytokines indicative of Th2 and Th17 cell activity, respectively, with IL-17A being a key marker for Th17 cell identity. IFN-gamma is a signature cytokine of Th1 cells.
Extended Data Fig. 7
Extended Data Fig. 7. CRISPRi screen highlights the pathways acting downstream of the RORC RNA switch.
a Overview of the flow cytometry-based CRISPRi screen workflow. b Gene set enrichment analysis of the data depicted in Fig. 6a (left) and Fig. 6b (right). The genes were distributed into equally populated bins based on their comparative abundance between high expression and low expression quartiles (left), or based on their comparative phenotype in the CRISPRi screens performed in WT or 77-GA mutant backgrounds (right). Then the enrichment of a given gene set was calculated in each bin using iPAGE, a mutual information-based algorithm (Goodarzi et al. 2009). c Experiment design table. d The effect of knockdown of SURF and EJC complex member proteins on the expression change upon the conformation equilibrium shift. The individual genes were knocked down using the CRISPRi system in both WT and 77-GA mutant cell lines, then the change of reporter gene expression was measured by flow cytometry (N replicates = 2). The bar plots demonstrate the expression ratios of WT to 77-GA mutation cell lines. e The bar plots demonstrate the fractions of reads carrying the Box 2 (77-GA) mutant sequence or Box 3 (116-CCCTAAG) mutant sequence in UPF1 cross-linking and immunoprecipitation (CLIP) library. Box 2 mutant favors conformation 1, Box 3 mutant favors conformation 2. Left: input RNA libraries, extracted from the Box 3 and Box 2 mutant-expressing Jurkat cells, mixed at 1:1 ratio. Right: libraries after anti-UPF1 immunoprecipitation. P value was calculated using Translation Efficiency Ratio test as in (Navickas et al. ). N replicates = 2. f Density plots showing the correlation of sgRNA counts between the replicates of the CRISPRi screens performed in the WT (left) and 77-GA mutant (right) backgrounds. g Density plots showing the correlation of gene counts between the replicates of the CRISPRi screens performed in the WT (left) and 77-GA mutant (right) backgrounds. The counts of all the sgRNAs targeting a given gene are pooled and reported as a single number (N = 5 sgRNAs per gene). h Scatter plots showing the correlation of sgRNA phenotypes between the replicates of the CRISPRi screens performed in the WT (left) and 77-GA mutant (right) backgrounds. Logarithmic fold changes between the sgRNA abundance ‘high’ and ‘low’ expression bins are shown on both axes. Nontargeting sgRNAs are shown in orange; all the other sgRNAs are shown in blue. The correlation values are reported separately for nontargeting and targeting sgRNAs. i Density plots showing the correlation of gene phenotypes between the replicates of the CRISPRi screens performed in the WT (left) and 77-GA mutant (right) backgrounds. Logarithmic fold changes between the abundance of sgRNAs targeting a given gene in ‘high’ and ‘low’ expression bins are shown on both axes.

References

    1. Gilbert, W. Origin of life: the RNA world.Nature319, 618 (1986). 10.1038/319618a0 - DOI
    1. Saad, N. Y. A ribonucleopeptide world at the origin of life. J. Syst. Evol.56, 1–13 (2018). 10.1111/jse.12287 - DOI
    1. Vitreschak, A. G., Rodionov, D. A., Mironov, A. A. & Gelfand, M. S. Riboswitches: the oldest mechanism for the regulation of gene expression? Trends Genet.20, 44–50 (2004). 10.1016/j.tig.2003.11.008 - DOI - PubMed
    1. Sun, E. I. et al. Comparative genomics of metabolic capacities of regulons controlled by cis-regulatory RNA motifs in bacteria. BMC Genomics14, 597 (2013). 10.1186/1471-2164-14-597 - DOI - PMC - PubMed
    1. Serganov, A. & Nudler, E. A decade of riboswitches. Cell152, 17–24 (2013). 10.1016/j.cell.2012.12.024 - DOI - PMC - PubMed