. 2024 Jul 16;8(1):145.
doi: 10.1038/s41698-024-00637-3.

Cellular heterogeneity and key subsets of tissue-resident memory T cells in cervical cancer

Affiliations

Cellular heterogeneity and key subsets of tissue-resident memory T cells in cervical cancer

Fuhao Wang et al. NPJ Precis Oncol. .

Abstract

Tissue-resident memory T cells (TRMs) play a critical role in cancer immunity by offering quick and effective immune responses. However, the cellular heterogeneity of TRMs and their significance in cervical cancer (CC) remain unknown. In this study, we generated and analyzed single-cell RNA sequencing data from 12,945 TRMs (ITGAE+ CD3D+) and 25,627 non-TRMs (ITGAE- CD3D+), derived from 11 CC tissues and 5 normal cervical tissues. We found that TRMs were more immunoreactive than non-TRMs, and TRMs in CC tissues were more activated than those in normal cervical tissues. Six CD8+ TRM subclusters and one CD4+ TRM subcluster were identified. Among them, CXCL13+ CD8+ TRMs were more abundant in CC tissues than in normal cervical tissues, had both cytotoxic and inhibitory features, and were enriched in pathways related to defense responses to the virus. Meanwhile, PLAC8+ CD8+ TRMs were less abundant in CC tissues than in normal cervical tissues but had highly cytotoxic features. The signature gene set scores of both cell subclusters were positively correlated with the overall survival and progression-free survival of patients with CC following radiotherapy. Of note, the association between HLA-E and NKG2A, either alone or in a complex with CD94, was enriched in CXCL13+ CD8+ TRMs interacting with epithelial cells at CC tissues. The in-depth characterization of TRMs heterogeneity in the microenvironment of CC could have important implications for advancing treatment and improving the prognosis of patients with CC.


Conflict of interest statement

The authors declare no competing interests.

Figures
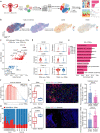
Fig. 1
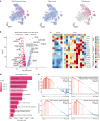
Fig. 1. TRMs are more immunoreactive than non-TRMs.
a Overview of the experimental workflow. b t-Distributed Stochastic Neighbor Embedding (tSNE) plots showing subcluster, sample origin, and marker gene expression. The color key shows the gradient of normalized expression. c Volcano plot displaying differentially expressed genes (DEGs) between TRMs (red) and non-TRMs (blue). d Violin plots illustrating the expression of the indicated genes in TRMs (red) and non-TRMs (blue). *p < 0.05; **p < 0.01; ***p < 0.001; ****p < 0.0001 (two-sided Wilcoxon test). e Gene ontology (GO) term analysis in TRMs. The intensity of color indicates p-value. f Gene Set Enrichment Analysis (GSEA) showing that TRMs were enriched in gene sets associated with the immune response. NES, normalized enrichment score. g Bar plots depicting the proportions of TRMs (red) and non-TRMs (blue) in each sample. h Box plots illustrating the proportions of cell subclusters in normal cervix and cervical cancer (CC) tissues. i Representative immunofluorescent labeling of CD103 (green), CD3 (red), and 4,6-diamidino-2-phenylindole (DAPI, blue) in sections from CC (up) and normal cervical tissues (down). Box plots showing the percentage of CD103+ CD3+ TRMs and CD103- CD3+ non-TRMs in CC and normal cervical tissues based on immunofluorescent labeling results. Scale bar in figure, 80 μm. The p-values were generated using the Wilcoxon test.
Fig. 2
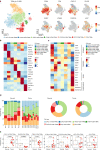
Fig. 2. Characteristics of TRMs in the TME of CC.
a tSNE plots showing distribution of TRMs from CC tissues (blue) and those from normal cervical tissues (pink). b Volcano plot showing DEGs between TRMs from CC tissues and those from normal cervical tissues. c Heatmap showing the expression of functional signature genes, whereby color intensity indicates average gene expression. d GO term analysis in TRMs from CC tissues. The color intensity indicates p-value. e GSEA showing differences in the activation of various immune cell pathways in TRMs from CC tissues and in those from normal cervical tissues.
Fig. 3
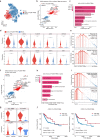
Fig. 3. Single-cell transcriptome profiles of 12,945 TRMs.
a tSNE plots showing the TRM subclusters and the expression of marker genes; the color key shows the gradient of normalized expression. Heatmaps displaying the relative expression of the top 3 DEGs (b) and functional signature genes (c) in the seven TRM subclusters; the color intensity reflects the average level of gene expression. d The proportions of the seven TRM subclusters in each tissue and type (CC tissues vs. normal cervical tissues), colored by cell types. e Box plots illustrating the proportions of TRM subclusters in normal cervical (pink) and CC (red) tissues. The p-values were calculated using the paired Wilcoxon test.
Fig. 4
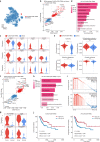
Fig. 4. Characteristics of CXCL13+ CD8+ TRMs.
a tSNE plot showing the distribution of CXCL13+ CD8+ TRMs (red) relative to that of the other TRM subclusters (blue). b Volcano plot depicting DEGs between CXCL13+ CD8+ TRMs (red) and the other TRM subclusters (blue). c GO term analysis of CXCL13+ CD8+ TRMs. The color intensity indicates p-value magnitude. d Violin plots illustrating the expression of the indicated genes in CXCL13+ CD8+ TRMs and the other TRM subclusters. *p < 0.05; **p < 0.01; ***p < 0.001; ****p < 0.0001 (two-sided Wilcoxon test). e GSEA showing differences in pathway activity between CXCL13+ CD8+ TRMs and the other TRM subclusters. f Volcano plot depicting the DEGs between CXCL13+ CD8+ TRMs from CC tissues (red) and those from normal cervical tissues (blue). g Violin plots displaying the expression of the indicated genes in CXCL13+ CD8+ TRMs from CC tissues and in those from normal cervical tissues. *p < 0.05; **p < 0.01; ***p < 0.001; ****p < 0.0001 (two-sided Wilcoxon test). h GO term analysis of CXCL13+ CD8+ TRMs from CC tissues; color intensity indicates p-value magnitude. i GSEA results showing differences in the pathway activities of CXCL13+ CD8+ TRMs from CC tissues and those from normal cervical tissues. j Kaplan–Meier survival analysis of patients with CC following radiotherapy from TCGA database, stratified based on high or low signature gene set score of CXCL13+ CD8+ TRMs. The p-values were calculated using the two-sided log-rank test.
Fig. 5
Fig. 5. Characteristics of PLAC8+ CD8+ TRMs.
a tSNE plot showing the distribution of PLAC8+ CD8+ TRMs (red) relative to that of the other TRM subclusters (blue). b Volcano plot showing DEGs between PLAC8+ CD8+ TRMs (red) and the other TRM subclusters (blue). c Violin plots displaying the expression of the indicated genes between PLAC8+ CD8+ TRMs and the other TRM subclusters. *p < 0.05; **p < 0.01; ***p < 0.001; ****p < 0.0001 (two-sided Wilcoxon test). d GO term analysis of PLAC8+ CD8+ TRMs; the color intensity indicates p-value magnitude. e Violin plots showing differences in pathway activity between PLAC8+ CD8+ TRMs (red) and the other TRM subclusters (blue). f Volcano plot showing DEGs in PLAC8+ CD8+ TRMs between CC tissues (red) and normal cervical tissues (blue). g Violin plots illustrating the expression of indicated genes in PLAC8+ CD8+ TRMs between CC tissues and normal cervical tissues. *p < 0.05; **p < 0.01; ***p < 0.001; ****p < 0.0001 (two-sided Wilcoxon test). h GO term analysis in PLAC8+ CD8+ TRMs of CC tissues. The intensity of color indicates p-values. i GSEA showing differences in the pathway activities of PLAC8+ CD8+ TRMs from CC tissues and those from normal cervical tissues. j Kaplan–Meier survival analysis of patients with CC following radiotherapy from TCGA database, stratified based on high or low signature gene set score of PLAC8+ CD8+ TRMs. The p-values were calculated using a two-sided log-rank test.
Fig. 6
Fig. 6. Crosstalk between epithelial cells and TRMs.
a Bar graphs displaying the number and strength of interactions between epithelial cells and TRMs in normal cervical tissues and CC tissues, respectively. b CellChat analysis of scRNA-seq data to identify cell-cell communications between epithelial cells and TRM subclusters in CC tissues. The color intensity indicates the number (top panel) and strength (bottom panel) of the cell-cell interactions. c Bubble plots showing differences in ligand-receptor pairs involved in interactions between epithelial cell-CXCL13+ CD8+ TRM and epithelial cell-PLAC8+ CD8+ TRM in normal cervical tissues and CC tissues. Bubble size and color intensity indicate p-value magnitude and communication probability, respectively. d Circle plots showing the indicated ligand-receptor pairs involved in interactions between epithelial cells and either CXCL13+ CD8+ TRMs, or PLAC8+ CD8+ TRMs in CC tissues (left) and normal cervical tissues (right); color-coded by cell type. e Representative immunofluorescent labeling of Pan-CK (yellow), CXCL13 (red), CD103 (green), CD8 (white), and DAPI (blue) to identify epithelial cells, CXCL13+ CD8+ TRMs, and their spatial relationship in CC sections. Scale bar in figure, 20 μm.

Similar articles

Cited by

References

    1. Siegel RL, Miller KD, Fuchs HE, Jemal A. Cancer statistics, 2022. CA Cancer J. Clinicians. 2022;72:7–33. doi: 10.3322/caac.21708. - DOI - PubMed
    1. Rahangdale L, et al. Human papillomavirus vaccination and cervical cancer risk. BMJ. 2022;379:e070115. doi: 10.1136/bmj-2022-070115. - DOI - PubMed
    1. Yoon JW, et al. PET/CT Response Criteria (European Organization for Research and Treatment of Cancer) Predict Survival Better Than Response Evaluation Criteria in Solid Tumors in Locally Advanced Cervical Cancer Treated With Chemoradiation. Clin. Nucl. Med. 2016;41:677–682. doi: 10.1097/RLU.0000000000001269. - DOI - PubMed
    1. Perucho JAU, et al. Association between IVIM parameters and treatment response in locally advanced squamous cell cervical cancer treated by chemoradiotherapy. Eur. Radio. 2021;31:7845–7854. doi: 10.1007/s00330-021-07817-w. - DOI - PubMed
    1. Mauricio D, et al. Immunotherapy in Cervical Cancer. Curr. Oncol. Rep. 2021;23:61. doi: 10.1007/s11912-021-01052-8. - DOI - PubMed

LinkOut - more resources