. 2024 Sep;43(17):3710-3732.
doi: 10.1038/s44318-024-00169-3. Epub 2024 Jul 16.

TDP1 phosphorylation by CDK1 in mitosis promotes MUS81-dependent repair of trapped Top1-DNA covalent complexes

Affiliations

TDP1 phosphorylation by CDK1 in mitosis promotes MUS81-dependent repair of trapped Top1-DNA covalent complexes

Srijita Paul Chowdhuri et al. EMBO J. 2024 Sep.

Abstract

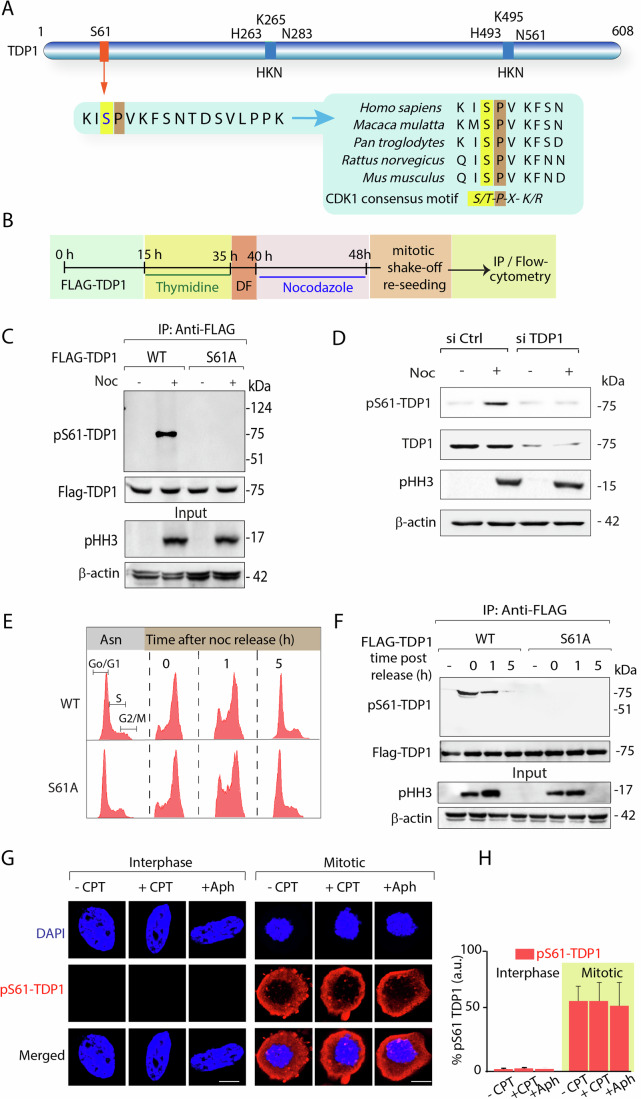
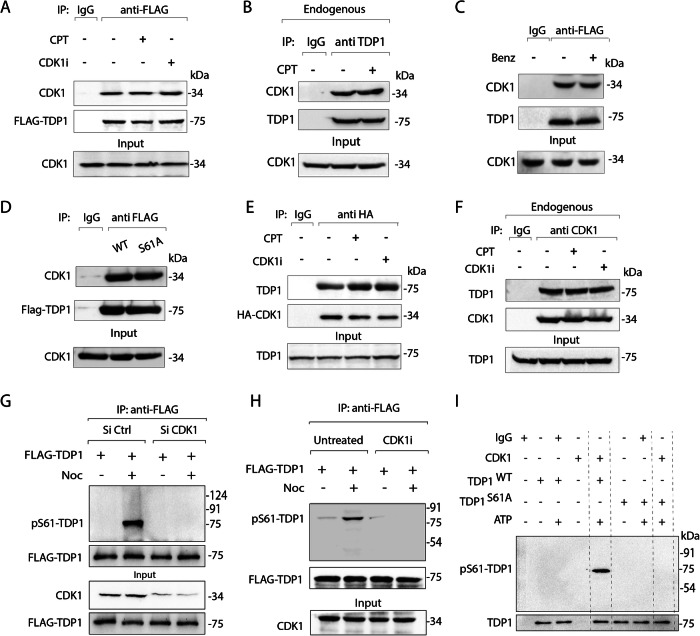
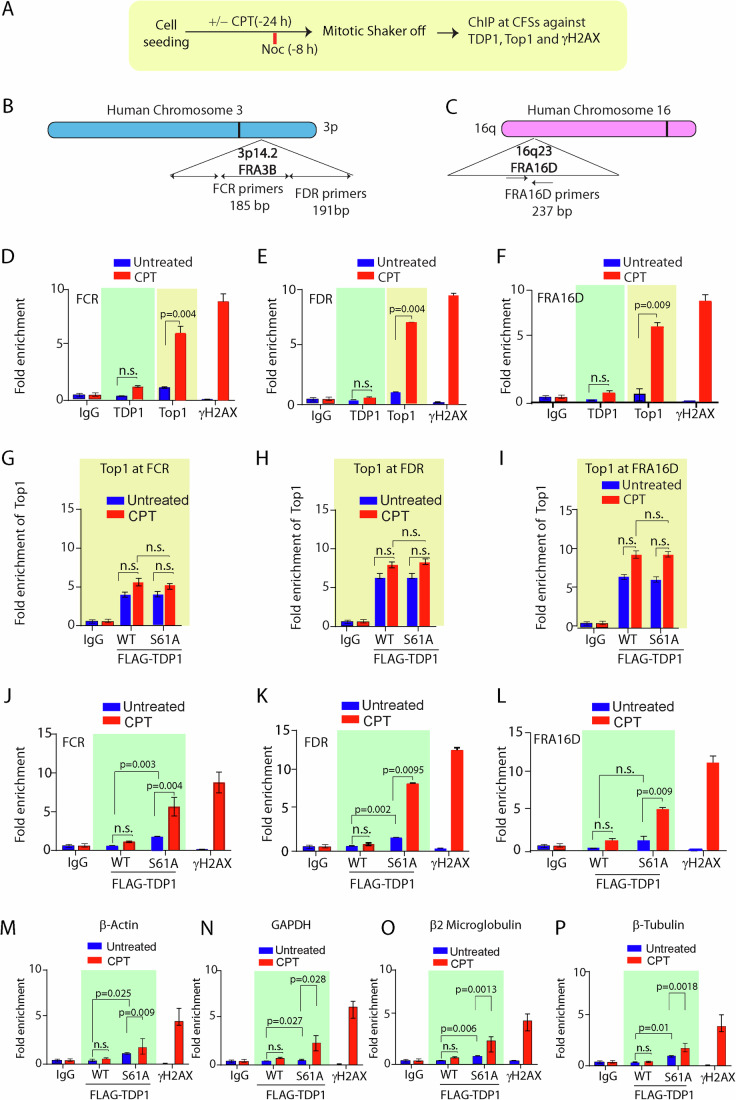
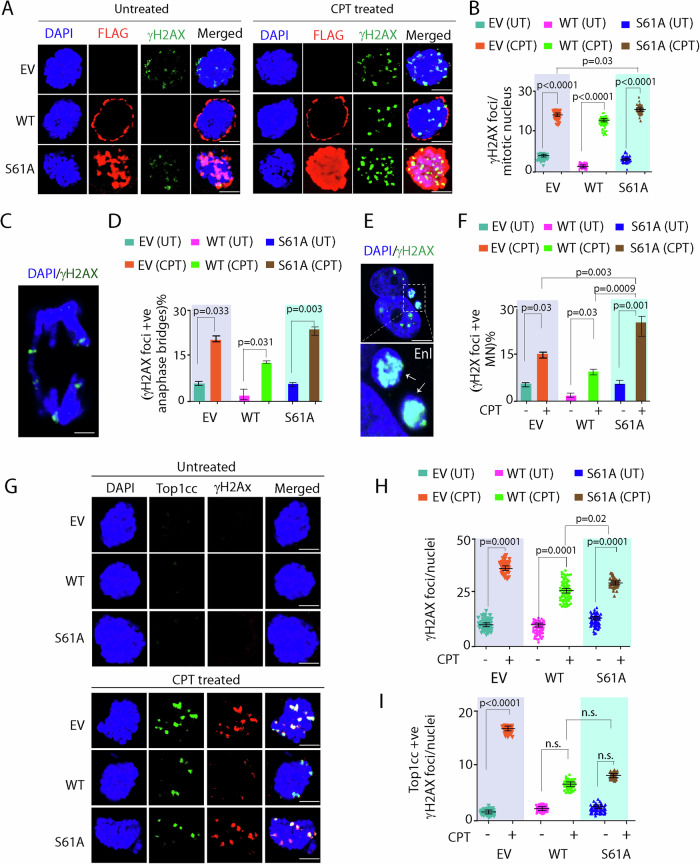
Topoisomerase 1 (Top1) controls DNA topology, relieves DNA supercoiling during replication and transcription, and is critical for mitotic progression to the G1 phase. Tyrosyl-DNA phosphodiesterase 1 (TDP1) mediates the removal of trapped Top1-DNA covalent complexes (Top1cc). Here, we identify CDK1-dependent phosphorylation of TDP1 at residue S61 during mitosis. A TDP1 variant defective for S61 phosphorylation (TDP1-S61A) is trapped on the mitotic chromosomes, triggering DNA damage and mitotic defects. Moreover, we show that Top1cc repair in mitosis occurs via a MUS81-dependent DNA repair mechanism. Replication stress induced by camptothecin or aphidicolin leads to TDP1-S61A enrichment at common fragile sites, which over-stimulates MUS81-dependent chromatid breaks, anaphase bridges, and micronuclei, ultimately culminating in the formation of 53BP1 nuclear bodies during G1 phase. Our findings provide new insights into the cell cycle-dependent regulation of TDP1 dynamics for the repair of trapped Top1-DNA covalent complexes during mitosis that prevents genomic instability following replication stress.

Keywords: CDK1; MUS81; MiDAS; TDP1; Topoisomerase 1.


Conflict of interest statement

The authors declare no competing interests.

Figures

Figure 1
Figure 1. Human TDP1 is phosphorylated at S61 during early mitosis.
(A) Schematic representation of human TDP1 showing the serine phosphorylation site (S61) and the catalytic residues (HKN motifs). The sequence alignment of amino acids of TDP1 in the region flanking the S61 phosphorylation site (a conserved CDK1 substrate phosphorylation site S/T-P-X-K/R is highlighted) from human (Homo sapiens), monkey (Macaca mulatta), chimpanzee (Pan troglodytes), rat (Rattus norvegicus), mouse (Mus musculus) shows the phylogenetic conservation of S61. (B) Schematic representation for the protocol followed for synchronization of MCF7 cells expressing ectopic FLAG-TDP1 variants (WT or S61A) to mitotic phase for immunoprecipitation or PI-RNase based flow cytometry analysis (DF, drug free). (C) Ectopic FLAG-TDP1WT or FLAG-TDP1S61A in MCF7 cells were left asynchronous or synchronized to mitosis, following immunoprecipitation with anti-FLAG antibody, the immune complexes were analyzed by western blotting. Note: The TDP1-S61 phospho-specific antibody (pS61-TDP1) recognizes a single band with a molecular weight corresponding to TDP1 in the mitotic phase only. The same blot was stripped and reprobed with anti-FLAG antibody (FLAG-TDP1). Aliquots (10%) of the input were probed with phospho-histone H3 at Ser10 (anti-pHH3) to indicate mitotic phase and β-actin as loading control. (D) MCF7 cells were transfected with Si Ctrl or Si TDP1 for 72 h, left asynchronous or synchronized to mitosis with nocodazole treatment, and western blotting was performed using anti-pS61-TDP1 antibody. The level of TDP1 knockdown was confirmed by anti-TDP1 antibody with β-actin as a loading control. (E) Flow cytometry profile of the MCF7 cells expressing ectopic FLAG-TDP1 variants (WT and S61A), synchronized to the mitosis phase, and harvested at indicated time points after release from noc. (F) Following mitotic synchronization, FLAG-TDP1 variants were immunoprecipitated at the indicated time points [0, 1 and 5 h post release in drug-free media from nocodazole (Noc) block] using the anti-FLAG antibody, and immune complexes were blotted with the anti-pS61-TDP1 antibody. The same blot was stripped and reprobed with anti-FLAG antibody. Aliquots (10%) of the input indicate the mitotic marker phospho-histone H3 (anti-pHH3) and β-actin as loading control. (G) Immunolocalization of endogenous pS61-TDP1 (red) in MCF7 cells treated with or without CPT (15 nM, 24 h) or aphidicolin (0.4 μM, 24 h) synchronized to interphase or mitosis and detected with anti-pS61-TDP1 antibody. Cells at interphase and mitosis were tallied on the basis of their chromatin morphology, as indicated by DAPI staining (blue). (H) Bar graph showing the intensity of pS61-TDP1 for interphase and mitotic cells following RS with CPT or APH. Intensities from 40 nuclei per stage were expressed as mean ± SD. n = 3 biological replicates. a.u. arbitrary unit. Scale bars, 10 μm. Source data are available online for this figure.
Figure 2
Figure 2. CDK1 physically interacts with TDP1 to catalyze S61 phosphorylation.
(A) MCF7 cells ectopically expressing FLAG-TDP1 treated with or without CPT (5 μM, 3 h) or CDK1i (9 μM, 16 h) were co-immunoprecipitated (co-IP) using anti-FLAG antibody. Immune complexes were blotted with anti-CDK1 antibodies. The same blot was stripped and reprobed with anti-FLAG antibody to show the expression of FLAG-TDP1. Aliquots (10%) of the input show the level of CDK1 prior to immunoprecipitation. (B) Endogenous TDP1 was immunoprecipitated using anti-TDP1 antibody from MCF7 cells treated with or without CPT (5 μM, 3 h). Immune complexes were blotted with anti-CDK1 antibody. The same blot was stripped and reprobed with anti-TDP1 antibody to show TDP1 pull-down. Aliquots (10%) of the input show the level of CDK1 prior to immunoprecipitation. (C) Same as (A), except the cell lysates were pretreated with benzonase (nuclease) prior to co-IP as indicated. Note: The TDP1-CDK1 interaction is resistant to benzonase. (D) MCF7 cells ectopically expressing FLAG-TDP1 variants (WT and S61A) were co-immunoprecipitated (co-IP) using anti-FLAG antibody. Immune complexes were blotted with anti-CDK1 antibody. The same blot was stripped and reprobed with anti-FLAG antibody to show the expression of FLAG-TDP1 variants. Aliquots (10%) of the input show the level of CDK1 prior to immunoprecipitation. (E) MCF7 cells ectopically expressing HA-CDK1 were treated with or without CPT (5 μM, 3 h) and CDK1i (9 μM, 16 h) and immune-precipitated using anti-HA antibody. The immune complexes were blotted with anti-TDP1 antibody. The same blot was stripped and reprobed with anti-HA antibody. Aliquots (10%) of the input show the level of TDP1 prior to immunoprecipitation. (F) Endogenous CDK1 was co-IPed using anti-CDK1 antibody from MCF7 cells treated with or without CPT (5 μM, 3 h) or CDK1i (9 μM, 16 h). Immune complexes were blotted with anti-TDP1 antibody. The same blot was stripped and reprobed with anti-CDK1 antibody. Aliquots (10%) of input show TDP1. (G) FLAG-TDP1 was expressed in MCF7 cells transfected with Si CDK1 to knockdown CDK1 or Si Ctrl as indicated. Following nocodazole treatment (200 ng/ml, 8 h), ectopic FLAG-TDP1 was co-IPed using anti-FLAG antibody, and the immune complexes were blotted with pS61-TDP1 antibody. The same blot was stripped and reprobed with anti-FLAG antibody. Aliquots (10%) of the input show the level of CDK1 knockdown and FLAG-TDP1 prior to immunoprecipitation. (H) FLAG-TDP1 was expressed in MCF7 cells left untreated or treated with CDK1 inhibitor (RO3306) as indicated. Following nocodazole treatment (200 ng/ml, 8 h), ectopic FLAG-TDP1 was co-IPed using anti-FLAG antibody, and the immune complexes were blotted with pS61-TDP1 antibody. The same blot was stripped and reprobed with anti-FLAG antibody. Aliquots (10%) of the input show the level of CDK1 prior to immunoprecipitation. (I) In vitro kinase assays with HA-CDK1 immunoprecipitated from MCF7 cells in the presence of ATP. The substrates were recombinant 6xHis-tagged TDP1 variants (WT or S61A). Western blotting against the anti-TDP1 antibody shows the amount of substrate in each reaction. Protein molecular weight markers (kDa) are indicated on the right. Source data are available online for this figure.
Figure 3
Figure 3. TDP1 phosphorylation at S61 by CDK1 abrogates chromosomal enrichment of TDP1 during mitosis.
(A) Chromatin fractions were prepared from Noc synchronized MCF7 cells transfected with Si Ctrl or Si CDK1 and were blotted with pS61-TDP1 and anti-TDP1 antibodies. Aliquots (10%) show levels of endogenous CDK1 and TDP1 in the whole-cell (WCE) lysates prior to chromatin fractionation. (B) Densitometric analysis of chromatin-bound endogenous TDP1 in mitotic cells upon CDK1 knockdown. Data are mean ± SD, n = 3 biological replicates. *P < 0.05 (one-way ANOVA). (C) TDP1−/− MEFs were co-transfected with FLAG-TDP1WT and Si CDK1 or Si Ctrl and were synchronized with Noc. Chromatin fractions from mitotic cells were analyzed by western blotting against the anti-FLAG antibody and the pS61-TDP1 antibody. Aliquots (10%) show levels of endogenous CDK1 and ectopic FLAG-TDP1WT in the whole-cell (WCE) lysates prior to chromatin fractionation. (D) Densitometric analysis of chromatin-bound ectopic FLAG-TDP1 in mitotic cells upon CDK1 knockdown. Data are mean ± SD, n = 3 biological replicates. ***P < 0.001 (one-way ANOVA). (E) Schematic representation of the protocol followed to study the cell cycle stage-dependent colocalization of endogenous TDP1 with the chromosomes in the presence and absence of CDK1 inhibitor (RO3306) as indicated. (F) MCF7 cells were fixed at different time intervals after release from G2/M arrest as outlined in the protocol and stained with anti-TDP1 antibody to detect endogenous TDP1 (green) and the chromosomes by DAPI (blue). (G) The fluorescence intensity of chromosome-bound endogenous TDP1 was quantified. Staining intensities from 20 to 30 nuclei/stage were expressed as mean ± SD. a.u. arbitrary unit. (H) Schematic representation of the protocol followed to study the cell cycle stage-dependent colocalization of FLAG-TDP1 variants (WT, S61A and S61D) with the chromosomes in the presence and absence of CPT as indicated. (IK) TDP1−/− MFEs complemented with FLAG-TDP1WT (I) or FLAG-TDP1S61A (J) or FLAG-TDP1S61D (K) were fixed after release from nocodazole arrest, and FLAG-TDP1 was immunodetected with anti-FLAG antibody (green) in the presence or absence of CPT (15 nM; 24 h) as indicated. Note: FLAG-TDP1S61A was readily detected on the different phases of mitotic chromosomes stained with DAPI (blue). (L, M) The fluorescence intensity of the chromosome-bound FLAG-TDP1 variants (WT or S61A or S61D) in the absence of CPT (upper panel) or the presence of CPT (bottom panel) was quantified. Staining intensities from 20 to 30 nuclei per stage were expressed as mean ± SD; a.u. arbitrary unit. All the results are expressed as mean ± SD for at least three independent experiments (n = 3). Scale bars, 10 μm. Source data are available online for this figure.
Figure 4
Figure 4. TDP1S61A is enriched at the CFS during mitosis.
(A) A schematic representation of the protocol for synchronization of MCF7 cells followed by chromatin immunoprecipitation (ChIP) with indicated antibodies at the CFS and non-CFS loci. (B, C) Genomic organization of the FRA3B and FRA16D regions, along with the primer sets of the distal (FDR) and central (FCR) region within the FRA3B locus; FRA16D locus, is designated. (DF) Endogenous Top1 but not TDP1 preferentially localizes to CFSs upon CPT (15 nM; 24 h) treatment during mitosis. Quantification of cross-linked FRA3B-FCR, FRA3B-FDR and FRA16D loci chromatin-immunoprecipitated from MCF7 cells using the specified antibodies (Top1 and TDP1). The DSB marker γH2AX antibody was used as a positive control for FRA3B and FRA16D enrichment post CPT treatment. Fold enrichment over IgG was determined and is shown for each primer pair for the ChIP. Data are mean ± SD, n = 3 biological replicates. ns, non-significant (P > 0.05); **P ≤ 0.01 (one-way ANOVA). (GI) Quantification of cross-linked FRA3B-FCR, FRA3B-FDR, and FRA16D loci chromatin-immunoprecipitated from MCF7 cells transfected with FLAG-TDP1 variants (WT or S61A) using the specified antibodies (endogenous Top1). Fold enrichment over IgG was determined and is shown for each primer pair for the ChIP. (JL) Quantification of cross-linked FRA3B-FCR, FRA3B-FDR, and FRA16D loci chromatin-immunoprecipitated from MCF7 cells ectopically expressing the FLAG-TDP1 variants (WT and S61A) using the specified antibodies with or without CPT treatment (15 nM; 24 h). The DSB marker γH2AX antibody was used as a positive control for FRA3B and FRA16D enrichment post CPT treatment. Fold enrichment over IgG was determined and is shown for each primer pair for the ChIP. Data are mean ± SD, n = 3 biological replicates. ns, non-significant (P > 0.05); **P ≤ 0.01 (one-way ANOVA). (MP) Quantification of cross-linked β-actin, GAPDH, β2-microglobulin and β-tubulin loci chromatin-immunoprecipitated from MCF7 cells ectopically expressing the FLAG-TDP1 variants (WT and S61A) using the specified antibodies with or without CPT treatment (15 nM; 24 h). The DSB marker γH2AX antibody was used as a positive control for β-actin, GAPDH, β2-microglobulin and β-tubulin enrichment post CPT treatment. Fold enrichment over IgG was determined and is shown for each primer pair for the ChIP. Data are mean ± SD, n = 3 biological replicates. n.s. non-significant (P > 0.05); *P < 0.05, **P < 0.01; (one-way ANOVA). Source data are available online for this figure.
Figure 5
Figure 5. TDP1S61A trapping generates mitotic DNA breaks independent of Top1ccs.
(A) TDP1−/− MEFs complemented with FLAG-TDP1 variants (TDP1−/−/WT; TDP1−/−S61A) or Empty vector (TDP1−/−/EV) were synchronized in mitosis and treated with or without CPT (10 μM, 1 h), released in presence of nocodazole followed by immunocytochemistry with anti-FLAG (red) to detect FLAG-TDP1 and anti-γH2AX (green) antibody. Cells were counterstained with DAPI to visualize mitotic nuclei (blue). (B) Quantification for the number of γH2AX foci per mitotic nucleus calculated for 50 nuclei. Data are mean ± SD, n = 3 biological replicates. *P ≤ 0.05; ****P ≤ 0.0001 (one-way ANOVA). (C) Representative merged image showing anaphase nucleus (blue) with γH2AX (green) foci on bridges resulting from CPT treatment in TDP1−/−S61A MEFs. The enlarged view of the anaphase bridge has been shown. (D) Quantification of γH2AX-positive anaphase bridges in TDP1−/−/EV; TDP1−/−/WT and TDP1−/−S61A MEFs. Data are mean ± SD, n = 3 biological replicates. *P ≤ 0.05; **P ≤ 0.01 (one-way ANOVA). (E) Representative merged image showing G1 primary nucleus (PN) with micronuclei (MN) harboring γH2AX (green) foci resulting from CPT treatment in mitosis. The enlarged view of the MN with γH2AX in TDP1−/−S61A MEFs has been shown. (F) Quantification of the number of γH2AX-positive G1-MN in TDP1−/−/EV; TDP1−/−/WT, and TDP1−/−/S61A MEFs as indicated. Data are mean ± SD, n = 3 biological replicates. *P ≤ 0.05; **P ≤ 0.01; ***P ≤ 0.001 (one-way ANOVA). (G) TDP1−/−/EV; TDP1−/−/WT, and TDP1−/−/S61A MEFs were treated with CPT (15 nM; 9 h) in late S-phase as indicated to generate replication stress, synchronized in G2/M-phase followed by immunocytochemistry with anti-γH2AX (red) and anti-Top1cc (green) antibody. Cells were counterstained with DAPI to visualize mitotic nuclei (blue). (H, I) Quantifications for the number γH2AX foci (H) and Top1cc-positive γH2AX foci (I) per mitotic nucleus of TDP1−/−/EV; TDP1−/−/WT and TDP1−/−/S61A MEFs treated with CPT in late S calculated for 50 cells. Data are mean ± SD, n = 3 biological replicates. ns non-significant (P > 0.05); *P ≤ 0.05; ****P ≤ 0.0001 (one-way ANOVA). Scale bars, 10 μm. Source data are available online for this figure.
Figure 6
Figure 6. TDP1S61 trapping amplifies mitotic DNA breaks by elevating MUS81 chromatin enrichment.
(AD) TDP1−/− MEFs complemented with EV or FLAG-TDP1 variants (TDP1−/−/WT and TDP1−/−/S61A) were treated with or without CPT (15 nM; 24 h) or Aph (0.4 μM, 24 h) alone or in combination (CPT + APH 24 h) and enriched at M-phase. Representative images show break-induced repair with newly synthesized mitotic DNA marked by BrdU foci (red). The γH2AX foci, signifying the DNA strand breaks, are shown in green. Cells were counterstained with DAPI to visualize nuclei (blue). (E, F) Quantification of γH2AX foci per nucleus and percentage of BrdU-positive mitotic nucleus obtained from immunofluorescence by confocal microscopy were calculated for 20–25 cells. Data are mean ± SD, n = 3 biological replicates. ns, non-significant (P > 0.05); ***P ≤ 0.001; ****P ≤ 0.0001 (one-way ANOVA). (G) Chromatin fractions were prepared from TDP1−/−/WT and TDP1−/−/S61A MEFs after CPT treatment (15 nM; 24 h) and analyzed by western blotting to detect FLAG-TDP1 variants and MUS81 with anti-FLAG and anti-MUS81 antibodies, respectively. Anti-HH3 and anti-pHH3 were used as chromosomal and mitotic markers. Protein levels of MUS81, FLAG-TDP1WT, and FLAG-TDP1S61A were analyzed in whole-cell lysates (WCE) to ensure equal levels of protein before chromatin fractionation. (H) Quantification showing the relative chromosomal enrichment of FLAG-TDP1 variants (WT or S61A) in interphases (Asn) and mitotic (M) chromosomes (left panel). Quantification showing the relative enrichment of MUS81 on mitotic chromosomes in interphases (Asn) and mitosis (M) for indicated cells treated with CPT (15 nM; 24 h) (right panel) n = 3 biological replicates. Data are mean ± SD, n = 3 biological replicates. ns, non-significant (P > 0.05); *P ≤ 0.05; **P ≤ 0.01 (one-way ANOVA). (I) Representative images of immunofluorescence microscopy showing induction of CPT (15 nM, 24 h)-induced γH2AX (green) and MUS81 (red) foci during mitosis in TDP1−/−/EV, TDP1−/−/WT, and TDP1−/−/S61A MEFs, co-transfected either with Si Ctrl or Si MUS81 to knockdown MUS81. Cells were counterstained with DAPI to visualize mitotic nuclei (blue). Note: Colocalization of CPT-induced γH2AX and MUS81 foci in merged images indicates MUS81 overloading amplifies mitotic DNA breaks in TDP1−/−/S61A MEFs. (J) Representative western blot analysis for the immunofluorescence microscopy in (I) to detect the levels of MUS81 and FLAG-TDP1 in TDP1−/−/EV, TDP1−/−/WT, and TDP1−/−/S61A MEFs, co-transfected either with Si Ctrl or Si MUS81 to knockdown MUS81. β-actin has been used as loading control. (K) Quantifications of MUS81 foci on the mitotic chromosomes scored for 50 nuclei (each category) as depicted by the corresponding bar diagram. Data are mean ± SD, n = 3 biological replicates. ns, non-significant (P > 0.05); **P ≤ 0.01 (one-way ANOVA). (L) Quantifications for CPT-induced γH2AX foci on mitotic nuclei in indicated cells (n = 50 cells from three biological replicates; mean ± SD). Note: siRNA knockdown of MUS81 significantly reduced CPT-induced γH2AX. ns, non-significant (P > 0.05); ****P ≤ 0.0001 (one-way ANOVA). (M) A schematic representation for the protocol followed for the ChIP of endogenous MUS81 at the CFS loci in mitosis following CPT (15 nM, 24 h) treatment. (NP) Quantification of cross-linked FRA3B-FCR, FRA3B-FDR, and FRA16D loci chromatin-immunoprecipitated from MCF7 cells transfected with empty vector (EV) or FLAG-TDP1 variants (WT or S61A) using the specified antibodies. Fold enrichment over IgG was determined and is shown for each primer pair for the ChIP. Data are mean ± SD, n = 3 biological replicates. *P ≤ 0.1; **P ≤ 0.01 (one-way ANOVA). Scale bars, 10 μm. Source data are available online for this figure.
Figure 7
Figure 7. MUS81 knockdown protects TDP1−/−/S61A MEFs against CPT-induced replication stress.
(A) Representative confocal microscopic images showing the mitotic defects observed in TDP1−/− MEFs complemented with FLAG-TDP1S61A following CPT treatment (15 nM; 24 h). MN micronuclei, AB anaphase bridges, CB chromatid breaks, CD cohesion defect. (B) Schematic representation of the protocol followed for the scoring of mitotic defects on metaphase chromosomes in TDP1−/− MEFs complemented with FLAG-TDP1 variants (TDP1−/−/WT and TDP1−/−/S61A) or Empty vector (TDP1−/−/EV), co-transfected either with Si Ctrl or Si MUS81 to knockdown MUS81. The indicated cells were synchronized in the mitotic phase following CPT treatment before metaphase spread. (C) The percentage of mitotic defects was scored for 150 metaphase spreads (each category), as depicted by the corresponding bar diagram quantification as indicated. Data are mean ± SD, n = 3 biological replicates. ns, non-significant (P > 0.05), *P ≤ 0.05; **P ≤ 0.01(one-way ANOVA). (D) Bar graphs showing the percentage of binucleated cells with MN in TDP1−/− MEFs complemented with FLAG-TDP1 variants (TDP1−/−/WT and TDP1−/−/S61A) or Empty vector (TDP1−/−/EV), co-transfected either with Si Ctrl or Si MUS81 to knockdown MUS81. Data are mean ± SD, n = 3 biological replicates. ns non-significant (P > 0.05), *P ≤ 0.05 (one-way ANOVA). (E) Bar graphs showing the percentage of anaphase cells with AB in TDP1−/− MEFs complemented with FLAG-TDP1 variants (TDP1−/−/WT and TDP1−/−/S61A) or Empty vector (TDP1−/−/EV), co-transfected either with Si Ctrl or Si MUS81 to knockdown MUS81. Data are mean ± SD, n = 3 biological replicates. *P ≤ 0.05; (one-way ANOVA). (F) Representative images of immunofluorescence microscopy show the induction of CPT-induced 53BP1 nuclear bodies in the G1 phase. TDP1−/− MEFs complemented with FLAG-TDP1 variants (WT and S61A) were treated with CPT (15 nM, 24 h) followed by G2/M arrest with 200 ng/mL nocodazole during the last 8 h of CPT treatment. Mitotic cells were harvested by shake-off and re-seeded in drug-free medium. Five hours after release, cells were fixed and stained with the anti-53BP1 antibody (green) and DAPI (blue) as nuclear stain. Scale bars, 10 μm. (G) Quantifications showing the percentage of cells detected with CPT-induced 53BP1 nuclear bodies in G1 phase calculated for 45–50 cells in indicated cell types. Data are mean ± SD, n = 3 biological replicates. **P ≤ 0.01; (one-way ANOVA). (H) Quantification of CPT-induced DNA strand breaks measured by neutral comet assays in TDP1−/− MEFs complemented with FLAG-TDP1 variants (WT and S61A) or Empty vector (EV), co-transfected either with Si Ctrl or Si MUS81 to knockdown MUS81 arrested in mitotic phase with 200 ng/mL nocodazole added during the last 8 h of CPT treatment. CPT-induced comet tail lengths were calculated for 50 cells. Data are mean ± SD, n = 3 biological replicates. **P ≤ 0.01 (one-way ANOVA). (I) Survival of MCF7 cells transfected either with Si Ctrl or Si MUS81 to knockdown MUS81 in the presence of CPT. Percentage survival was normalized for the CPT-untreated cells ± SEM. n = 3 biological replicates. n.s. non-significant (P >0.05). Inset: western blots showing the levels of MUS81 knockdown and the corresponding TDP1 levels in the MCF7 cells. Actin was used as a loading control. (J) Survival of TDP1−/− MEF cells complemented with FLAG-TDP1 variants (WT or S61A), co-transfected with expressing Si Ctrl or Si MUS81 to knockdown MUS81 and in the presence of CPT. Percent survival was normalized to the CPT-untreated cells ± SEM. n = 3 biological replicates. Asterisks denote statistically significant differences **P ≤ 0.01 (t test). (K) Model depicting how TDP1S61A trapping on mitotic chromosomes leads to hyperactivation of mitotic DNA synthesis (MiDAS), causing excessive MUS81-Eme1 endonuclease-mediated DNA resection and breaks on the mitotic DNA. These breaks manifest as bulky anaphase bridges followed by chromosomal segregation defects leading to the formation of micronuclei and the accumulation of 53BP1 nuclear bodies in G1 daughter cells. CDK1-mediated phosphorylation of TDP1 at the S61 residue promotes its exclusion from the mitotic chromosome to safeguard genomic stability. Source data are available online for this figure.

References

    1. Arlt MF, Glover TW (2010) Inhibition of topoisomerase I prevents chromosome breakage at common fragile sites. DNA Repair 9:678–689 10.1016/j.dnarep.2010.03.005 - DOI - PMC - PubMed
    1. Ashour ME, Atteya R, El-Khamisy SF (2015) Topoisomerase-mediated chromosomal break repair: an emerging player in many games. Nat Rev Cancer 15:137–151 10.1038/nrc3892 - DOI - PubMed
    1. Belotserkovskaya R, Jackson SP (2014) Keeping 53BP1 out of focus in mitosis. Cell Res 24:781–782 10.1038/cr.2014.62 - DOI - PMC - PubMed
    1. Bhattacharjee S, Rehman I, Basu S, Nandy S, Richardson JM, Das BB (2022a) Interplay between symmetric arginine dimethylation and ubiquitylation regulates TDP1 proteostasis for the repair of topoisomerase I-DNA adducts. Cell Rep 39:110940 10.1016/j.celrep.2022.110940 - DOI - PubMed
    1. Bhattacharjee S, Rehman I, Nandy S, Das BB (2022b) Post-translational regulation of Tyrosyl-DNA phosphodiesterase (TDP1 and TDP2) for the repair of the trapped topoisomerase-DNA covalent complex. DNA Repair 111:103277 10.1016/j.dnarep.2022.103277 - DOI - PubMed

LinkOut - more resources