. 2024 Jul 16;15(1):286.
doi: 10.1007/s12672-024-01141-7.

AURKB promotes immunogenicity and immune infiltration in clear cell renal cell carcinoma

Affiliations

AURKB promotes immunogenicity and immune infiltration in clear cell renal cell carcinoma

Weihao Liu et al. Discov Oncol. .

Abstract

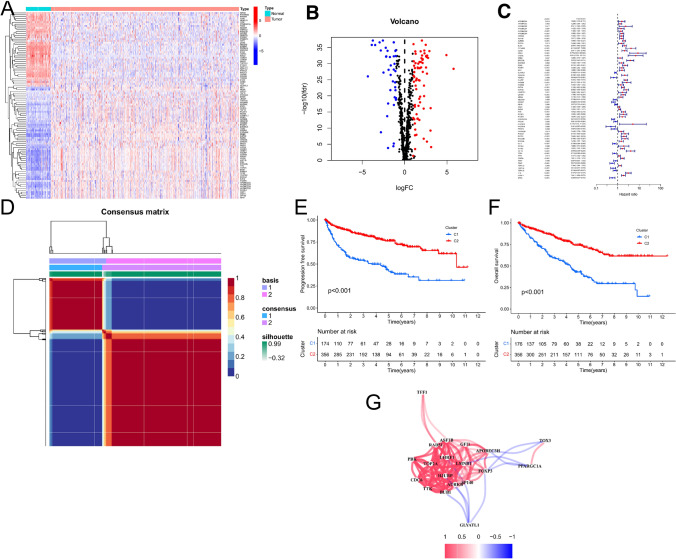
Background: Chromatin regulators (CRs) are capable of causing epigenetic alterations, which are significant features of cancer. However, the function of CRs in controlling Clear Cell Renal Cell Carcinoma (ccRCC) is not well understood. This research aims to discover a CRs prognostic signature in ccRCC and to elucidate the roles of CRs-related genes in tumor microenvironment (TME).

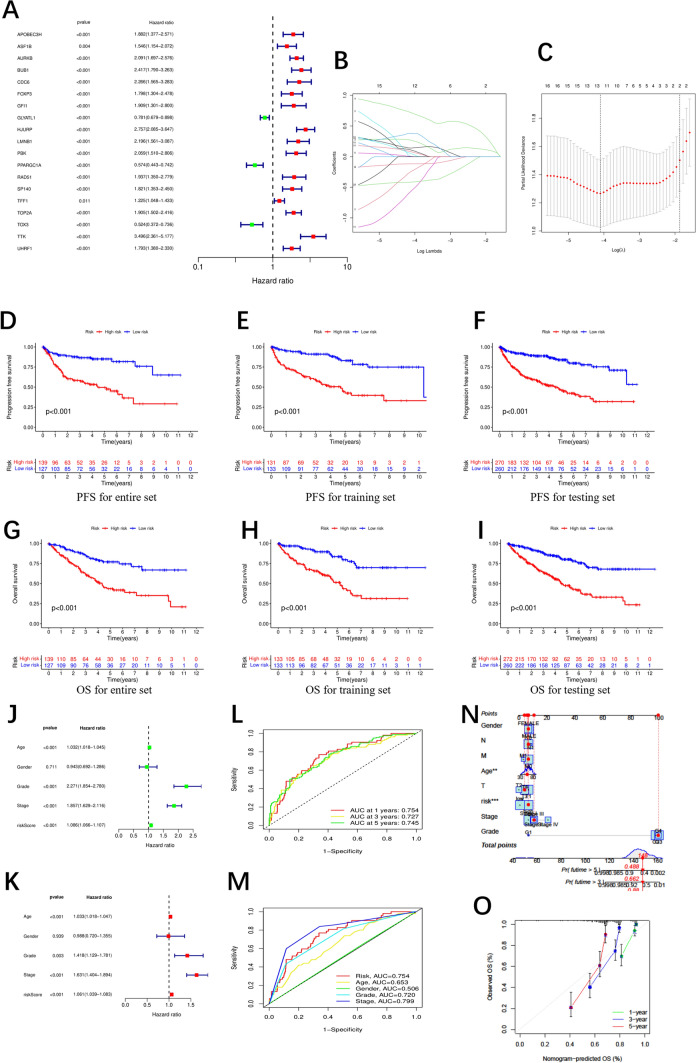
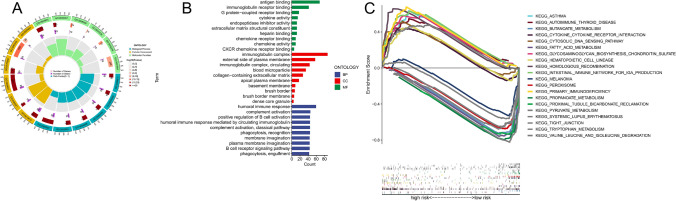
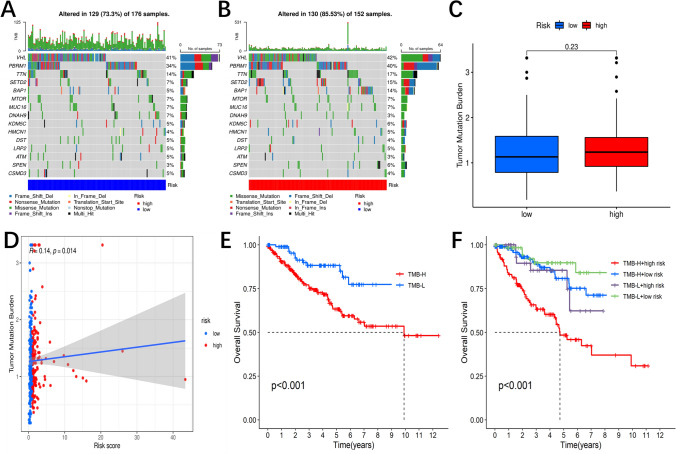
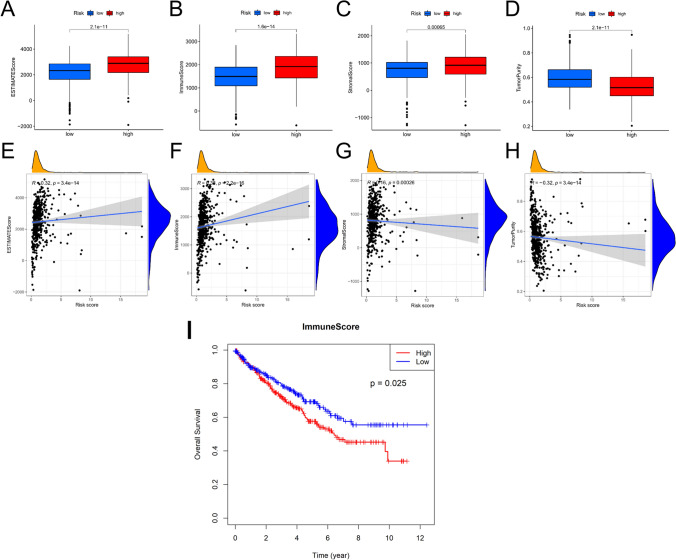
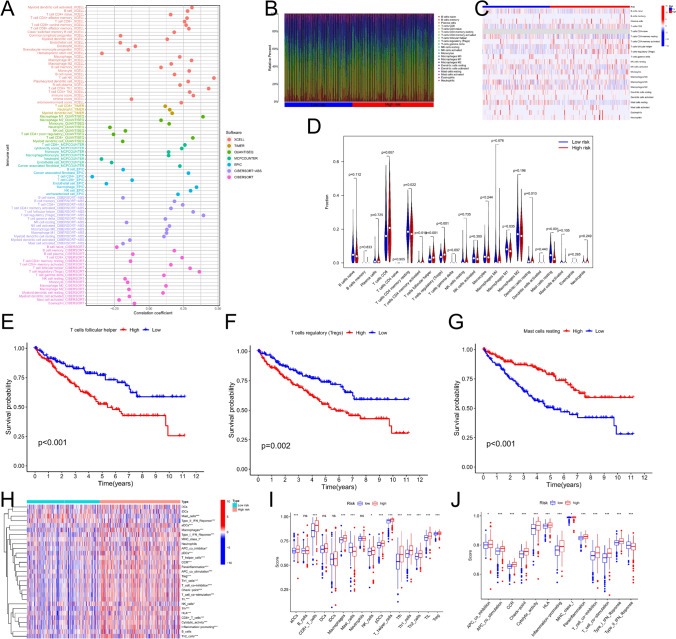
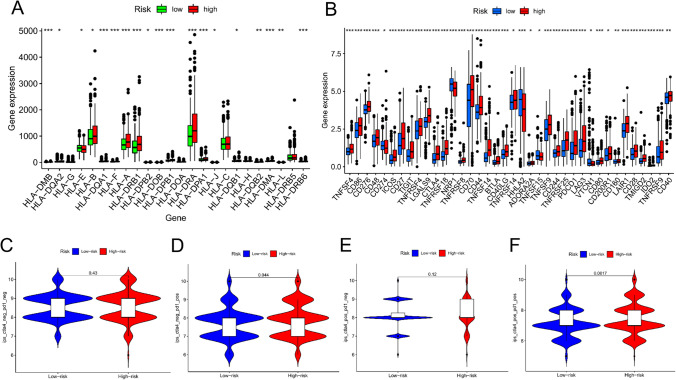
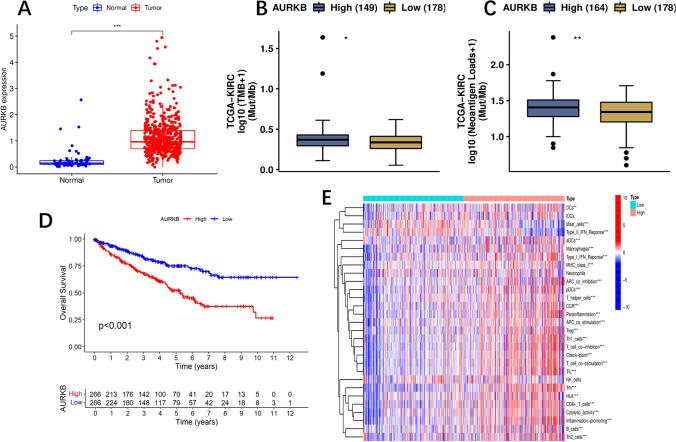
Methods: Expression profiles and relevant clinical annotations were retrieved from the Cancer Genome Atlas (TCGA) and UCSC Xena platform for progression-free survival (PFS) data. The R package "limma" was used to identify differentially expressed CRs. A predictive model based on five CRs was developed using LASSO-Cox analysis. The model's predictive power and applicability were validated using K-M curves, ROC curves, nomograms, comparisons with other models, stratified survival analyses, and validation with the ICGC cohort. GO and GSEA analyses were performed to investigate mechanisms differentiating low and high riskScore groups. Immunogenicity was assessed using Tumor Mutational Burden (TMB), immune cell infiltrations were inferred, and immunotherapy was evaluated using immunophenogram analysis and the expression patterns of human leukocyte antigen (HLA) and checkpoint genes. Differentially expressed CRs (DECRs) between low and high riskScore groups were identified using log2|FC|> 1 and FDR < 0.05. AURKB, one of the high-risk DECRs and a component of our prognostic model, was selected for further analysis.

Results: We constructed a 5 CRs signature, which demonstrated a strong capacity to predict survival and greater applicability in ccRCC. Elevated immunogenicity and immune infiltration in the high riskScore group were associated with poor prognosis. Immunotherapy was more effective in the high riskScore group, and certain chemotherapy medications, including cisplatin, docetaxel, bleomycin, and axitinib, had lower IC50 values. Our research shows that AURKB is critical for the immunogenicity and immune infiltration of the high riskScore group.

Conclusion: Our study produced a reliable prognostic prediction model using only 5 CRs. We found that AURKB promotes immunogenicity and immune infiltration. This research provides crucial support for the development of prognostic biomarkers and treatment strategies for ccRCC.

Keywords: Chromatin regulators; Immune therapy; Immunogenicity; Prognostic model; TICs; ccRCC.


Conflict of interest statement

No conflicts of interest are declared by the authors.

Figures

Fig. 1
Fig. 1
Screening of CRs associated with progression in ccRCC. A Heatmap showed differentially expressed CRs. B Volcano diagram of CRs that displayed abnormal expression in ccRCC and normal tissue specimens. Red dots: up-regulation and blue dots: down-regulation. C Identification of prognostic CRs by univariate Cox regression analysis. D ccRCC samples were clustered by nonnegative matrix factorization (NMF) method. EF Kaplan–Meier survival curves of patients with PFS and OS in the two subclasses. G Co-expression networks of 20 differentially expressed CRs
Fig. 2
Fig. 2
Construction and Evaluation of prognostic model of CRs. A Univariate Cox regression analysis of prognostic CRs in the training group. B, C cvfit and lambda curves showing the least absolute shrinkage and selection operator (LASSO) regression was performed with the minimum criteria. DI Kaplan–Meier survival curves of patients with PFS and OS in the entire, training, and testing sets, respectively. JK Uni-Cox and multi-Cox analyses of clinicopathologic factors and risk score with overall survival. L 1-, 3-, and 5 year ROC curves of the whole group. M 1-year ROC curves of curves for the prognostic risk model and clinicopathological characteristics. N Nomogram for predicting overall survival. € 1-, 3-, and 5-year overall survival of calibration curves. O Calibration plots of the nomograms in terms of the agreement between nomogram‐predicted and observed 1‐year survival outcomes. The 45°dashed line represented the ideal observation. The red line represented the actual prediction of the model
Fig. 3
Fig. 3
GO and GSEA analysis. AB GO analysis showing many immune-related biological processes were enriched. C GSEA showing significant enrichment of immune-related pathways in the group with high riskScore
Fig. 4
Fig. 4
Immunogenicity analysis. A, B Waterfall plot shows the mutation distribution of the top 15 most frequently mutated genes in the group with high riskScore and low-risk group. C Difference in TMB between the high- and low-riskScore groups. D Correlation between the risk score and TMB. E, F Survival analysis of OS in different groups
Fig. 5
Fig. 5
Analysis of the tumor immune microenvironment. AD Box plots comparing ESTIMATEScore, ImmuneScore, StromalScore and TumorPurity between the low- and high-riskScore groups, respectively. EH Correlation between riskScore and ESTIMATEScore, ImmuneScore, StromalScore, and TumorPurity, respectively. I Kaplan–Meier curves of overall survival between high and low ImmuneScore patients
Fig. 6
Fig. 6
Analysis of the immune infiltration pattern. A Correlations between risk score and immune cell infiltrations by following software: XCELL; TIMER; QUANTISEQ; MCPCOUNTER; EPIC; CIBERSORT-ABS and CIBERSORT. B Bar graphs exhibiting the distribution of tumour-infiltrating immune cells between the high-riskScore and low-riskScore groups based on CIBERSORT algorithm. C Heat map of immune cell infiltration landscape in the high-/low-riskScore groups based on CIBERSORT algorithm. D Differences in tumour-infiltrating immune cells in the risk groups. EF survival analysis show the prognosis of T cells follicular helper, T cells regulatory (Tregs) and Mast cells resting. H ssGSEA scores of immune cells and immune function in the risk group. I-J ssGSEA scores of immune cells and immune function in the risk group. *p < 0.05, **p < 0.01, and ***p < 0.001
Fig. 7
Fig. 7
Immune therapy and Gene–drug sensitivity analysis. A, B Differences in expression of HLA-related genes and common immune checkpoints in the risk groups. CF The relationship between risk group and immunophenoscore (IPS)
Fig. 8
Fig. 8
The role of AURKB. A the expression of AURKB in ccRCC and normal tissues (tumor in red and normal in blue). B, C TMB and Neoantigen Loads analysis of AURKB based on CAMOIP. D survival analysis show the prognosis of AURKB. E ssGSEA scores of immune cells and immune function in expression of AURKB

Similar articles

References

    1. Sung H, Ferlay J, Siegel RL, Laversanne M, Soerjomataram I, Jemal A, Bray F. Global cancer statistics 2020: GLOBOCAN estimates of incidence and mortality worldwide for 36 cancers in 185 countries. CA Cancer J Clin. 2021;71:209–249. doi: 10.3322/caac.21660. - DOI - PubMed
    1. Lopez-Beltran A, Carrasco JC, Cheng L, Scarpelli M, Kirkali Z, Montironi R. 2009 update on the classification of renal epithelial tumors in adults. Int J Urol. 2009;16:432–443. doi: 10.1111/j.1442-2042.2009.02302.x. - DOI - PubMed
    1. Leibovich BC, Lohse CM, Crispen PL, Boorjian SA, Thompson RH, Blute ML, Cheville JC. Histological subtype is an independent predictor of outcome for patients with renal cell carcinoma. J Urol. 2010;183:1309–1315. doi: 10.1016/j.juro.2009.12.035. - DOI - PubMed
    1. Teloken PE, Thompson RH, Tickoo SK, Cronin A, Savage C, Reuter VE, Russo P. Prognostic impact of histological subtype on surgically treated localized renal cell carcinoma. J Urol. 2009;182:2132–2136. doi: 10.1016/j.juro.2009.07.019. - DOI - PMC - PubMed
    1. Kim JK, Kim TK, Ahn HJ, Kim CS, Kim KR, Cho KS. Differentiation of subtypes of renal cell carcinoma on helical CT scans. AJR Am J Roentgenol. 2002;178:1499–1506. doi: 10.2214/ajr.178.6.1781499. - DOI - PubMed

LinkOut - more resources