

Hypercapnia and lung function parameters in chronic obstructive pulmonary disease
- PMID: 39014325
- PMCID: PMC11251095
- DOI: 10.1186/s12890-024-03151-1
Hypercapnia and lung function parameters in chronic obstructive pulmonary disease
Abstract
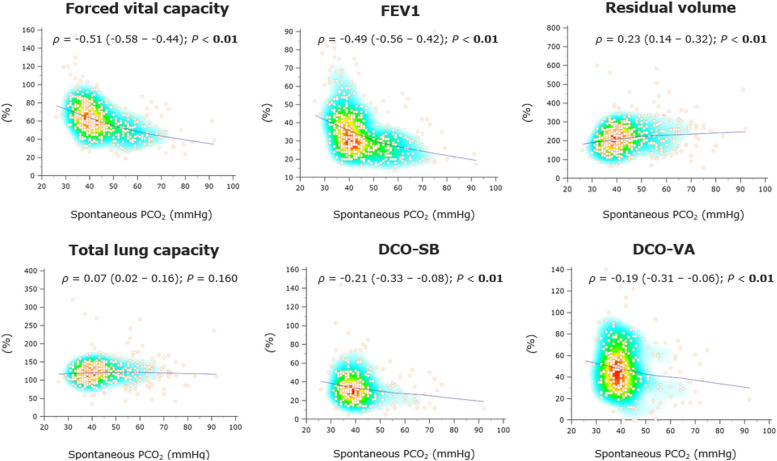
Background: In advanced chronic obstructive pulmonary disease (COPD), hypercapnia may occur due to severe bronchial obstruction with lung hyperinflation. Non-invasive ventilation (NIV) provides the standard of care intended to achieve physiological PCO2 levels, thereby reducing overall mortality. The present study aimed to evaluate pulmonary function parameters derived from spirometry (forced vital capacity [FVC], forced expiratory volume in 1 s [FEV1]), body plethysmography (residual volume [RV], total lung capacity [TLC]), and lung diffusion capacity for carbon monoxide (single-breath method [DCO-SB], alveolar-volume corrected values [DCO-VA]) as predictors of chronic hypercapnia in patients with advanced COPD.
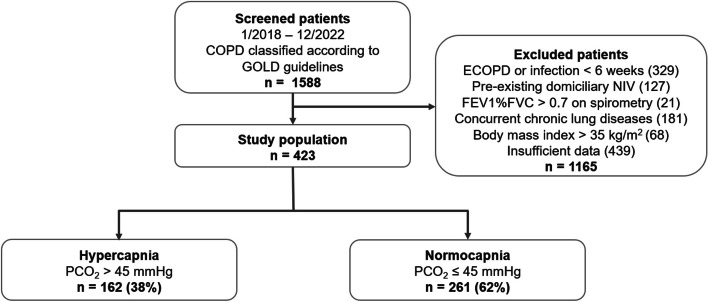
Methods: This monocentric, retrospective observational study included 423 COPD patients. Receiver operating characteristic (ROC) curve analysis and cross-validation were used to assess lung function parameters' diagnostic accuracy for predicting chronic hypercapnia, with the resulting performance expressed as area under the ROC curve (AUROC). We performed univariable and multivariable binary logistic regression analysis to determine if these parameters were independently associated with chronic hypercapnia, with probabilities reported as odds ratios [OR] with 95% confidence intervals [95%CI].
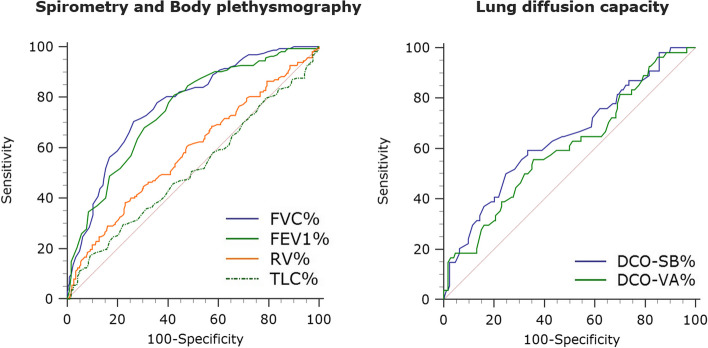
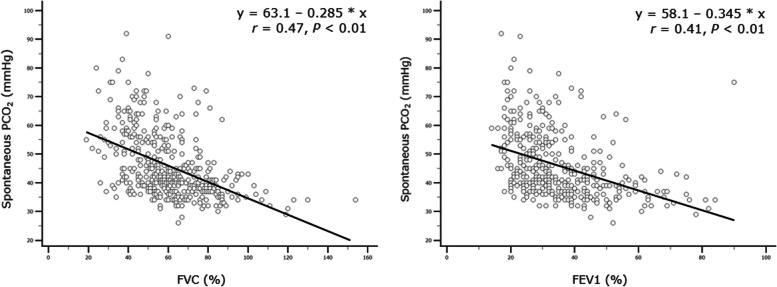
Results: FVC% (AUROC 0.77 [95%CI 0.72-0.81], P < 0.01) and FEV1% (AURIC 0.75 [95%CI 0.70-0.79], P < 0.01) exhibited reasonable accuracy in the prediction of chronic hypercapnia, whereas lung diffusion capacity performed poorly (AUROC 0.64 [95%CI 0.58-0.71] for DCO-SB%, P < 0.01). FVC% (OR 0.95 [95%CI 0.93-0.97], P < 0.01) and FEV1% (OR 0.97 [95%CI 0.94-0.99], P = 0.029) were the only parameters associated independently with chronic hypercapnia in logistic regression analysis. FVC and FEV1 thresholds that best separated hypercapnic from normocapnic subjects reached 56% and 33% of predicted values.
Conclusions: Routinely collected pulmonary function parameters, particularly FVC% and FEV1%, may predict chronic hypercapnia during COPD progression.
Keywords: COPD; Hypercapnia; Lung function parameters; Pulmonary function tests.
© 2024. The Author(s).
Conflict of interest statement
The authors declare no competing interests.
Figures
References
Publication types
MeSH terms
LinkOut - more resources
Full Text Sources
Medical
