Observational Study
. 2024 Jul 17;28(1):246.
doi: 10.1186/s13054-024-05020-z.

Identification and transcriptomic assessment of latent profile pediatric septic shock phenotypes

Affiliations
Observational Study

Identification and transcriptomic assessment of latent profile pediatric septic shock phenotypes

Mihir R Atreya et al. Crit Care. .

Abstract

Background: Sepsis poses a grave threat, especially among children, but treatments are limited owing to heterogeneity among patients. We sought to test the clinical and biological relevance of pediatric septic shock subclasses identified using reproducible approaches.

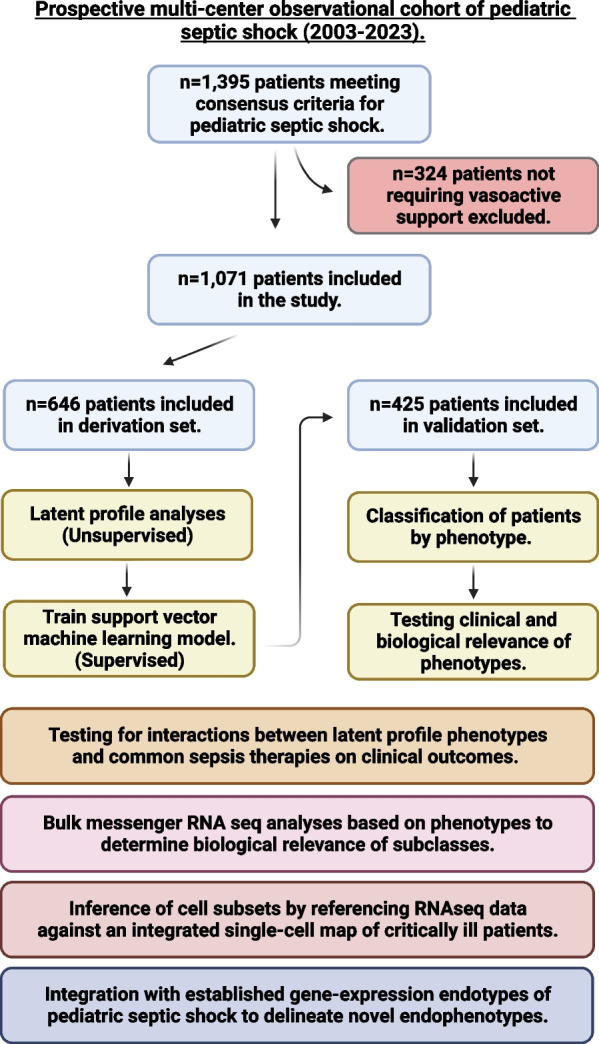
Methods: We performed latent profile analyses using clinical, laboratory, and biomarker data from a prospective multi-center pediatric septic shock observational cohort to derive phenotypes and trained a support vector machine model to assign phenotypes in an internal validation set. We established the clinical relevance of phenotypes and tested for their interaction with common sepsis treatments on patient outcomes. We conducted transcriptomic analyses to delineate phenotype-specific biology and inferred underlying cell subpopulations. Finally, we compared whether latent profile phenotypes overlapped with established gene-expression endotypes and compared survival among patients based on an integrated subclassification scheme.

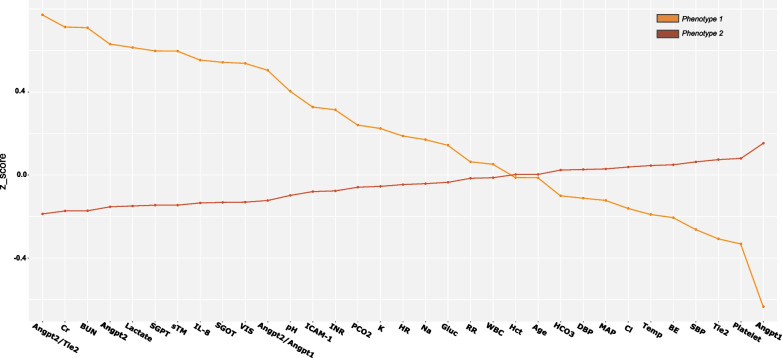
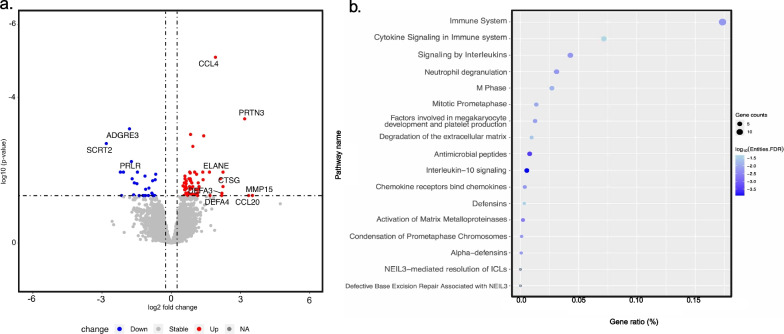
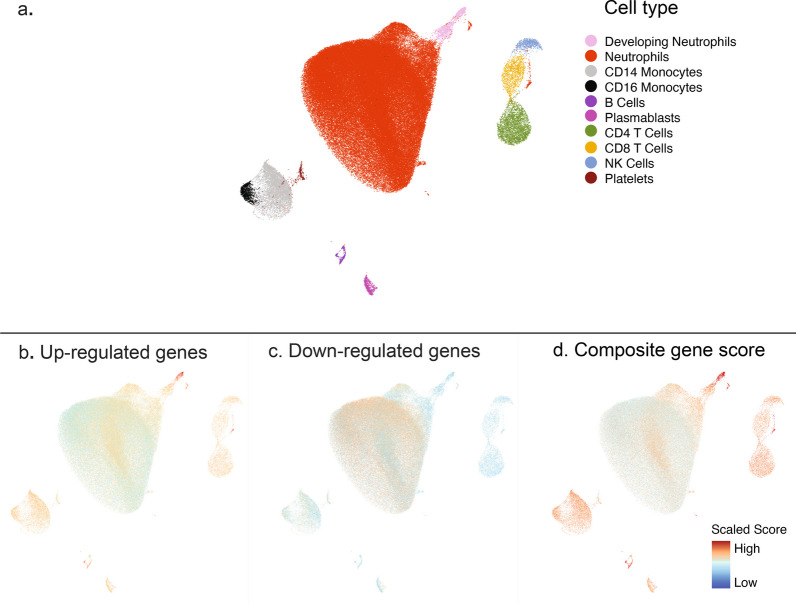
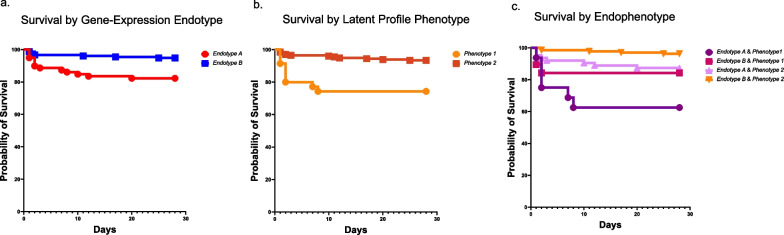
Results: Among 1071 pediatric septic shock patients requiring vasoactive support on day 1 included, we identified two phenotypes which we designated as Phenotype 1 (19.5%) and Phenotype 2 (80.5%). Membership in Phenotype 1 was associated with ~ fourfold adjusted odds of complicated course relative to Phenotype 2. Patients belonging to Phenotype 1 were characterized by relatively higher Angiopoietin-2/Tie-2 ratio, Angiopoietin-2, soluble thrombomodulin (sTM), interleukin 8 (IL-8), and intercellular adhesion molecule 1 (ICAM-1) and lower Tie-2 and Angiopoietin-1 concentrations compared to Phenotype 2. We did not identify significant interactions between phenotypes, common treatments, and clinical outcomes. Transcriptomic analysis revealed overexpression of genes implicated in the innate immune response and driven primarily by developing neutrophils among patients designated as Phenotype 1. There was no statistically significant overlap between established gene-expression endotypes, reflective of the host adaptive response, and the newly derived phenotypes, reflective of the host innate response including microvascular endothelial dysfunction. However, an integrated subclassification scheme demonstrated varying survival probabilities when comparing patient endophenotypes.

Conclusions: Our research underscores the reproducibility of latent profile analyses to identify pediatric septic shock phenotypes with high prognostic relevance. Pending validation, an integrated subclassification scheme, reflective of the different facets of the host response, holds promise to inform targeted intervention among those critically ill.

Keywords: Endotype; Phenotype; Precision medicine; Sepsis.


Conflict of interest statement

Cincinnati Children’s Hospital Medical Center (CCHMC) and the estate of the late Dr. Hector R. Wong hold patents for gene-expression-based pediatric septic shock endotypes, reflective of the host adaptive immune system. M.R.A and R.K hold a provisional patent for gene-expression-based multiple organ dysfunction syndrome (MODS) subclass identification, reflective of the host innate immune response. Inflammatix is a for-profit company focused on the development and commercialization of best-in-class host-response diagnostic tests. Y.H.B and T.E.S are employees and/or stockholders of Inflammatix Inc. P.K is a stockholder of Inflammatix Inc.

Figures

Fig. 1
Fig. 1
Overview of study including inclusion and exclusion criteria, number of patients across the derivation and validation set, and various analytic approaches used to characterize latent profile phenotypes of pediatric septic shock
Fig. 2
Fig. 2
Standardized mean (z-scores) for continuous class predicting variables in the derivation set by latent profile is shown on the y-axis. The predictor variables are sorted on the x-axis from left to right in descending order of difference between the Phenotype 1 (shown in orange) and Phenotype 2 (shown in brown) phenotypes. Angpt2/Tie-2: Angiopoietin-2/Tie-2 ratio; Cr: Creatinine; BUN: blood urea nitrogen; Angpt-2: Angiopoietin-2; Lactate: Serum lactate; SGPT: serum glutamic pyruvic transaminase; sTM: soluble Thrombomodulin; IL-8: Interleukin-8; SGOT: serum glutamic-oxaloacetic transaminase; VIS: Max vasoactive inotropic score on day 1; Angpt-2/Angpt-1: Angiopoietin-2/Angiopoietin-1 ratio; pH; ICAM-1: Intercellular adhesion molecule 1; INR: international normalized ratio; PCO2: partial pressure of carbon dioxide; K: potassium; HR: deviation from age and sex normalized heart rate; Na: Sodium; Gluc: Glucose; RR: respiratory rate; WBC: white blood cell count; HCt: hematocrit; Age: age in years; HCO3: serum bicarbonate; DBP: diastolic blood pressure; MAP: mean arterial pressure; Cl: serum chloride; Temp: Temperature; BE: base excess; SBP: systolic blood pressure; Tie-2: tyrosine kinase with immunoglobulin-like loops and epidermal growth factor homology domains-2; Platelet: platelet count; Angpt-1: Angiopoietin-1
Fig. 3
Fig. 3
Transcriptomic assessment of latent profile phenotypes of pediatric septic shock. a Volcano plot showing differentially expressed genes among patients belonging to Phenotype 1 relative to those Phenotype 2 using a log2(fold change) threshold of ± 0.25. Overexpressed genes are shown in red. Underexpressed genes are shown in blue. The top 10 most differentially expressed genes are labeled including matrix metallopeptidase-15 (MMP15), chemokine ligand 20 (CCL20), proteinase 3 (PRTN3), neutrophil expressed elastase (ELANE), cathepsin G (CTSG), defensin 3 (DEFA3), defensin 4 (DEFA4), chemokine ligand 4 (CCL4), scratch family transcriptional repressor 2 (SCRT2), and adhesion G protein-coupled receptor E3 (ADGRE3). b Biologically enriched pathways among patients with Phenotype 1 relative to those in Phenotype 2. The y-axis represents the REACTOME pathways enriched for the significantly overexpressed genes. The x-axis represents the gene-ratio (%). The size of the circle indicates gene counts. The darker hue of color indicates a lower adj. p value
Fig. 4
Fig. 4
Inference of cell subsets underlying latent profile phenotypes identified in the study. The figure shows the Uniform Manifold Approximation and Projection (UMAP) of the publicly available single-cell transcriptomic dataset from critically ill adults with sepsis published by Kwok et al. a Ten cell subsets were identified in the single-cell dataset. (1) Developing neutrophils (pink), (2) Mature neutrophils (red), (3) Cluster differentiation (CD) 14 positive monocytes (light gray), (4) CD16 positive monocytes (black), (5) B lymphocytes (deep purple), (6) PB: Plasmablasts (purple), (7) CD4 positive T lymphocytes (moss green), (8) CD8 positive T lymphocytes (yellow), (9) NK: Natural killer cells (blue), and (10) Platelets (brown). b Upregulated genes among patients with Phenotype 1 shown in red, c downregulated genes among patients with Phenotype 1 shown in red, and d composite gene score representing geometric mean of upregulated minus downregulated genes among patients belonging to Phenotype 1. The gene score was scaled as shown in the legend. Cells in red represent those with a high composite gene score indicating that they contributed predominantly to over-expressed genes among patients with Phenotype 1. In contrast, cells in blue represent those with a low composite gene score indicating that they contributed predominantly to genes underexpressed among patients with Phenotype 2
Fig. 5
Fig. 5
From left to right, Kaplan Meier survival curves based on a established gene-expression endotype (A in red vs. B in blue); Patients with Endotype A had a higher hazard of 28-day mortality compared to Endotype B (HR 3.7 (95% CI 1.5, 8.7), p = 0.003), b latent profile phenotype (Phenotype 1 in orange and Phenotype 2 in brown); Patients with Phenotype 1 had a higher hazard of 28-day mortality compared to those belonging to Phenotype 2 (HR 4.5 (95% CI 1.9, 10.6), p < 0.001). c Integrated subclass assignment scheme that considered both the endotype and phenotype assignment among patients including all four possible combinations: (i) Endotype A/Phenotype 1 (deep purple), (ii) Endotype B/Phenotype 1 (deep plum), (iii) Endotype A/Phenotype 2 (light magenta), (iv) Endotype B/Phenotype 2 (orange). Patients assigned as both Endotype B and Phenotype 2 had the lowest mortality risk. Compared to this group, patients classified as Endotype A & Phenotype 1 had a higher hazard of mortality (HR 12.5 (95% CI 3.8, 41.2), p < 0.001). Patients classified as Endotype B & Phenotype 1 had a hazard ratio of mortality of 4.8 (95% CI 1.1, 20.1, p = 0.032). Patients classified as Endotype A & Phenotype 2 had a hazard ratio of mortality of 3.6 (95% CI 1.2, 11.1), p = 0.024. There were no statistically significant differences between the latter two groups

Similar articles

Cited by

References

    1. Rudd KE, Johnson SC, Agesa KM, Shackelford KA, Tsoi D, Kievlan DR, et al. Global, regional, and national sepsis incidence and mortality, 1990–2017: analysis for the Global Burden of Disease Study. Lancet. 2020;395(10219):200–211. doi: 10.1016/S0140-6736(19)32989-7. - DOI - PMC - PubMed
    1. Global report on the epidemiology and burden of sepsis: current evidence, identifying gaps and future directions. World Health Organization. 2020. p.56. Available from: https://apps.who.int/iris/bitstream/handle/10665/334216/9789240010789-en...
    1. Marshall JC. Why have clinical trials in sepsis failed? Trends Mol Med. 2014;20(4):195–203. doi: 10.1016/j.molmed.2014.01.007. - DOI - PubMed
    1. Shah FA, Meyer NJ, Angus DC, Awdish R, Azoulay É, Calfee CS, et al. A research agenda for precision medicine in sepsis and acute respiratory distress syndrome: an Official American Thoracic Society Research Statement. Am J Respir Crit Care Med. 2021;204(8):891–901. doi: 10.1164/rccm.202108-1908ST. - DOI - PMC - PubMed
    1. Wong HR, Cvijanovich N, Lin R, Allen GL, Thomas NJ, Willson DF, et al. Identification of pediatric septic shock subclasses based on genome-wide expression profiling. BMC Med. 2009;7:34. doi: 10.1186/1741-7015-7-34. - DOI - PMC - PubMed

Publication types

LinkOut - more resources