. 2024 Jul 16;21(1):174.
doi: 10.1186/s12974-024-03164-x.

PARK7/DJ-1 deficiency impairs microglial activation in response to LPS-induced inflammation

Affiliations

PARK7/DJ-1 deficiency impairs microglial activation in response to LPS-induced inflammation

Frida Lind-Holm Mogensen et al. J Neuroinflammation. .

Abstract

Background: Specific microglia responses are thought to contribute to the development and progression of neurodegenerative diseases, including Parkinson's disease (PD). However, the phenotypic acquisition of microglial cells and their role during the underlying neuroinflammatory processes remain largely elusive. Here, according to the multiple-hit hypothesis, which stipulates that PD etiology is determined by a combination of genetics and various environmental risk factors, we investigate microglial transcriptional programs and morphological adaptations under PARK7/DJ-1 deficiency, a genetic cause of PD, during lipopolysaccharide (LPS)-induced inflammation.

Methods: Using a combination of single-cell RNA-sequencing, bulk RNA-sequencing, multicolor flow cytometry and immunofluorescence analyses, we comprehensively compared microglial cell phenotypic characteristics in PARK7/DJ-1 knock-out (KO) with wildtype littermate mice following 6- or 24-h intraperitoneal injection with LPS. For translational perspectives, we conducted corresponding analyses in human PARK7/DJ-1 mutant induced pluripotent stem cell (iPSC)-derived microglia and murine bone marrow-derived macrophages (BMDMs).

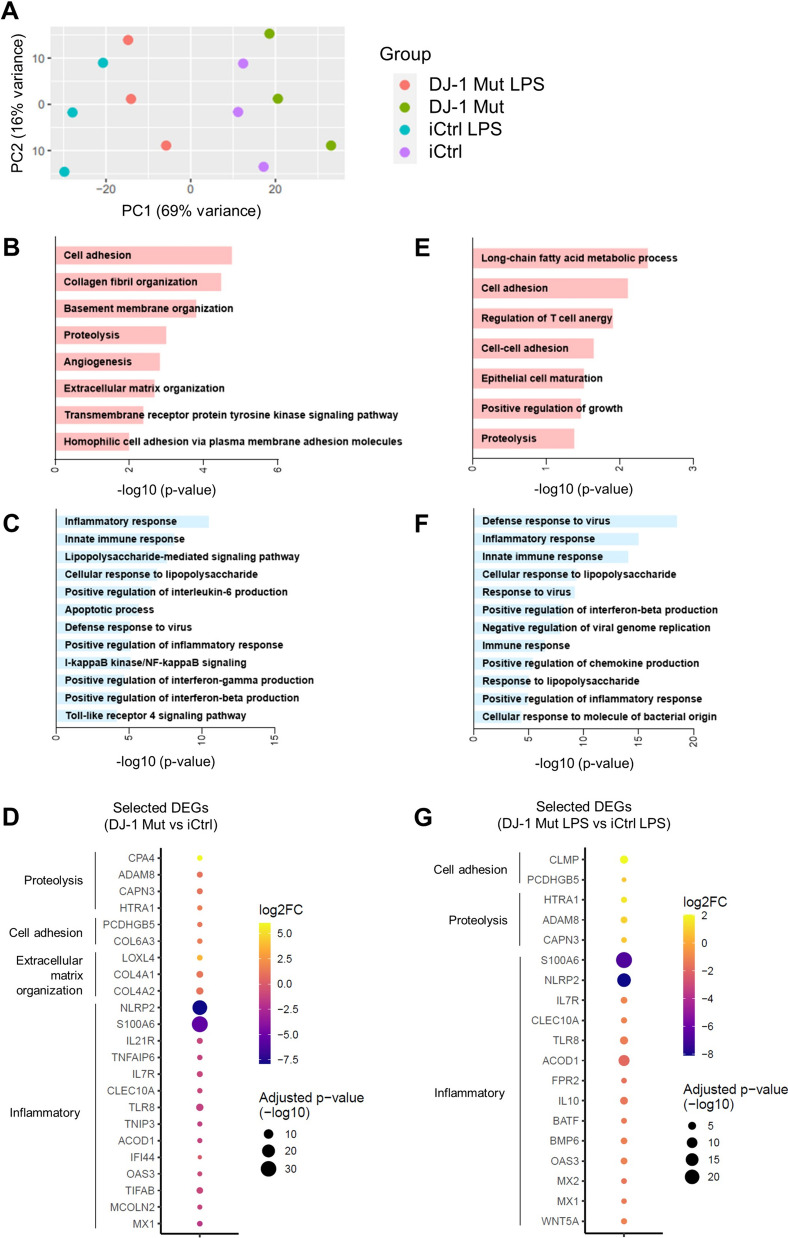
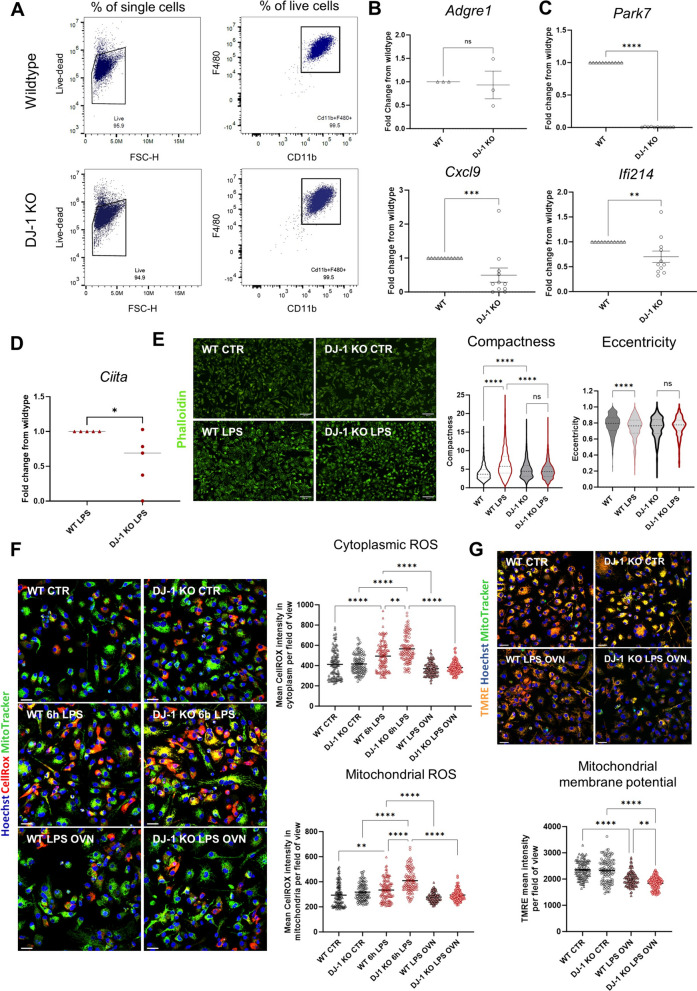
Results: By excluding the contribution of other immune brain resident and peripheral cells, we show that microglia acutely isolated from PARK7/DJ-1 KO mice display a distinct phenotype, specially related to type II interferon and DNA damage response signaling, when compared with wildtype microglia, in response to LPS. We also detected discrete signatures in human PARK7/DJ-1 mutant iPSC-derived microglia and BMDMs from PARK7/DJ-1 KO mice. These specific transcriptional signatures were reflected at the morphological level, with microglia in LPS-treated PARK7/DJ-1 KO mice showing a less amoeboid cell shape compared to wildtype mice, both at 6 and 24 h after acute inflammation, as also observed in BMDMs.

Conclusions: Taken together, our results show that, under inflammatory conditions, PARK7/DJ-1 deficiency skews microglia towards a distinct phenotype characterized by downregulation of genes involved in type II interferon signaling and a less prominent amoeboid morphology compared to wildtype microglia. These findings suggest that the underlying oxidative stress associated with the lack of PARK7/DJ-1 affects microglia neuroinflammatory responses, which may play a causative role in PD onset and progression.

Keywords: PARK7/DJ-1; Lipopolysaccharide; Microglia; Microglia morphology; Neuroinflammation; Parkinson’s disease.


Conflict of interest statement

The authors declare no competing interests.

Figures

Fig. 1
Fig. 1
Subset of classical activated microglia is mainly composed of cells originated from wildtype mice 24 h after systemic LPS-induced inflammation. A Schematic representation of scRNA-sequencing analyses of CD11b+CD45int microglial cells isolated either from PARK7/DJ-1 KO or wildtype mice 24 h following LPS treatment. B UMAP showing 2931 CD11b+CD45int microglial cells from PARK7/DJ-1 KO (yellow) and wildtype (grey) mice 24 h after LPS treatment (n = 2 mice per group). The different size of the dots in the UMAP represents the “read count per cell”, with large or small dots representing cells with high or low read count, respectively. C UMAP showing clustering analysis of 2931 single microglial cells. Numbers indicate amount of cells per cluster. D, E Gene ontology terms corresponding to upregulated genes (adjusted p-value < 0.05, log2FC ≥ 0.5) comparing (D) Cluster 3 or (E) Cluster 4 to the other clusters. F Dot plot showing selected differentially expressed genes (adjusted p-value < 0.05, |log2FC|≥ 0.5) characterizing each cluster. Color code represents the average log2 Fold Change (FC), while the size of the dot is proportional to the statistical significance indicated as − log10 (adjusted p-value). G Alluvial plot showing CD11b+CD45int microglial cells flowing into the identified 5 normalized clusters according to their origin, either from wildtype (grey) or PARK7/DJ-1 KO (yellow) mice. H Heatmap showing percentages of cells deriving either from PARK7/DJ-1 KO or wildtype mice
Fig. 2
Fig. 2
Distinct reaction of microglia in PARK7/DJ-1 KO mice compared to wildtype mice 6 h after systemic LPS-induced inflammation and at baseline. A, B GO terms corresponding to A upregulated or B downregulated genes comparing microglia in PARK7/DJ-1 KO and wildtype male mice 6 h after LPS treatment. C Dot plot showing a selection of differentially expressed genes (p-value < 0.05, |log2FC|≥ 0.5) comparing CD11b+ microglia isolated from PARK7/DJ-1 KO and wildtype mice 6 h after LPS-induced inflammation. Color bar shows log2 Fold Change (FC), while the size of the dot is proportional to the statistical significance indicated as − log10 (p-value). DE GO terms corresponding to D upregulated or E downregulated genes comparing microglia in PARK7/DJ-1 KO and wildtype mice at baseline. F Dot plot showing a selection of variable genes (p-value < 0.05, |log2FC|≥ 0.5) comparing CD11b+ microglia isolated from PARK7/DJ-1 KO and wildtype mice at baseline. Color bar shows log2 Fold Change (FC), while the size of the dot is proportional to the statistical significance indicated as –log10 (p-value). G Venn diagram and GO terms corresponding to upregulated genes matching differentially expressed genes (adjusted p-value < 0.05, log2FC ≥ 0.5) resulting from the comparison of microglia in wildtype and PARK7/DJ-1 KO mice 6 h after LPS treatment. H Cytoplasmic and mitochondrial ROS levels in microglia isolated from wildtype and PARK7/DJ-1 KO male mice cultured overnight left untreated or treated with LPS (100 ng/mL) and analyzed by live imaging. Graphs show normalized CellROX mean of analyzed images (dots). Kruskal–Wallis test with multiple comparisons. ****p < 0.0001; ***p < 0.001; *p < 0.05 (n = mean of 26 images per condition from 3 mice per group)
Fig. 3
Fig. 3
Discrete iPSC-derived microglia signatures between PARK7/DJ-1 mutant and isogenic control cells under LPS treatment and at baseline. A Design aware Principal component analysis (PCA) plot showing clustering of 3 replicates of differentiated iPSC-derived microglia (iMG) per condition: PARK7/DJ-1 mutant and isogenic control iMG untreated or treated with LPS for 6 h. B-C GO terms corresponding to B upregulated or C downregulated genes comparing PARK7/DJ-1 mutant and isogenic control iMG at baseline. D Dot plot showing selected differentially expressed genes (adjusted p-value < 0.05, |log2FC|≥ 0.5) comparing PARK7/DJ-1 mutant and isogenic control iMG at baseline. Color bar shows log2 Fold Change (FC) and the size of the dot is proportional to the statistical significance indicated as –log10 (adjusted p-value). E–F GO terms corresponding to E upregulated or F downregulated genes comparing PARK7/DJ-1 mutant and isogenic control iMG after 6 h LPS treatment. G Dot plot showing selected differentially expressed genes (adjusted p-value < 0.05, |log2FC|≥ 0.5) comparing PARK7/DJ-1 mutant and isogenic control iMG after treatment with LPS for 6 h. Color bar shows log2 Fold Change (FC) and the size of the dot is proportional to the statistical significance indicated as –log10 (adjusted p-value)
Fig. 4
Fig. 4
Microglia in PARK7/DJ-1 KO mice show a more compact morphology compared to wildtype mice at baseline and a less amoeboid morphology 6 and 24 h after LPS treatment. A Alluvial plot showing MIC-MAC analysis of IBA1+ cortical microglial cells flowing into 5 morphological clusters (pictures show 3D reconstructions of a representative microglial cell per cluster, scale bar: 10 μm) based on compactness score (spanning from cluster 1, corresponding to homeostatic ramified microglia, to cluster 5, representing amoeboid cells) according to their mouse origin, either from wildtype (baseline in turquoise, 6 h LPS in purple) or PARK7/DJ-1 KO (baseline in red, 6 h LPS in green) (n = 3–4 mice). B Bar graph showing the ratios of the identified clusters across the four different conditions (wildtype or PARK7/DJ-1 KO 6 h LPS, wildtype or PARK7/DJ-1 KO baseline) (mean = 244 ± 19 cells per cortex region from 3–4 mice per group). Color bar shows compactness score. C Left: representative pictures showing 3D reconstruction of cortical IBA1+ cells in PARK7/DJ-1 KO or wildtype mice with or without 6 h LPS treatment. The shade of red indicates the cluster to which the cell belongs. Scale bar: 150 μm. Right: violin plots showing mean compactness (left) or node density (right) (dotted line) of cortical microglial cells in wildtype or PARK7/DJ-1 KO mice with or without 6 h LPS treatment. Kruskal–Wallis test with Dunn’s test for multiple comparisons. ****p < 0.0001 (mean = 244 ± 19 cells per cortex region from 3–4 mice per group). D Violin plot showing mean of IBA1 intensity (dotted line) divided by the number of IBA1+ voxels of cortical microglial cells in wildtype or PARK7/DJ-1 KO mice with or without 6 h LPS treatment. Kruskal–Wallis test with Dunn’s test for multiple comparisons. ****p < 0.0001 (mean = 244 ± 19 cells per cortex region from 3–4 mice per group). E Representative pictures showing cortical IBA1+ cells in PARK7/DJ-1 KO or wildtype mice with or without 24 h LPS treatment. Scale bar: 50 μm. F Violin plots showing mean compactness (left) or node density (right) (dotted line) of cortical microglial cells in wildtype or PARK7/DJ-1 KO mice with or without 24 h LPS treatment. Kruskal–Wallis test with Dunn’s test for multiple comparisons. **p < 0.01, *p < 0.05 (mean = 22 ± 2 cells per cortex region from 3 mice per group). G Representative pictures showing substantia nigra IBA1+ cells in PARK7/DJ-1 KO or wildtype mice with or without 24 h LPS treatment. Scale bar: 50 μm. H Violin plots showing mean compactness (left) or node density (right) (dotted line) of substantia nigra microglial cells in wildtype or PARK7/DJ-1 KO mice with or without 24 h LPS treatment. Kruskal–Wallis test with Dunn’s test for multiple comparisons. ****p < 0.0001, ***p < 0.001, **p < 0.01 (mean = 9 ± 1 cells per substantia nigra region from 3 mice per group)
Fig. 5
Fig. 5
Characterization of PARK7/DJ-1-deficient bone marrow-derived macrophages at baseline and after LPS-treatment. A Representative gating strategy used to measure percentages of CD11b+F4/80+ BMDMs among total cells from bone marrow precursors isolated from wildtype (upper panel) or PARK7/DJ-1 KO (lower panel) mice (n = 1 mouse per genotype). B Gene expression levels of Adgre1 (F4/80) comparing BMDMs originating from wildtype and PARK7/DJ-1 KO mice analyzed by qPCR. Graph shows mean of fold change (wildtype condition set at 1; Gapdh as housekeeping gene) ± SEM. Mann–Whitney test, ns: not significant (n = 3 mice per group). C Gene expression levels of Park7, Cxcl9 and Ifi214 in wildtype and PARK7/DJ-1 KO BMDMs analyzed by qPCR. Graphs represent mean of fold change (wildtype condition set at 1; Gapdh as housekeeping gene) ± SEM. Mann–Whitney test, ****p < 0.0001, ***p < 0.001, **p < 0.01 (n = 10 mice per group). D Gene expression levels of Ciita in wildtype and PARK7/DJ-1 KO BMDMs under 6 h LPS (100 ng/mL) treatment analyzed by qPCR. Graph represents mean of fold change (wildtype condition set at 1; Gapdh as housekeeping gene) ± SEM. Mann–Whitney test, *p < 0.05 (n = 5 mice per group). E Representative pictures of wildtype and PARK7/DJ-1 KO BMDMs stained with phalloidin showing actin filaments with and without 6 h LPS (100 ng/mL) treatment (left) and corresponding quantification of compactness and eccentricity scores (right). Scale bar: 69 μm. Kruskal–Wallis test for multiple comparisons. ****p < 0.0001, ns: not significant (n = 3 mice per group). F Assessment of cytoplasmic and mitochondrial ROS by live imaging. Left: representative images showing labeling of ROS in red and mitochondria in green in BMDMs at baseline, after 6 h LPS and LPS-treatment overnight (OVN). Right: graphs show mean CellROX intensity in cytoplasm and mitochondria per field of view (dots). Kruskal–Wallis test with Dunn’s test for multiple comparisons. ****p < 0.0001, **p < 0.01. G Analysis of mitochondrial membrane potential using the specific marker TMRE. Upper panel: representative pictures showing mitochondrial membrane potential (in orange) and mitochondria (in green) in BMDMs at baseline and after overnight treatment with LPS (100 ng/mL). Bottom panel: graph shows mean intensity of TMRE per field of view (dots). Kruskal–Wallis test with Dunn’s test for multiple comparisons. ****p < 0.0001, **p < 0.01

References

    1. Amatullah H, Shan Y, Beauchamp BL, Gali PL, Gupta S, Maron-Gutierrez T, Speck ER, Fox-Robichaud AE, Tsang JL, Mei SH, Mak TW, Rocco PR, Semple JW, Zhang H, Hu P, Marshall JC, Stewart DJ, Harper ME, Liaw PC, Liles WC, Dos Santos CC, G. Canadian Critical Care Translational Biology DJ-1/PARK7 impairs bacterial clearance in sepsis. Am J Respir Crit Care Med. 2017;195(7):889–905. doi: 10.1164/rccm.201604-0730OC. - DOI - PubMed
    1. Baumuratov AS, Antony PM, Ostaszewski M, He F, Salamanca L, Antunes L, Weber J, Longhino L, Derkinderen P, Koopman WJ, Diederich NJ. Enteric neurons from Parkinson's disease patients display ex vivo aberrations in mitochondrial structure. Sci Rep. 2016;6:33117. doi: 10.1038/srep33117. - DOI - PMC - PubMed
    1. Bjorklund G, Peana M, Maes M, Dadar M, Severin B. The glutathione system in Parkinson's disease and its progression. Neurosci Biobehav Rev. 2021;120:470–478. doi: 10.1016/j.neubiorev.2020.10.004. - DOI - PubMed
    1. Bodea LG, Wang Y, Linnartz-Gerlach B, Kopatz J, Sinkkonen L, Musgrove R, Kaoma T, Muller A, Vallar L, Di Monte DA, Balling R, Neumann H. Neurodegeneration by activation of the microglial complement-phagosome pathway. J Neurosci. 2014;34(25):8546–8556. doi: 10.1523/JNEUROSCI.5002-13.2014. - DOI - PMC - PubMed
    1. Borsani G, Tonlorenzi R, Simmler MC, Dandolo L, Arnaud D, Capra V, Grompe M, Pizzuti A, Muzny D, Lawrence C, Willard HF, Avner P, Ballabio A. Characterization of a murine gene expressed from the inactive X chromosome. Nature. 1991;351(6324):325–329. doi: 10.1038/351325a0. - DOI - PubMed

MeSH terms