. 2024;44(8):316-333.
doi: 10.1080/10985549.2024.2376146. Epub 2024 Jul 16.

Transcription Factor 23 is an Essential Determinant of Murine Term Parturition

Affiliations

Transcription Factor 23 is an Essential Determinant of Murine Term Parturition

Fatma M Minisy et al. Mol Cell Biol. 2024.

Abstract

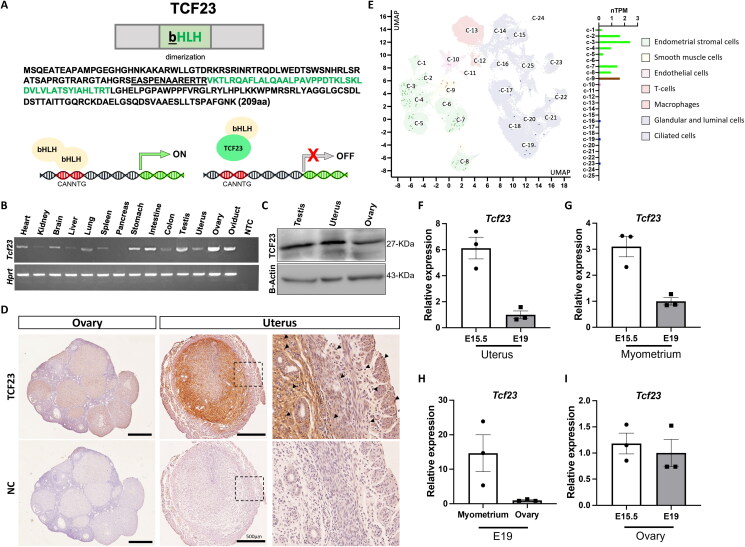
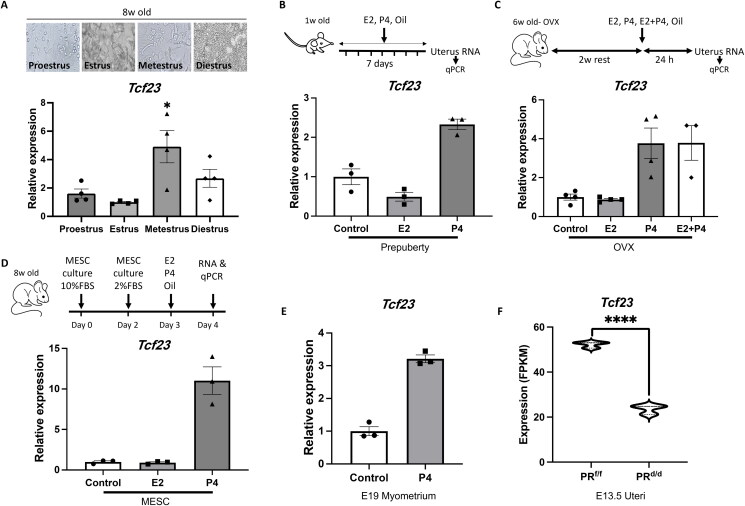
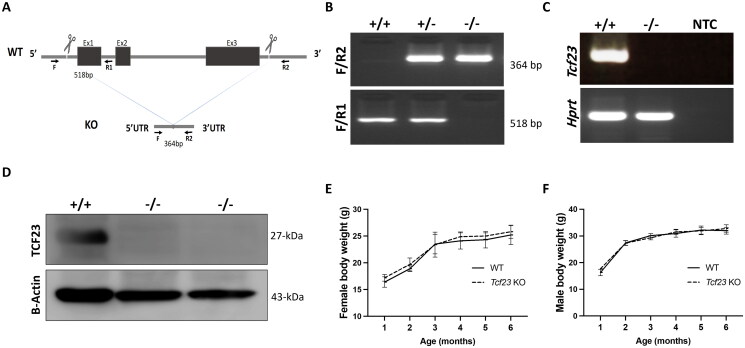
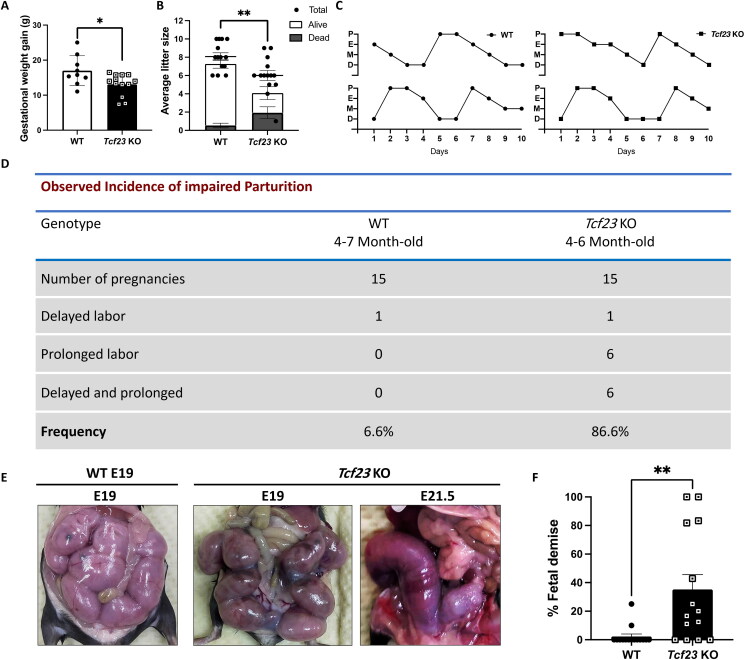
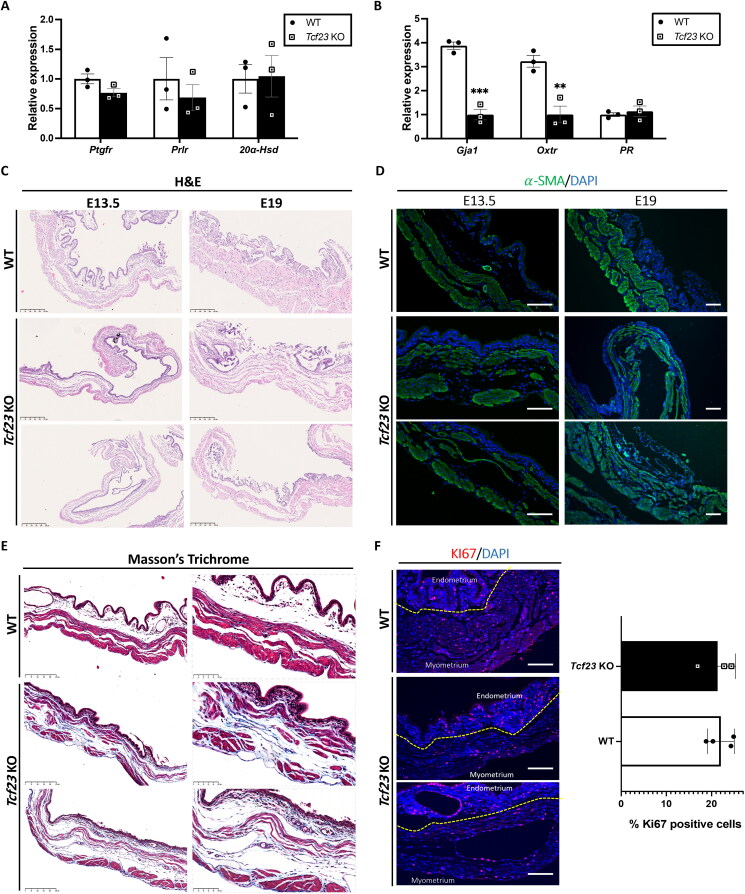
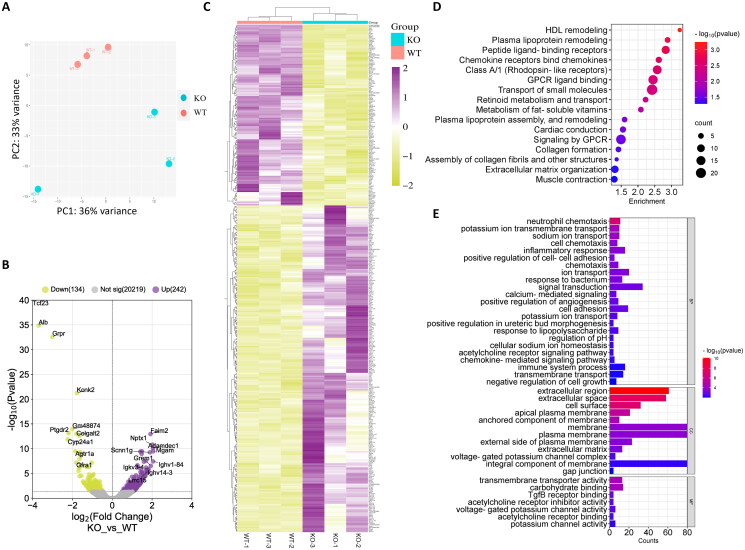
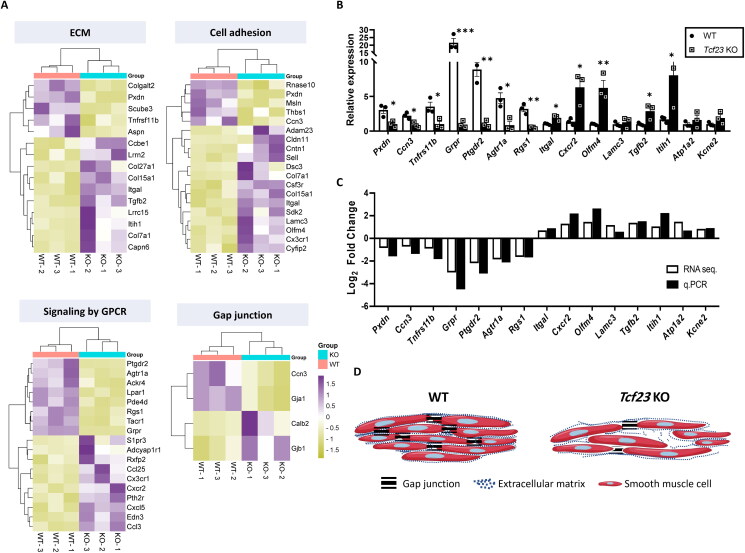
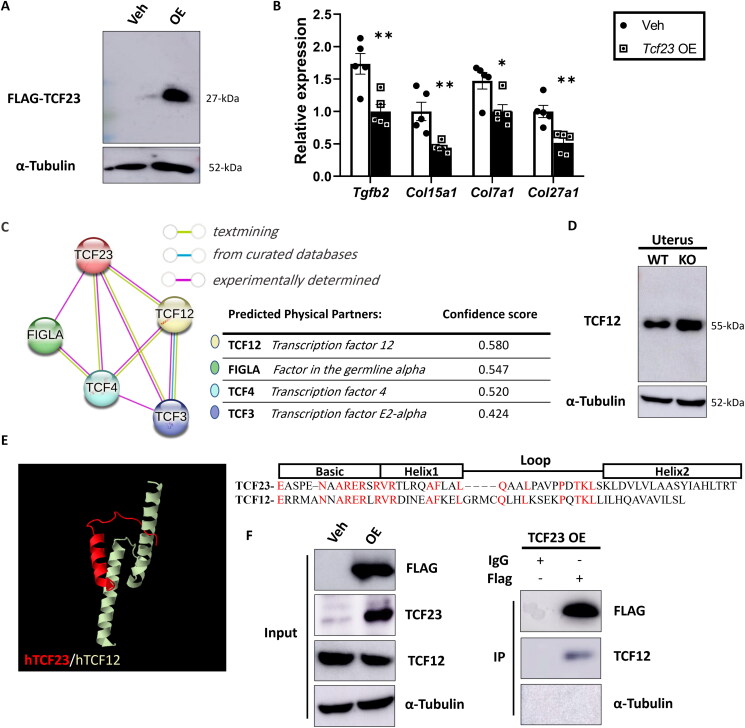
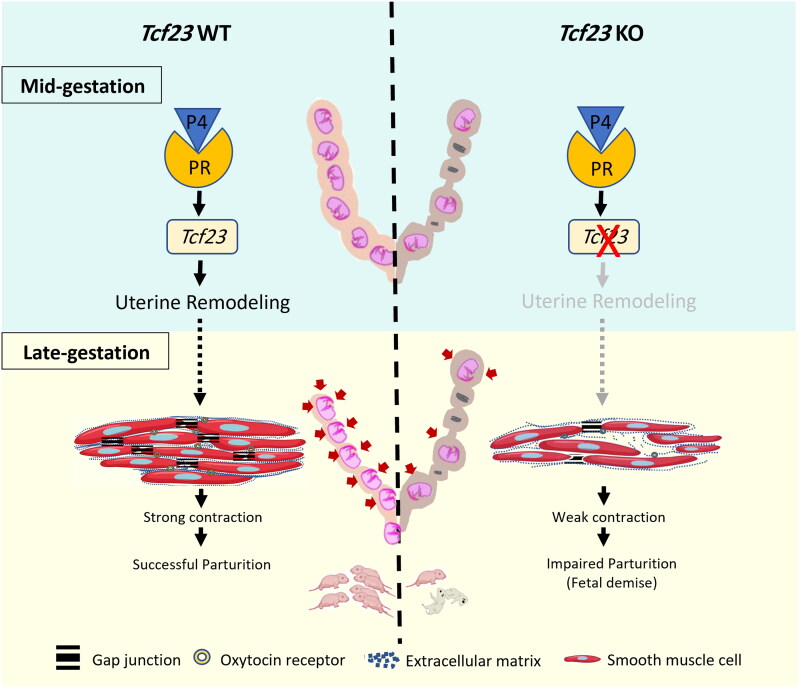
Pregnancy involving intricate tissue transformations governed by the progesterone hormone (P4). P4 signaling via P4 receptors (PRs) is vital for endometrial receptivity, decidualization, myometrial quiescence, and labor initiation. This study explored the role of TCF23 as a downstream target of PR during pregnancy. TCF23 was found to be expressed in female reproductive organs, predominantly in uterine stromal and smooth muscle cells. Tcf23 expression was high during midgestation and was specifically regulated by P4, but not estrogen. The Tcf23 knockout (KO) mouse was generated and analyzed. Female KO mice aged 4-6 months exhibited subfertility, reduced litter size, and defective parturition. Uterine histology revealed disrupted myometrial structure, altered collagen organization, and disarrayed smooth muscle sheets at the conceptus sites of KO mice. RNA-Seq analysis of KO myometrium revealed dysregulation of genes associated with cell adhesion and extracellular matrix organization. TCF23 potentially modulates TCF12 activity to mediate cell-cell adhesion and matrix modulation in smooth muscle cells. Overall, TCF23 deficiency leads to impaired myometrial remodeling, causing parturition delay and fetal demise. This study sheds light on the critical role of TCF23 as a dowstream mediator of PR in uterine remodeling, reflecting the importance of cell-cell communication and matrix dynamics in myometrial activation and parturition.

Keywords: TCF23; bHLH; dystocia; extracellular matrix; myometrium remodeling; parturition; progesterone; resorption; smooth muscle cells.


Conflict of interest statement

No potential conflict of interest was reported by the authors.

Figures

Figure 1.
Figure 1.
TCF23 expression pattern in female mouse tissues. (A) The domain structure and the amino acid sequences of mouse TCF23. The basic domain is indicated by underlined, while the HLH domain is highlighted in green. The diagram portrays the role of TCF23 as a negative bHLH transcription factor (TF). When TCF23 is present, it heterodimerizes with other bHLH TF, thereby obstructing their ability to bind to the CANNTG sequence on the target gene. bHLH; basic helix–loop–helix. (B) RT-PCR analysis of Tcf23 expression across different mouse tissues. Hprt was used as an internal control. The data represents one of two independent experiments. (C) Western blot analysis of TCF23 protein in the reproductive organs. kDa, kilodalton. The data represents one of three independent experiments. (D) Immunohistochemistry of TCF23 was conducted on mouse ovary and uterus sections. Hematoxylin was utilized to counterstain the tissues. NC; negative control. Scale bars, 500 μm. The data represents one of three independent experiments. (E) Expression data extracted and re-graphed from the single-cell RNA data available at https://www.proteinatlas.org/ENSG00000163792-TCF23/single+cell+type/endometrium. C, cluster. (F-I) qPCR analysis of Tcf23 expression in uterus, myometrium, and ovary during different stages of pregnancy. Hprt was used as an internal control. Data are presented as the mean ± SEM (n = 3); * < 0.05, **P < 0.01. E, embryonic day.
Figure 2.
Figure 2.
The impact of steroid hormones on Tcf23 expression in vivo and in vitro. qPCR was employed to assess Tcf23 expression across various conditions. (A) Expression was examined in the uterus of adult mice at the different stages of estrus (n = 4). Age is denoted in weeks (w). (B) Expression was investigated in the uterus of prepubertal mice following injection with a single dose of 8 ng/g b.w. of E2 (estrogen) or 50 μg/g b.w. of P4 (progesterone), (n = 3). (C) Expression was investigated in the uterus of ovariectomized mice after receiving a single dose of 8 ng/g b.w. of E2 or 50 μg/g b.w. of P4, or a combination of E2 and P4 (n ≥ 3). OVX; ovariectomized. (D) Expression was analyzed in mouse endometrial stroma cells (MESC) treated with 100 nM E2 or 10 μM P4, n = 3 in two independent experiments. (E) Expression was assessed in the myometrium of pregnant mice (10 weeks of age) injected with 2 mg of P4 for two days prior to isolation of RNA on E19 (n = 3). (F) Tcf23 expression was derived from previous RNA-Seq of uterus samples from E13.5 pregnant mice with progesterone receptor ablation in smooth muscle cells (PRd/d) by Wu et al. The results are normalized to Hprt and presented as the mean ± SEM. ANOVA multiple comparison applied to compare the mean of each treatment with the mean of control; *P < 0.05, **P < 0.01, ***P < 0.001, ****P < 0.0001.
Figure 3.
Figure 3.
Generation of Tcf23 KO mice. (A) The genomic structure of mouse Tcf23 gene, representing targeted exons for deletion. Arrows indicate the positions of forward and reverse primers used for genotyping PCR to amplify the wild-type (WT) and KO alleles. Bp, base pair. (B) PCR genotyping from mouse tail displays the genotypes of WT (+/+), heterozygous (+/-), and KO (-/-). The Tcf23 WT band amplifies at 518 bp, while the Tcf23 deletion band amplifies at 364 bp. (C) Uterine Tcf23 mRNA expression is assessed through RT-PCR and normalized to Hprt, revealing no expression in KO tissues. NTC; nontemplate control. The data represents one of three independent experiments. (D) Western blotting of TCF23 protein in both the control and Tcf23 KO uterus using anti-TCF23 antibody and anti-β-actin as an internal control. kDa, kilodaltons. The data represents one of three independent experiments. (E, F) Body weight measurements in grams (g) for KO mice and their WT littermates (n = 5). The measurements were taken on a monthly basis. Data is statistically analyzed using t test and presented as the mean ± SEM.
Figure 4.
Figure 4.
Fertility of TCF23-deficient female mice. (A) Gestational weight gain in grams (g) during pregnancy (n > 9 for each genotype). (B) Average litter size including alive or dead ones (n = 14). (C) Graphic representation of the respective estrous cyclicity in WT (n = 3) and Tcf23 KO mice (n = 5) demonstrating regular 5-day cycles in each group. P, proestrus, E, estrus, M, metestrus D, diestrus. (D) Incidence of parturition failure in Tcf23 KO mice, with the mice experiencing delayed parturition with labor onset beyond E19.5 and/or elongated parturition referring to dystocia longer than 6 h. Frequency; is the total rate of impaired parturition in each genotype. (E) Necropsy photographs show uteri with live embryos at E19 in Tcf23 KO mice and their WT littermates, but nonexpulsed dead embryos were observed 48 h after the onset of labor at E21.5 in Tcf23 KO mice. (F) Percentages of fetal demise collected as nondelivered embryos, those stuck in the uterus, or delivered dead due to prolonged labor (n = 14 for each genotype). Data were analyzed by t test (mean ± SEM); *P < 0.05, **P < 0.01.
Figure 5.
Figure 5.
Perturbed myometrial structural and extracellular matrix (ECM) in Tcf23 KO mice. (A) qPCR analysis of key luteolysis-related genes near term at E19 in ovarian tissues from WT and KO mice, normalized to Hprt (n = 3). (B) qPCR assessment of contraction genes (Gja1, Oxtr) and progesterone receptor (PR) expression in the WT and KO myometrium at E19, normalized to Hprt (n = 3). (C) Histological evaluation of uteri using hematoxylin and eosin staining at E13.5 and E19 uteri (n = 3). Scale bars =250 μm. (D) Immunofluorescence staining for smooth muscle actin (α-SMA) conducted on uteri at E13.5 and E19 (n = 3). Scale bars =100 μm. (E) Masson’s trichrome staining for collagen deposition at E13.5 uteri (n = 3). Left panels: low-magnification (scale bars = 250 μm), right panel: high-magnification (scale bars = 100 μm). (F) Immunofluorescence staining for the cell proliferation marker Ki67 performed on E13.5 uteri, with a scale bars of 100 μm (left panel). Quantitative analysis of Ki67 was conducted by counting Ki67-positive cells divided on the total number of nuclei in ten random fields per mouse (n > 3); The mean percentage of positive cells was presented (right panel). For bar graphs, mean ± SEM are shown; *P < 0.05, **P < 0.01, ***P < 0.001.
Figure 6.
Figure 6.
The transcriptome profile of the Tcf23 KO myometrium at late gestation. (A) Principal Component Analysis (PCA) for WT and KO myometrium. Triplicate WT samples are indicated by red dots, while KO samples are represented by blue dots. (B) Volcano plot profiles illustrating the Differentially Expressed Genes (DEGs) of Tcf23 KO vs WT myometrium. The horizontal dashed line indicates a significance threshold of adjusted P < 0.05. The top 10 downregulated and upregulated genes are highlighted on the plot. (C) Heatmap displaying Pearson correlations among RNA-Seq samples, normalized based on their total counts. Clustering was achieved using average linkage. Each column corresponds to a specific sample, while each row represents a particular gene. (D) Bubble diagram depicting significantly enriched REACTOME pathways for DEGs. The x-axis represents the statistical significance of enrichment P < 0.05. (E) Bar diagram representing clusters of Gene Ontology (GO) terms of DEGs, sorted by P < 0.01 and the enrichment gene count >3. The GO terms are categorized into Biological Process (BP), Cellular Component (CC), and Molecular Function (MF).
Figure 7.
Figure 7.
Dysregulated genes in the Tcf23 KO myometrium involved in myometrial remodeling and contractility. (A) Heatmaps displaying dysregulated genes enriched for myometrium remodeling and contractility in the Tcf23 KO myometrium. Pearson’s correlation was used for RNA-Seq samples, normalized based on their total counts. Clustering was achieved using average linkage. Each column corresponds to a specific sample, while each row represents a particular gene. (B) Validation of selected DEGs through qPCR (n = 3). Samples were normalized to Hprt and results are presented as the mean ± SEM; *P < 0.05, **P < 0.01, ***P < 0.001. (C) Log2 fold-change obtained from qPCR was plotted beside those obtained by RNA-Seq analysis. (D) Schematic summary of the Tcf23 KO phenotype, illustrating smooth muscle cells and matrix disorganization.
Figure 8.
Figure 8.
Potential mediation of ECM disorganization in Tcf23 KO Myometrium by TCF12. (A) Mouse smooth muscle cells, transfected with either empty vector (veh) or FLAG-tagged hTCF23 overexpression plasmid (OE) for 24 h, underwent Western blotting with anti-FLAG and anti-α-tubulin antibodies. The data represents one of three independent experiments. (B) qPCR analysis of the ECM mediator gene Tgfb2 and collagen genes in TCF23-overexpressing cells (n = 5). The results are normalized to Hprt and presented as the mean ± SEM; *P < 0.05, **P < 0.01. (C) In silico protein-protein interaction analysis demonstrated the network of human TCF23 with bHLH TF via String Interaction Analysis (https://string-db.org/). Nodes represent proteins, and lines depict interactions (left panel); confidence scores are shown (right panel). (D) Western blotting of TCF12 in nonpregnant uteri from WT and Tcf23 KO, with α-tubulin as an internal control. The data represent one of two independent experiments. (E) Protein interaction between human TCF23/TCF12 was analyzed using PEPPI (https://zhanggroup.org/PEPPI/). The predicted interaction of the chains is indicated by a log (LR) value of 2.107 (left panel). The right panel displays the amino acid sequence alignment of the bHLH domains of class I proteins TCF23 and TCF12, with conserved amino acids highlighted in red. (F) Immunoprecipitation assay for detecting the interaction between hTCF23 and hTCF12 proteins. HEK 293 T cells were transfected either with an empty vector (veh) or with a plasmid expressing FLAG-tagged hTCF23 protein (OE) (left panel). After 48 h, proteins were extracted and subjected to immunoprecipitation using an anti-FLAG antibody or rabbit IgG. Subsequent immunoblotting was conducted with anti-FLAG, anti-TCF12, and anti-α-tubulin antibodies (right panel). kDa, kilodaltons. Consistent results were observed in two independent experiments.
Figure 9.
Figure 9.
A schematic diagram illustrates the essential role of TCF23, transactivated by P4 and its receptors, in facilitating uterine remodeling crucial for successful female parturition.

Similar articles

References

    1. Wang H, Dey SK.. Roadmap to embryo implantation: clues from mouse models. Nat Rev Genet. 2006;7:185–199. doi: 10.1038/nrg1808. - DOI - PubMed
    1. Lydon JP, DeMayo FJ, Funk CR, Mani SK, Hughes AR, Montgomery CA, Shyamala G, Conneely OM, O'Malley BW.. Mice lacking progesterone receptor exhibit pleiotropic reproductive abnormalities. Genes Dev. 1995;9:2266–2278. doi: 10.1101/gad.9.18.2266. - DOI - PubMed
    1. Tan J, Paria BC, Dey SK, Das SK.. Differential uterine expression of estrogen and progesterone receptors correlates with uterine preparation for implantation and decidualization in the mouse. Endocrinology. 1999;140:5310–5321. doi: 10.1210/endo.140.11.7148. - DOI - PMC - PubMed
    1. Hirota Y. Progesterone governs endometrial proliferation-differentiation switching and blastocyst implantation. Endocr J. 2019;66:199–206. doi: 10.1507/endocrj.EJ18-0431. - DOI - PubMed
    1. Haraguchi H, Saito-Fujita T, Hirota Y, Egashira M, Matsumoto L, Matsuo M, Hiraoka T, Koga K, Yamauchi N, Fukayama M, et al. MicroRNA-200a locally attenuates progesterone signaling in the cervix, preventing embryo implantation. Mol Endocrinol. 2014;28:1108–1117. doi: 10.1210/me.2014-1097. - DOI - PMC - PubMed

Publication types