. 2024 Jun 12;4(4):oeae046.
doi: 10.1093/ehjopen/oeae046. eCollection 2024 Jul.

Myeloid cell-derived interleukin-6 induces vascular dysfunction and vascular and systemic inflammation

Affiliations

Myeloid cell-derived interleukin-6 induces vascular dysfunction and vascular and systemic inflammation

Tanja Knopp et al. Eur Heart J Open. .

Abstract

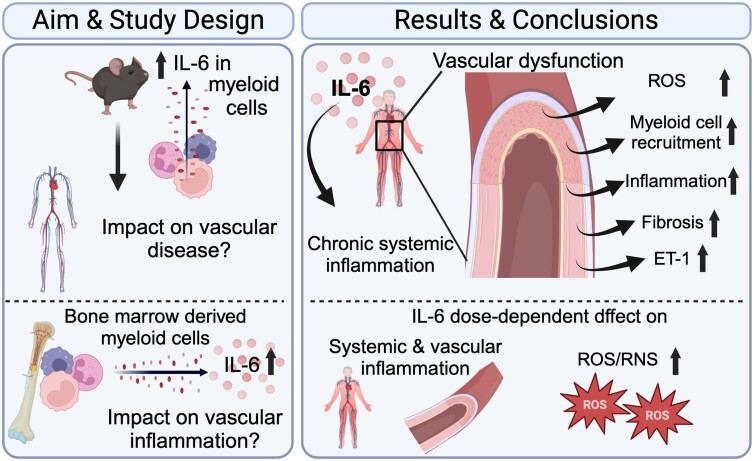
Aims: The cytokine interleukin-6 (IL-6) plays a central role in the inflammation cascade as well as cardiovascular disease progression. Since myeloid cells are a primary source of IL-6 formation, we aimed to generate a mouse model to study the role of myeloid cell-derived IL-6 in vascular disease.

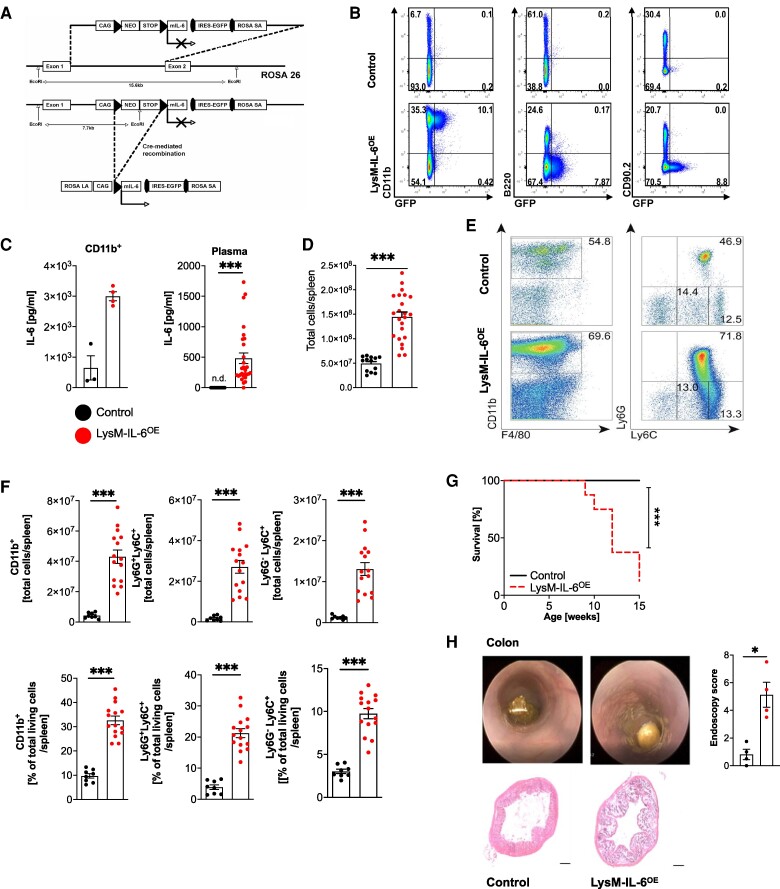
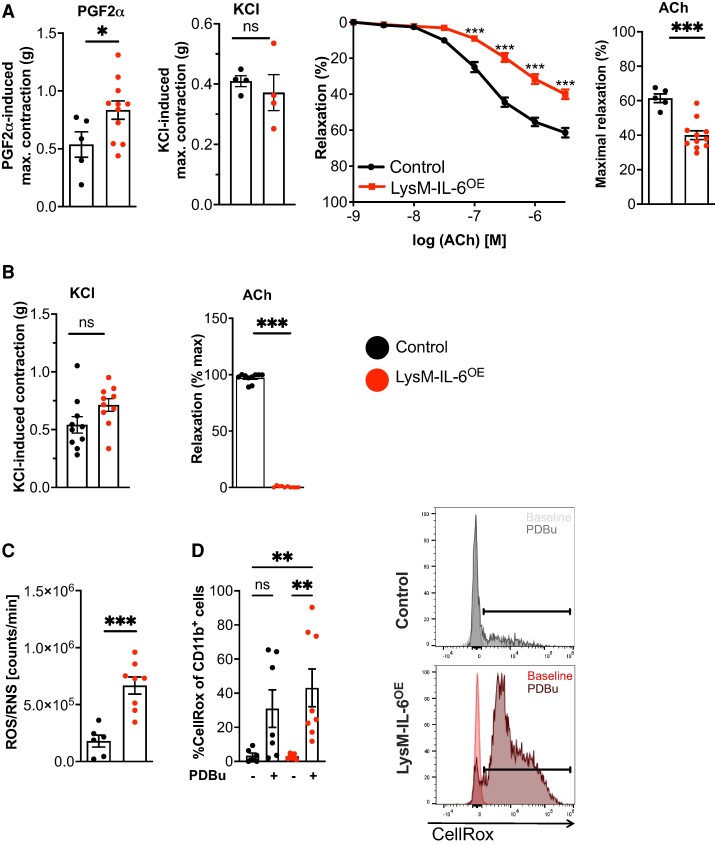
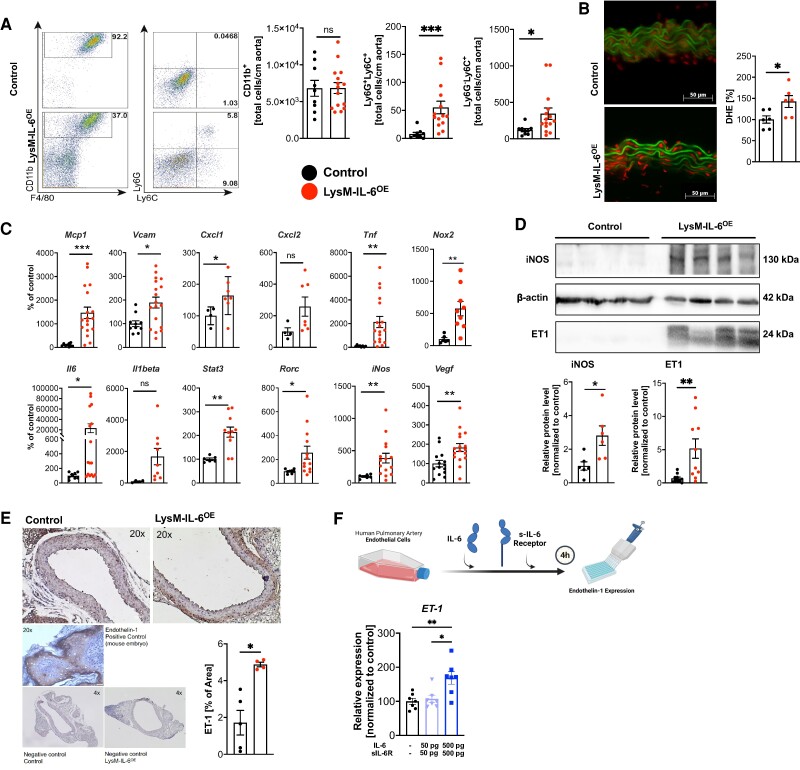
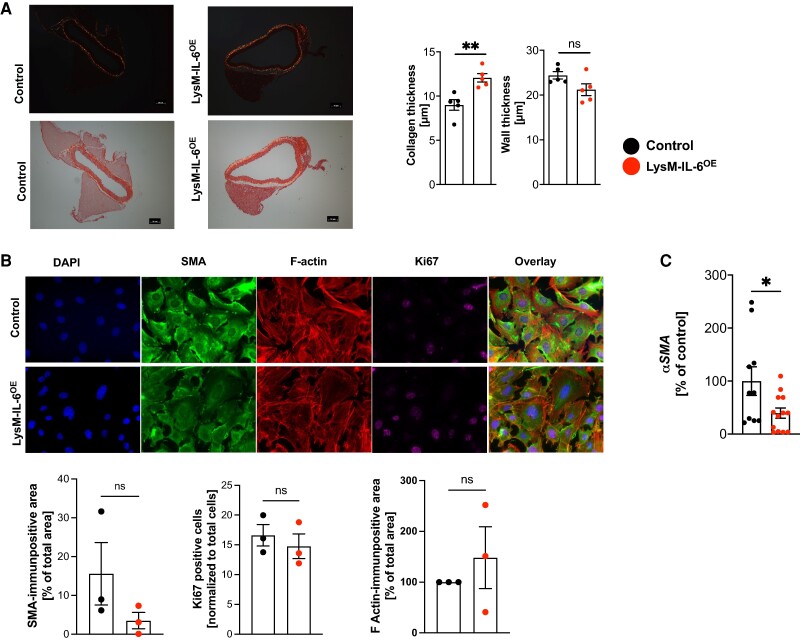
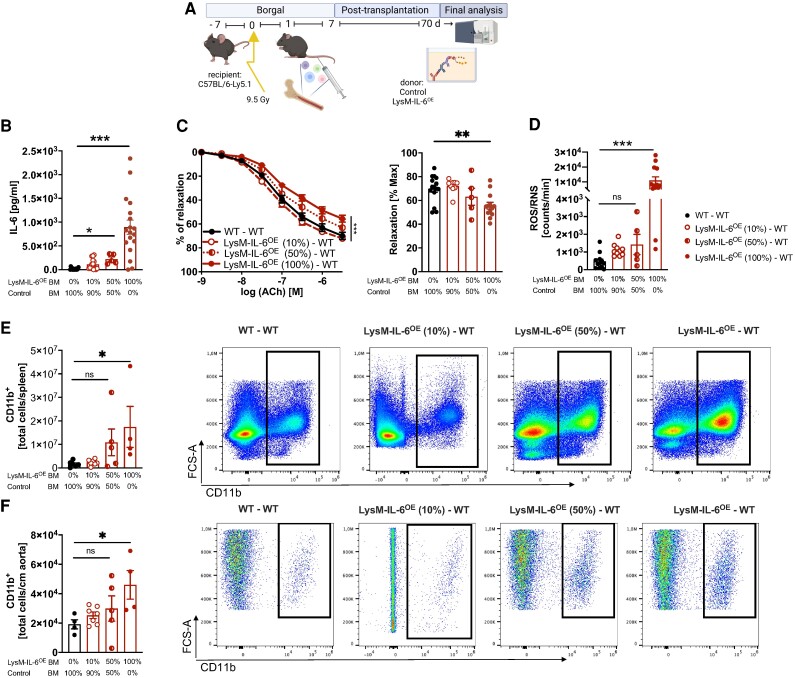
Methods and results: Interleukin-6-overexpressing (IL-6OE) mice were generated and crossed with LysM-Cre mice, to generate mice (LysM-IL-6OE mice) overexpressing the cytokine in myeloid cells. Eight- to 12-week-old LysM-IL-6OE mice spontaneously developed inflammatory colitis and significantly impaired endothelium-dependent aortic relaxation, increased aortic reactive oxygen species (ROS) formation, and vascular dysfunction in resistance vessels. The latter phenotype was associated with decreased survival. Vascular dysfunction was accompanied by a significant accumulation of neutrophils, monocytes, and macrophages in the aorta, increased myeloid cell reactivity (elevated ROS production), and vascular fibrosis associated with phenotypic changes in vascular smooth muscle cells. In addition to elevated Mcp1 and Cxcl1 mRNA levels, aortae from LysM-IL-6OE mice expressed higher levels of inducible NO synthase and endothelin-1, thus partially accounting for vascular dysfunction, whereas systemic blood pressure alterations were not observed. Bone marrow (BM) transplantation experiments revealed that vascular dysfunction and ROS formation were driven by BM cell-derived IL-6 in a dose-dependent manner.

Conclusion: Mice with conditional overexpression of IL-6 in myeloid cells show systemic and vascular inflammation as well as endothelial dysfunction. A decrease in circulating IL-6 levels by replacing IL-6-producing myeloid cells in the BM improved vascular dysfunction in this model, underpinning the relevant role of IL-6 in vascular disease.

Keywords: Chronic inflammation; Endothelin-1; Interleukin-6; Myeloid cells; Vascular dysfunction.


Conflict of interest statement

Conflict of interest: M.B. received funding and is a consultant for ARCA Biopharma (not related to the presented work). S.K. received funding for consultant lectures from Almiral and Jansson-Cilag (not related to the presented work either).

Figures

Graphical Abstract
Graphical Abstract
Myeloid cell-derived interleukin-6 (IL-6) overexpression was associated with systemic inflammation. Chronic myeloid cell-derived IL-6 evoked a significantly impaired endothelium-dependent aortic relaxation, increased aortic reactive oxygen species (ROS), and vascular dysfunction in resistance vessels. Vascular dysfunction was accompanied by a significant accumulation of myeloid cells in the aortic wall, an increased reactivity of myeloid cells, vascular fibrosis, and an altered vascular smooth muscle cell phenotype. This went in line with significantly elevated Mcp1, Cxcl1, and Rorc levels and an increased inducible NO synthase and endothelin-1 expression in LysM-IL-6OE aortas. Bone marrow (BM) transplantation studies revealed that vascular dysfunction and ROS formation were driven by BM cell-derived IL-6 in a dose-dependent manner.
Figure 1
Figure 1
Mice overexpressing interleukin-6 in myeloid cells have an increase in the splenic myeloid cell compartment and a reduced life expectancy. (A) Generation of the IL-6OE allele involved homologous recombination in embryonic stem cells (V6.5). The conditional ‘knock-in’ approach targeted the endogenous gt(ROSA)26Sor locus, introducing a lox-P-flanked transcriptional STOP cassette. Upon Cre-mediated recombination, the cassette was excised, enabling dual expression of interleukin-6 and enhanced green fluorescent protein under the control of the chicken β-actin (CAG) promotor. (B) Flow cytometric analysis of splenocytes from LysM-IL-6OE and control mice. Cells were stained for CD11b, B220, and CD90.2 with gating based on green fluorescent protein signal. Representative plots of n = 4 mice are shown. (C) Interleukin-6 levels in splenocytes and plasma. Left panel: interleukin-6 level in sorted and cultured CD11b+ splenocytes of LysM-IL-6OE mice and control mice. Splenocytes were cultured for 24 h. n = 3–4, Mann–Whitney test. Right panel: interleukin-6 plasma levels in 10-week-old LysM-IL-6OE compared with control mice (n.d. = not detectable). n = 19–28, Mann–Whitney test. P < 0.0001. (D) Statistical analysis of the total living cells per spleen of LysM-IL-6OE and control mice is shown (result of flow cytometric analysis), n = 13–23, Mann–Whitney test. P < 0.0001. (E) Flow cytometric analysis of LysM-IL-6OE and control mice splenocyte subpopulations: after gating out B220+ and CD90.2+ cells, analysis focused on CD11b, F4/80, Ly6C, and Ly6G. Representative plots of n = 8–15 mice are shown. (F) Statistical analysis of the splenic CD11b+ myeloid cells, the Ly6G + Ly6C+ neutrophils, and the Ly6GLy6C+ monocytes/macrophages of LysM-IL-6OE and control mice of the flow cytometric experiment above, n = 8–15 mice. Top row: total cells. Bottom row: percentage values of the total living cells, unpaired Student’s t-test. P < 0.0001. (G) Kaplan–Meier survival curve of LysM-IL-6OE vs. control mice, n = 8–16 mice, log-rank (Mantel–Cox) test. (H) Representative image of colon endoscopy (left). Statistical analysis of endoscopy score (right), n = 4, Mann–Whitney test. Bottom part: representative haematoxylin and eosin stainings of the colon of LysM-IL-6OE and control mice. Data are presented as mean ± SEM, and P values of <0.05 were considered significant and marked by asterisks (*P < 0.05; **P < 0.01; ***P < 0.001).
Figure 2
Figure 2
Interleukin-6 overexpression in myeloid cells evokes significant vascular dysfunction, increased oxidative stress formation, and an increased reactivity of myeloid cells. (A) Aortic constriction studies. Left panel: aortic constriction in response to prostaglandin F2α and potassium chloride, analysed by unpaired Student’s t-test. Middle panel: isometric tension studies of LysM-IL-6OE and control aortas in response to acetylcholine, analysed by two-way ANOVA with Bonferroni’s multiple comparisons. Right panel: statistical analysis of acetylcholine -induced maximal relaxation with unpaired Student’s t-test. n = 5–11 mice. P = 0.0499 (prostaglandin F2α), P = 0.0002 (maximal relaxation acetylcholine). (B) Mesenteric artery contraction and relaxation. Left panel: contraction of mesenteric arteries in response to potassium chloride in LysM-IL-6OE and control mice, analysed by unpaired Student’s t-test. Right panel: relaxation to acetylcholine of mesenteric arteries that have been precontracted with phenylephrine, Mann–Whitney test, n = 8. P < 0.0001 (maximal relaxation acetylcholine). (C) Reactive oxygen species/reactive nitrogen species levels in whole blood after 20 min stimulation with phorbol 12,13-dibutyrate in LysM-IL-6OE vs. controls, n = 6–8, unpaired Student’s t-test. P = 0.003. (D) Flow cytometric analysis of reactive oxygen species levels detected by CellRox Deep Red staining in CD11b+ myeloid cells in blood of LysM-IL-6OE mice compared with controls with and without phorbol 12,13-dibutyrate stimulation. Pre-gating on living and CD45.2+ cells. Kruskal–Wallis test with Dunn’s multiple comparison test. Quantification left panel: representative flow cytometry histograms; right panel. n = 7–8 mice. P = 0.0045 (control vs. LysM-IL-6OE + phorbol 12,13-dibutyrate), P = 0.0035 (LysM-IL-6OE vs. LysM-IL-6OE + phorbol 12,13-dibutyrate). Data are presented as mean ± SEM, and P values of <0.05 were considered significant and marked by asterisks (*P < 0.05; **P < 0.01; ***P < 0.001).
Figure 3
Figure 3
Interleukin-6-induced vascular dysfunction is based on vascular inflammation combined with an increased endothelin-1 and inducible NO synthase expression. (A) Myeloid cell infiltration in aortas. Representative flow cytometry plots and statistical analysis of myeloid surface staining of aortas from LysM-IL-6OE mice compared with controls and quantification of aortic myeloid cell staining. Pre-gating on living, CD45.2+, and CD11b+ cells. Neutrophils and monocytes were further gated on Ly6G and Ly6C, n = 9–15 mice, either unpaired Student’s t-test or Mann–Whitney test. P = 0.001 (CD11b+ Ly6G+) and P = 0.0101 (CD11b+ Ly6G+). (B) Vascular superoxide formation oxidative fluorescence microtopography of aortic sections. Left: representative image of aortic sections showing lamina autofluorescence (green) and reactive oxygen species formation (red), scale bar = 50 µm. Right: densitometric analysis of vascular superoxide, normalized to control mice per experimental day. n = 6, unpaired Student’s t-test. P = 0.0275. (C) Mcp1 (P < 0.001), Vcam1 (P = 0.01), Cxcl1 (P = 0.0), Cxcl2 (ns), Tnf (P  =  0.009), Nox2 (P = 0.005), Il6 (P  =  0.01), Il1β (ns), Stat3 (P = 0.002), Rorc (P = 0.02), iNOS (P = 0.005), and Vegf-a (P = 0.005) expression in the aorta of LysM-IL-6OE normalized to control mice. Housekeeping gene: Tbp. n = 5–19, Mann–Whitney test or unpaired Student’s t-test. (D) Representative Western blot and statistical analyses for inducible NO synthase and endothelin-1 normalized to β-actin, n = 6–10, unpaired Student’s t-test. P = 0.0167 (inducible NO synthase) and P = 0.0071 (endothelin-1). (E) Immunohistochemical analysis of endothelin-1 in aortic sections. Left: representative images of endothelin-1 staining of aortic sections with positive and negative controls, scale bar = 50 µm. Right: quantification of the percentage of endothelin-1-positive area. The fatty tissue was excluded. n = 5–4, Mann–Whitney test. P = 0.02. (F) Endothelin-1 expression of human pulmonary arterial endothelial cell co-cultured with IL-6 and sIL-6R for 4 h (quantitative real-time PCR). n = 7, one-way ANOVA test. P = 0.045 (human pulmonary arterial endothelial cell vs. human pulmonary arterial endothelial cell co-cultured with IL-6 and sIL-6R 500pg) and P = 0.0102 (human pulmonary arterial endothelial cell co-cultured with interleukin-6 and sIL-6R 50pg vs. 500pg). Data are presented as mean ± SEM, and P values of <0.05 were considered significant and marked by asterisks (*P < 0.05; **P < 0.01; ***P < 0.001).
Figure 4
Figure 4
Interleukin-6-induced vascular dysfunction is associated with an altered vascular smooth muscle cell phenotype and fibrosis formation. (A) Collagen deposition in aortic sections. Sirius Red staining of aortic sections. Left: representative image of aortic sections (images without polarized light are shown below), scale bar = 50 µm. Right: aortic wall thickness and collagen thickness measurement at 10 different points/section with ImageJ software, n = 5, unpaired Student’s t-test. P = 0.0079 (collagen thickness). (B) Immunocytochemical analysis of vascular smooth muscle cell phenotype. Vascular smooth muscle cells were isolated from LysM-IL-6OE mice and control mice and cultured. Cultured vascular smooth muscle cell were stained with smooth muscle alpha-actin, F-actin, Ki67, and DAPI (60×). Representative images are shown in the top row. Quantification is shown in the bottom row. n = 3 mice per group of two independent experiments. Single images of three biological replicates per mouse were analysed, and the mean values each mouse were compared, unpaired Student’s t-test. (C) Quantitative real-time PCR analysis for alpha SMA in LysM-IL-6OE mice aortas (red) vs. control aortas. Housekeeping gene: Gapdh. n = 10–12 mice per group, unpaired Student’s t-test. P = 0.03. Data are presented as mean ± SEM, and P values of <0.05 were considered significant and marked by asterisks (*P < 0.05; **P < 0.01; ***P < 0.001).
Figure 5
Figure 5
Bone marrow and blood interleukin-6 levels correlate with systemic and vascular inflammation and dysfunction. (A) Experimental approach of bone marrow transplantation. Schematic representation of the experimental design: different ratios of bone marrow isolated from LysM-IL-6OE mice mixed with bone marrow from control mice (100, 50, and 10%) were transplanted into C57BL6-Ly5.1 mice. The transplantation scenarios included wild-type bone marrow → wild type (black circles), 100% LysM-IL-6OE bone marrow → wild type (red circles completely filled with red colour), and mixed bone marrow consisting of 50% LysM-IL-6OE/50% wild type → wild type (half red circles) or 10% LysM-IL-6OE/90% wild type → wild type (red unfilled circles). Final analysis was conducted 70 days after bone marrow transfer. (B) Interleukin-6 levels in serum were measured by ELISA and Bioplex analysis in the bone marrow chimeric mice. n = 12–13, Kruskal–Wallis test with comparison of the mean of each column to the 100% control bone marrow column. P = 0.0245 (100% control bone marrow vs. 50% LysM-IL-6OE bone marrow) and P < 0.0001 (100% control bone marrow vs. 100% LysM-IL-6OE bone marrow). (C) Left: isometric tension studies of isolated aortic rings of bone marrow chimeric mice in response to acetylcholine. n = 5–16 mice/group, two-way ANOVA, Bonferroni’s multiple comparison. P < 0.0001 (comparison of the endpoint of the aortic relaxation curves of 100% control bone marrow vs. 100% LysM-IL-6OE bone marrow). Right: comparison of the maximal relaxation of the aortic relaxation curves in response to acetylcholine shown on the left-hand side. P = 0.003 (comparison of the maximum relaxation of the aortic relaxation curves of 100% control bone marrow vs. 100% LysM-IL-6OE bone marrow). (D) Reactive oxygen species/reactive nitrogen species measurement in blood after 20 min stimulation with phorbol 12,13-dibutyrate in bone marrow chimeric mice, n = 5–14, Kruskal–Wallis test with comparison of the mean of each column to the 100% control bone marrow column. P < 0.001 (100% control bone marrow vs. 100% LysM-IL-6OE bone marrow). (E) Flow cytometric analysis of the CD11b+ cells in the spleen of bone marrow chimeric mice. n = 4–7 mice/group, Kruskal–Wallis test with comparison of the mean of each column to the 100% control bone marrow column. P = 0.0134 (100% control bone marrow vs. 100% LysM-IL-6OE bone marrow). (F) Flow cytometric analysis of the CD11b+ cells in the aorta of bone marrow chimeric mice. n = 4–7 mice/group, Kruskal–Wallis test with comparison of the mean of each column to the 100% control bone marrow column. P = 0.0215 (100% control bone marrow vs. 100% LysM-IL-6OE bone marrow). Data are presented as mean ± SEM, and P values of <0.05 were considered significant and marked by asterisks (*P < 0.05; **P < 0.01; ***P < 0.001).

References

    1. Fanola CL, Morrow DA, Cannon CP, Jarolim P, Lukas MA, Bode C, Hochman JS, Goodrich EL, Braunwald E, O'Donoghue ML. Interleukin-6 and the risk of adverse outcomes in patients after an acute coronary syndrome: observations from the SOLID-TIMI 52 (stabilization of plaque using darapladib-thrombolysis in myocardial infarction 52) trial. J Am Heart Assoc 2017;6:e005637. - PMC - PubMed
    1. Gager GM, Biesinger B, Hofer F, Winter MP, Hengstenberg C, Jilma B, Eyileten C, Postula M, Lang IM, Siller-Matula JM. Interleukin-6 level is a powerful predictor of long-term cardiovascular mortality in patients with acute coronary syndrome. Vascul Pharmacol 2020;135:106806. - PubMed
    1. Markousis-Mavrogenis G, Tromp J, Ouwerkerk W, Devalaraja M, Anker SD, Cleland JG, Dickstein K, Filippatos GS, van der Harst P, Lang CC, Metra M, Ng LL, Ponikowski P, Samani NJ, Zannad F, Zwinderman AH, Hillege HL, van Veldhuisen DJ, Kakkar R, Voors AA, van der Meer P. The clinical significance of interleukin-6 in heart failure: results from the BIOSTAT-CHF study. Eur J Heart Fail 2019;21:965–973. - PubMed
    1. Wainstein MV, Mossmann M, Araujo GN, Goncalves SC, Gravina GL, Sangalli M, Veadrigo F, Matte R, Reich R, Costa FG, Andrades M, da Silva AMV, Bertoluci MC. Elevated serum interleukin-6 is predictive of coronary artery disease in intermediate risk overweight patients referred for coronary angiography. Diabetol Metab Syndr 2017;9:67. - PMC - PubMed
    1. Held C, White HD, Stewart RAH, Budaj A, Cannon CP, Hochman JS, Koenig W, Siegbahn A, Steg PG, Soffer J, Weaver WD, Östlund O, Wallentin L; STABILITY Investigators . Inflammatory biomarkers interleukin-6 and C-reactive protein and outcomes in stable coronary heart disease: experiences from the STABILITY (stabilization of atherosclerotic plaque by initiation of darapladib therapy) trial. J Am Heart Assoc 2017;6:e005077. - PMC - PubMed

LinkOut - more resources