. 2024 Jul 15;14(7):e70002.
doi: 10.1002/ece3.70002. eCollection 2024 Jul.

Scaling relationships between the total number of leaves and the total leaf area per culm of two dwarf bamboo species

Affiliations

Scaling relationships between the total number of leaves and the total leaf area per culm of two dwarf bamboo species

Chengkang Wang et al. Ecol Evol. .

Abstract

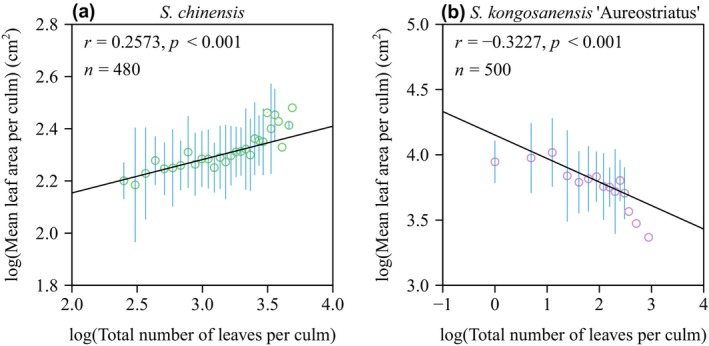
Total leaf area per plant is an important measure of the photosynthetic capacity of an individual plant that together with plant density drives the canopy leaf area index, that is, the total leaf area per unit ground area. Because the total number of leaves per plant (or per shoot) varies among conspecifics and among mixed species communities, this variation can affect the total leaf area per plant and per canopy but has been little studied. Previous studies have shown a strong linear relationship between the total leaf area per plant (or per shoot) (A T) and the total number of leaves per plant (or per shoot) (N T) on a log-log scale for several growth forms. However, little is known whether such a scaling relationship also holds true for bamboos, which are a group of Poaceae plants with great ecological and economic importance in tropical, subtropical, and warm temperate regions. To test whether the scaling relationship holds true in bamboos, two dwarf bamboo species (Shibataea chinensis Nakai and Sasaella kongosanensis 'Aureostriatus') with a limited but large number of leaves per culm were examined. For the two species, the leaves from 480 and 500 culms, respectively, were sampled and A T was calculated by summing the areas of individual leaves per culm. Linear regression and correlation analyses reconfirmed that there was a significant log-log linear relationship between A T and N T for each species. For S. chinensis, the exponent of the A T versus N T scaling relationship was greater than unity, whereas that of S. kongosanensis 'Aureostriatus' was smaller than unity. The coefficient of variation in individual leaf area increased with increasing N T for each species. The data reconfirm that there is a strong positive power-law relationship between A T and N T for each of the two species, which may reflect adaptations of plants in response to intra- and inter-specific competition for light.

Keywords: Montgomery equation; coefficient of variation; foliage length‐times‐width equation; landscape plant; power‐law function; scaling theory; self‐shading.


Conflict of interest statement

The authors declare that the research was conducted in the absence of any commercial or financial relationships that could be construed as a potential conflict of interest.

Figures

FIGURE 1
FIGURE 1
Representative examples and schematics of the culms of Shibataea chinensis Nakai (left) and Sasaella kongosanensis ‘Aureostriatus’ (right).
FIGURE 2
FIGURE 2
The log–log bivariate relationship between estimates of leaf area using the Montgomery equation based on LW and empirically determined leaf area. The small open circles represent the observations of log(A) versus log(LW); the straight line is the regression line; RMSE is the root‐mean‐square error; r 2 is the coefficient of determination; n is the total number of leaves (the sample size).
FIGURE 3
FIGURE 3
The histograms of total leaf area, and the total number of leaves per culm for S. chinensis (a, b) and S. kongosanensis ‘Aureostriatus’ (c, d).
FIGURE 4
FIGURE 4
The boxplots of the logarithms of total leaf area (a), mean leaf area (b), mean ratio of leaf width to length (c), and the total number of leaves per culm (d) for the two dwarf bamboo species. The labels of “Sc” and “SkA” on the x‐axis represent S. chinensis and S. kongosanensis ‘Aureostriatus’, respectively. Lowercase letters within each boxplot indicate the significance of mean differences based on the t‐test. Different letters represent significant differences (p < .05), and the percentages below the letters indicate the coefficients of variation (%). The horizontal solid lines in the boxplot represent the median values, while the red asterisks represent the mean values.
FIGURE 5
FIGURE 5
Fitted results for total leaf area per culm versus the total number of leaves per culm plotted on a log–log scale (a, c), and for the coefficient of variation in the individual leaf lamina area among different leaves per culm versus the total number of leaves per culm (b, d). The small red open circles are observations; the vertical blue segments through the small open circles are the standard errors; the straight line is the line regression line. In panels (a) and (c), y is the logarithm of the total leaf area per culm; x is the logarithm of the total number of leaves per culm; r 2 is the coefficient of determination; n is the sample size, that is, the number of culms used for each species. In panels (b) and (d), r is the correlation coefficient; p is the p‐value of the correlation test; n is the number of culms used for each species.
FIGURE 6
FIGURE 6
Fitted results for the mean leaf area per culm versus the total number of leaves per culm on a log–log scale for two bamboo specie, S. chinensis (a) and S. kongosanensis ‘Aureostriatus’ (b). The small red open circles are observations; the vertical blue segments through the small open circles are the standard error; the straight line is the line regression line; r is the correlation coefficient; p is the p‐value of the correlation test; n is the number of culms used for each species.
FIGURE 7
FIGURE 7
Fitted results for the total leaf area per culm (A T) versus the product of foliage length (L f) and foliage width (W f) per culm plotted on a log–log scale (a,c), and for the total leaf area per culm (A T) versus the product of the total number of the leaves (N T) and maximum individual leaf area (A max) per culm plotted on a log–log scale (b,d). In each panel, CI represents the 95% confidence interval of the slope; the small open circles are observations; the straight line is the line regression line. r 2 is the coefficient of determination; n is the sample size, that is, the number of culms used for each species. Here, L f represents the sum of all individual leaf width values per culm; W f represents the maximum individual leaf length per culm; A max represents the maximum individual leaf area per culm.

References

    1. Aerts, R. (1999). Interspecific competition in natural plant communities: Mechanisms, trade‐offs and plant‐soil feedbacks. Journal of Experimental Botany, 50(330), 29–37. 10.1093/jxb/50.330.29 - DOI
    1. Bréda, N. J. J. (2003). Ground‐based measurements of leaf area index: A review of methods, instruments and current controversies. Journal of Experimental Botany, 54(392), 2403–2417. 10.1093/jxb/erg263 - DOI - PubMed
    1. Corner, E. J. H. (1949). The durian theory or the origin of the modern tree. Annals of Botany, 13(52), 367–414. 10.1093/OXFORDJOURNALS.AOB.A083225 - DOI
    1. den Dubbelden, K. C. , & Verburg, R. W. (1996). Inherent allocation patterns and potential growth rates of herbaceous climbing plants. Plant and Soil, 184, 341–347. 10.1007/BF00010463 - DOI
    1. Duursma, R. A. , & Falster, D. S. (2016). Leaf mass per area, not total leaf area, drives differences in above‐ground biomass distribution among woody plant functional types. The New Phytologist, 212(2), 368–376. 10.1111/nph.14033 - DOI - PubMed

LinkOut - more resources