. 2024 Nov;23(11):e14275.
doi: 10.1111/acel.14275. Epub 2024 Jul 17.

Macrophage iron dyshomeostasis promotes aging-related renal fibrosis

Affiliations

Macrophage iron dyshomeostasis promotes aging-related renal fibrosis

Lingzhi Wu et al. Aging Cell. 2024 Nov.

Abstract

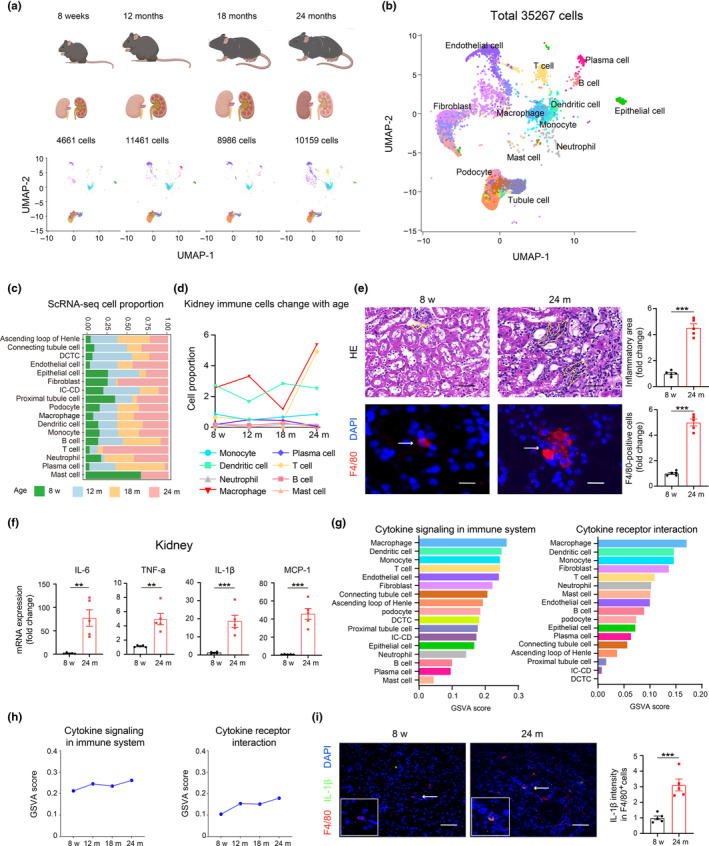
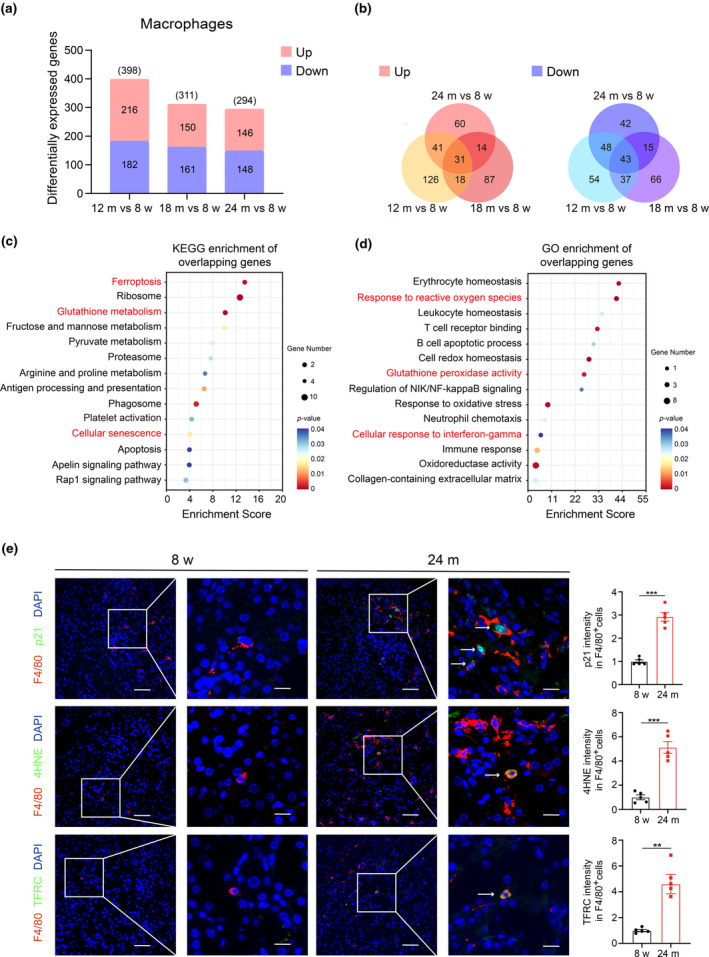
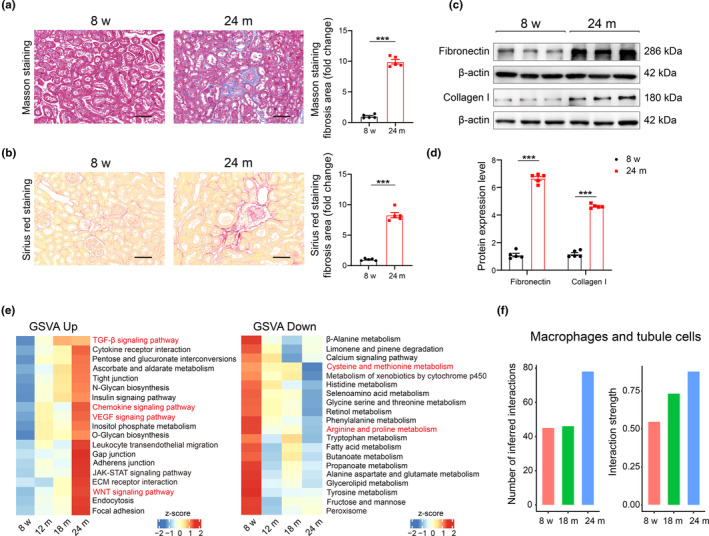
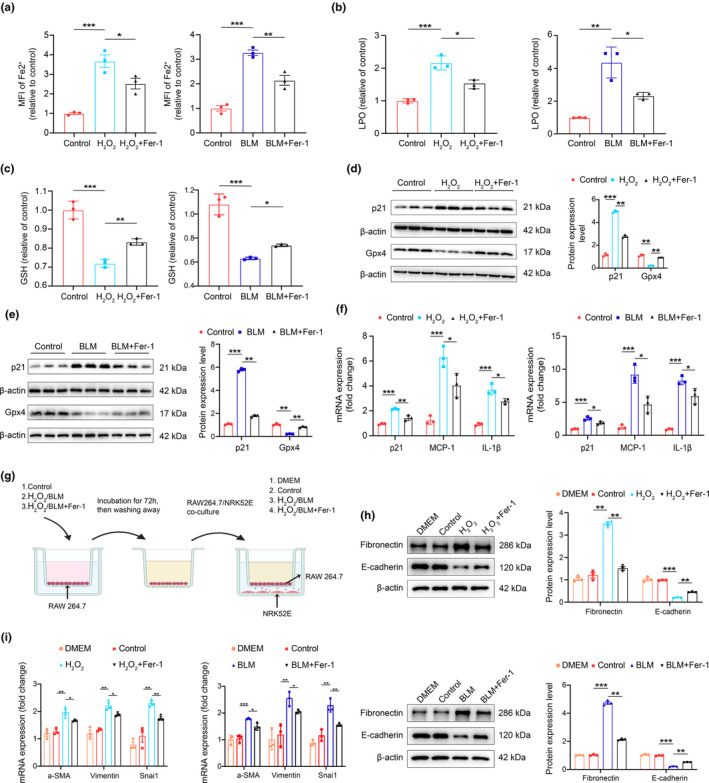
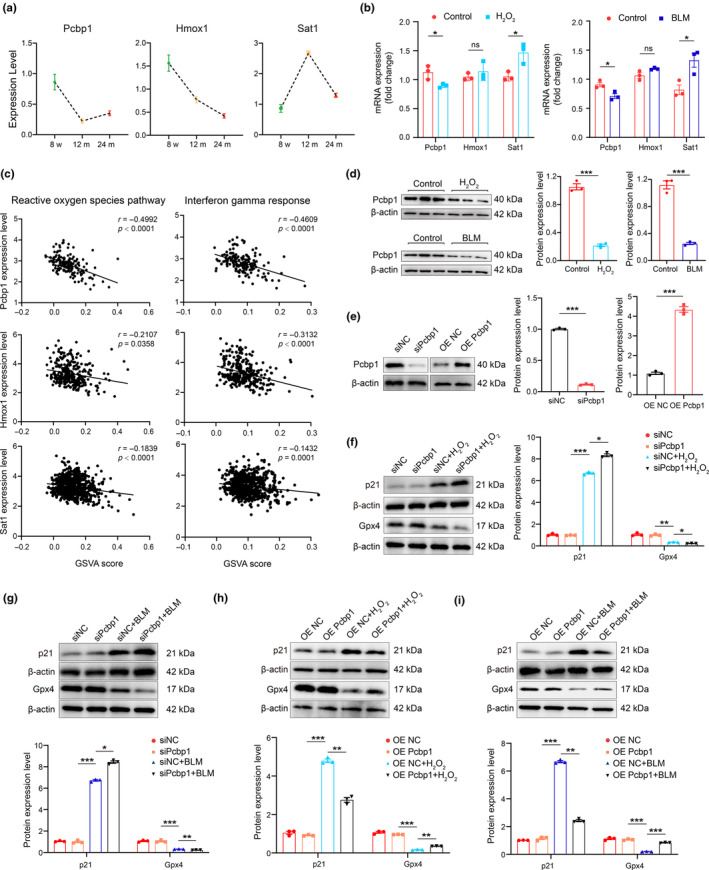
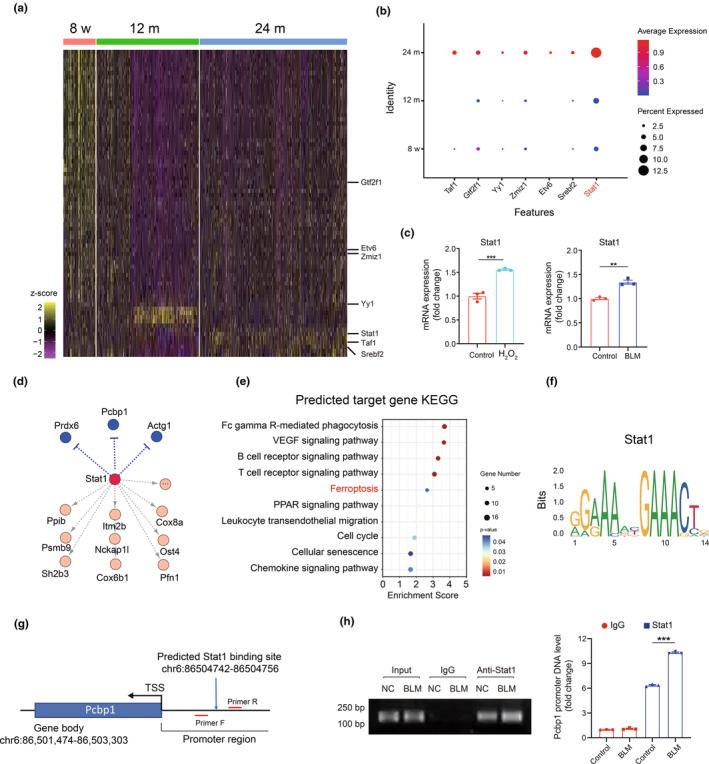
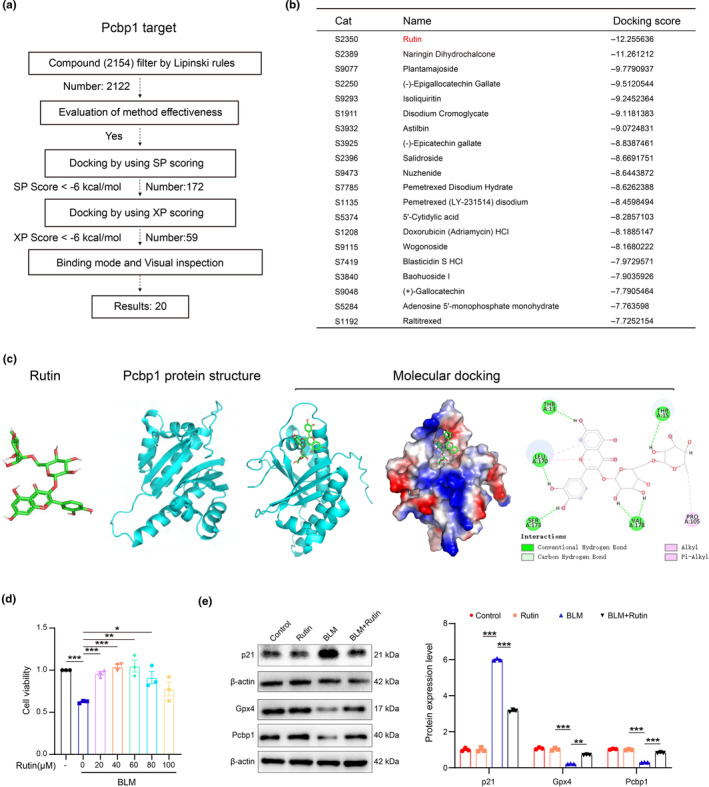
Renal aging, marked by the accumulation of senescent cells and chronic low-grade inflammation, leads to renal interstitial fibrosis and impaired function. In this study, we investigate the role of macrophages, a key regulator of inflammation, in renal aging by analyzing kidney single-cell RNA sequencing data of C57BL/6J mice from 8 weeks to 24 months. Our findings elucidate the dynamic changes in the proportion of kidney cell types during renal aging and reveal that increased macrophage infiltration contributes to chronic low-grade inflammation, with these macrophages exhibiting senescence and activation of ferroptosis signaling. CellChat analysis indicates enhanced communications between macrophages and tubular cells during aging. Suppressing ferroptosis alleviates macrophage-mediated tubular partial epithelial-mesenchymal transition in vitro, thereby mitigating the expression of fibrosis-related genes. Using SCENIC analysis, we infer Stat1 as a key age-related transcription factor promoting iron dyshomeostasis and ferroptosis in macrophages by regulating the expression of Pcbp1, an iron chaperone protein that inhibits ferroptosis. Furthermore, through virtual screening and molecular docking from a library of anti-aging compounds, we construct a docking model targeting Pcbp1, which indicates that the natural small molecule compound Rutin can suppress macrophage senescence and ferroptosis by preserving Pcbp1. In summary, our study underscores the crucial role of macrophage iron dyshomeostasis and ferroptosis in renal aging. Our results also suggest Pcbp1 as an intervention target in aging-related renal fibrosis and highlight Rutin as a potential therapeutic agent in mitigating age-related renal chronic low-grade inflammation and fibrosis.

Keywords: aging‐related renal fibrosis; ferroptosis; iron dyshomeostasis; macrophage; pcbp1; rutin; single‐cell RNA sequencing data; stat1.


Conflict of interest statement

The authors declare no competing interests.

Figures

FIGURE 1
FIGURE 1
Single‐cell RNA sequencing data revealed increased macrophage inflammation during renal aging. (a, b) UMAP visualization of single cells from kidneys across all stages of mice, colored by cluster identity. Our analysis utilized single‐cell transcriptomic data from the Cell Landscape database. (c) The proportion of various cell types during renal aging. (d) The proportion of major immune cell types changed with renal aging. (e) HE staining in kidney tissues from five young and five aged mice (upper). Representative images and quantification of the inflammatory focus area (yellow line) were shown. Scale bars, 20 μm. Representative immunofluorescence images and quantification analysis of macrophages marker F4/80 (arrow) in kidney tissues (Lower). Scale bars, 20 μm. (f) RT‐qPCR analysis of IL‐6, TNF‐a, IL‐1β and MCP‐1 mRNAs in kidney tissues from five young and five aged mice. (g) GSVA score of the cytokine signaling in immune system and cytokine receptor interaction were calculated for all types of renal cells. (h) GSVA score of the cytokine signaling in immune system and cytokine receptor interaction were calculated for macrophages across the age stage. (i) Representative immunofluorescence images and quantification analysis of co‐staining of IL‐1β (green) and F4/80 (red) (arrow) in kidney tissues from five young and five aged mice. Scale bars, 25 μm. DCTC, distal convoluted tubule cell; IC‐CD, intercalated cell of collecting duct. Data were represented as the mean ± SEM. *p < 0.05, **p < 0.01, and ***p < 0.001.
FIGURE 2
FIGURE 2
Single‐cell RNA sequencing data revealed macrophages exhibited senescence and underwent ferroptosis in renal aging. (a) DEGs of macrophages in the middle‐aged group (12 months) and aged group (18, and 24 months) compared to the young group (8 weeks). (b) Venn diagram showing the overlapped DEGs of macrophages (left: Upregulation; right: Downregulation). KEGG pathway (c) and GO pathway (d) analysis of the overlapping DEGs of macrophages. (e) Representative immunofluorescence images and quantification analysis of co‐staining of p21 (green) and F4/80 (red) (upper) (arrow), co‐staining of 4HNE (green) and F4/80 (red) (middle) (arrow), co‐staining of TFRC (green) and F4/80 (red) (lower) (arrow) in kidney tissues from five young and five aged mice. Scale bars, 50, 25 μm. DEGs, differentially expressed genes; KEGG, Kyoto Encyclopedia of Genes and Genomes; GO, Gene Ontology; 4HNE, 4‐ Hydroxynonenal; TFRC, Transferrin Receptor. Data were represented as the mean ± SEM. *p < 0.05, **p < 0.01, and ***p < 0.001.
FIGURE 3
FIGURE 3
Enhanced communications between macrophages and tubular cells potentially contributed to aging‐related renal fibrosis. (a, b) Representative images and quantitative data for the positive area of fibrosis of Masson's trichrome and Sirius red staining in kidney tissues from five young and five aged mice. Scale bars, 20 μm. Representative western blot (c) and quantification (d) of fibronectin and collagen I protein expression in kidney tissue from five young and five aged mice. (e) Heatmap showing enrichment score of the significantly enriched KEGG gene sets across age stages (left: Up; right: Down). (f) The number of interactions between macrophages and tubule cells by CellChat analysis. Data were represented as the mean ± SEM. *p < 0.05, **p < 0.01, and ***p < 0.001.
FIGURE 4
FIGURE 4
Inhibiting ferroptosis signaling by Ferrostatin‐1 alleviated macrophage‐mediated tubular epithelial‐mesenchymal transition in vitro. Cell ferrous ion (Fe2+) level analysis (a), lipid peroxidation measurement (b), and glutathione measurement (c) in drug‐induced senescent macrophage models in vitro with or without Fer‐1. (d, e) Representative western blot and quantification of p21 and Gpx4 protein expression in drug‐induced senescent macrophage models in vitro with or without Fer‐1. (f) RT‐qPCR analysis of p21, MCP‐1, IL‐1β mRNAs in drug‐induced senescent macrophage models in vitro with or without Fer‐1. (g) Schematic diagram of co‐culture of RAW264.7 cells and NRK‐52E kidney tubular cell. (h) Representative western blot and quantification of fibronectin and e‐cadherin protein expression in co‐culture models in vitro (upper and lower). (i) RT‐qPCR analysis of α‐SMA, Vimentin, and Snai1 mRNA in drug‐induced senescent macrophage models in vitro with or without Fer‐1. Data were represented as the mean ± SEM. *p < 0.05, **p < 0.01, and ***p < 0.001.
FIGURE 5
FIGURE 5
Pcbp1 was the core gene in macrophage senescence and ferroptosis. (a) Gene expression levels of overlapped ferroptosis‐related genes from single‐cell RNA sequencing data. (b) RT‐qPCR analysis of Pcbp1, Hmox1, and Sat1 mRNAs in drug‐induced senescent macrophage models in vitro. (c) Significant correlations between the Pcbp1, Hmox1, and Sat1 expression level and the GSVA score of reactive oxygen species pathway and interferon‐gamma response pathway in single‐cell RNA sequencing data. (d) Representative western blot and quantification of protein expression of Pcbp1 in drug‐induced senescent macrophage models in vitro. (e) The transfection efficiency of Pcbp1 overexpressed plasmid or pcbp1 siRNA. (f, g) Transfected Pcbp1 siRNA with H2O2 and BLM stimulation. Representative western blot and quantification analysis of protein expression of p21 and Gpx4 in macrophages were shown. (h, i) Transfected Pcbp1 overexpression plasmid with H2O2 and BLM stimulation. Representative western blot and quantification analysis of protein expression of p21 and Gpx4 in macrophages were shown.
FIGURE 6
FIGURE 6
Stat1 was the key transcription factor in macrophage senescence and ferroptosis by SCENIC analysis. (a) Heatmap showing the age‐related transcription factors in macrophages during aging by SCENIC analysis. (b) The expression of Taf1, Gtf2f1, Yy1, Zmiz1, Etv6, Srebf2, and Stat1 in the single‐cell RNA sequencing data. (c) RT‐qPCR analysis of Stat1 mRNAs in the drug‐induced senescent macrophage models in vitro. (d) Unsupervised regulator analysis showed that Pcbp1 is within the regulon of Stat1. Yellow means up, blue means down. (e) KEGG enrichment analysis of predicted target gene of Stat1. (f) Binding motifs of Stat1 from the JASPAR database. (g) A schematic illustration depicts the Stat1 motif within the promoter region of the Pcbp1 locus. (h) ChIP assay analysis of Stat1 binding to Pcbp1 in macrophages treated with or without BLM. Data were represented as the mean ± SEM. *p < 0.05, **p < 0.01, and ***p < 0.001.
FIGURE 7
FIGURE 7
Rutin prevented macrophage senescence and ferroptosis by upregulating Pcbp1 in vitro. (a) Flow chart showing virtual screening‐based drug screening strategy using an Anti‐Aging Compound Library containing 2154 compounds. (b) The table shows the top 20 Anti‐Aging compounds targeting Pcbp1. (c) Rutin structure, Pcbp1 protein structure, and molecular docking of Rutin to the catalytic core of Pcbp1. (d) The CCK8 result shows the protection role of Rutin in drug‐induced senescent macrophage models in vitro. (e) Representative western blot and quantification analysis of p21, Gpx4, and Pcbp1 protein expression levels in the drug‐induced senescent macrophage model with or without Rutin in vitro. Data were represented as the mean ± SEM. *p < 0.05, **p < 0.01, and ***p < 0.001.

References

    1. Bai, L. , Liu, Y. , Zhang, X. , Chen, P. , Hang, R. , Xiao, Y. , Wang, J. , & Liu, C. (2023). Osteoporosis remission via an anti‐inflammaging effect by icariin activated autophagy. Biomaterials, 297, 122125. - PubMed
    1. Bayır, H. , Anthonymuthu, T. S. , Tyurina, Y. Y. , Patel, S. J. , Amoscato, A. A. , Lamade, A. M. , Yang, Q. , Vladimirov, G. K. , Philpott, C. C. , & Kagan, V. E. (2020). Achieving life through death: Redox biology of lipid peroxidation in ferroptosis. Cell Chemical Biology, 27, 387–408. - PMC - PubMed
    1. Cao, T. , Zhou, J. , Liu, Q. , Mao, T. , Chen, B. , Wu, Q. , Wang, L. , Pathak, J. L. , Watanabe, N. , & Li, J. (2023). Interferon‐γ induces salivary gland epithelial cell ferroptosis in Sjogren's syndrome via JAK/STAT1‐mediated inhibition of system xc(). Free Radical Biology & Medicine, 205, 116–128. - PubMed
    1. Dong, R. , Zhang, X. , Liu, Y. , Zhao, T. , Sun, Z. , Liu, P. , Xiang, Q. , Xiong, J. , Du, X. , Yang, X. , Gui, D. , & Xu, Y. (2023). Rutin alleviates EndMT by restoring autophagy through inhibiting HDAC1 via PI3K/AKT/mTOR pathway in diabetic kidney disease. Phytomedicine, 112, 154700. - PubMed
    1. Fabbiano, S. , Suárez‐Zamorano, N. , Rigo, D. , Veyrat‐Durebex, C. , Stevanovic Dokic, A. , Colin, D. J. , & Trajkovski, M. (2016). Caloric restriction leads to browning of white adipose tissue through type 2 immune signaling. Cell Metabolism, 24, 434–446. - PubMed