. 2024 Aug 1;137(15):jcs262343.
doi: 10.1242/jcs.262343. Epub 2024 Aug 14.

Chemical genetic screens reveal defective lysosomal trafficking as synthetic lethal with NF1 loss

Affiliations

Chemical genetic screens reveal defective lysosomal trafficking as synthetic lethal with NF1 loss

Stephanie J Bouley et al. J Cell Sci. .

Abstract

Neurofibromatosis type 1, a genetic disorder caused by pathogenic germline variations in NF1, predisposes individuals to the development of tumors, including cutaneous and plexiform neurofibromas (CNs and PNs), optic gliomas, astrocytomas, juvenile myelomonocytic leukemia, high-grade gliomas and malignant peripheral nerve sheath tumors (MPNSTs), which are chemotherapy- and radiation-resistant sarcomas with poor survival. Loss of NF1 also occurs in sporadic tumors, such as glioblastoma (GBM), melanoma, breast, ovarian and lung cancers. We performed a high-throughput screen for compounds that were synthetic lethal with NF1 loss, which identified several leads, including the small molecule Y102. Treatment of cells with Y102 perturbed autophagy, mitophagy and lysosome positioning in NF1-deficient cells. A dual proteomics approach identified BLOC-one-related complex (BORC), which is required for lysosome positioning and trafficking, as a potential target of Y102. Knockdown of a BORC subunit using siRNA recapitulated the phenotypes observed with Y102 treatment. Our findings demonstrate that BORC might be a promising therapeutic target for NF1-deficient tumors.

Keywords: BORC; Lysosomes; Mitochondria; NF1; RAS; Synthetic lethal.


Conflict of interest statement

Competing interests The authors declare no competing or financial interests.

Figures

Fig. 1.
Fig. 1.
Y102 is synthetic lethal in NF1-deficient yeast and exhibits activity in NF1-deficient human cell lines. (A) Schematic of screen design. The efficacy of compounds was compared between erg6Δ and erg6Δira2Δ yeast. Compounds were considered hits if erg6Δira2Δ yeast exhibited slow growth or death at concentrations that had no effect on the growth of erg6Δ yeast. (B) Chemical structure of small molecule Y102. (C) Yeast were grown at 30°C starting at an OD600 of 0.05 with Y102 at concentrations ranging from 100 µM to 0.039 µM. At 18 h, OD600 was measured. (D) U87-MG cells were treated for 72 h with Y102 at concentrations ranging from 100 µM to 0.039 µM. (E) U251-MG cells were treated for 72 h with Y102 at concentrations ranging from 20 µM to 0.020 µM. At 3 h prior to collection, cells were stained with alamarBlue. (F) sNF96.2 cells were treated for 72 h with Y102 at concentrations ranging from 100 µM to 0.039 µM. (G,H) U87-MG cells were treated continuously for 72 h, or acutely for 2 h followed by washout, for up to 3 days with Y102 at concentrations ranging from 100 µM to 0.039 µM. (H) Results are normalized to day zero plating. (I) Wild-type (NF1+/+) and mutant (NF1−/−) IMECs were treated for 72 h with Y102 at concentrations ranging from 20 µM to 0.020 µM. (J) ipnNF95.11C (NF1−/+) and ipNF95.11b ‘C’ (NF1−/−) cells were treated in 1% FBS-containing growth medium for 72 h with 20 µM, 10 µM, 5 µM, or 2.5 µM Y102. ns, not significant (P>0.05); *P<0.05; **P<0.005 (two-way ANOVA with multiple comparisons using the Tukey correction method). Viability was measured using Hoechst 33258 unless otherwise stated. For C–G,I,J, results are normalized to DMSO. Results in C–H are the mean±s.d of three experiments; I is the mean of two experiments (four technical replicates each). J is the mean±s.d of four technical replicates.
Fig. 2.
Fig. 2.
Y102 treatment results in increased expression of autophagy and oxidative stress markers and alters the mitochondrial network. (A) U87-MG cells were treated with DMSO, 2 μM Y102 or 50 μM HCQ, an autophagy inhibitor for 24 h. Cells were stained for the autophagy marker p62 (red). DAPI was used to counterstain cell nuclei (blue). Scale bar: 50 µm. (B) 100 cells as in A were analyzed for puncta in triplicate experiments. (C) Western blotting analysis of autophagy markers following a total of 24 h treatment with 2 µM Y102, 50 µM HCQ or the equivalent amount of DMSO (<1%) or 12 h of 2 µM Y102 followed by an additional 12 h with 50 µM HCQ present. Densitometry analysis was used to determine the ratios of p62 and LC3-I and II to α-tubulin control. Values are for blot shown. Blot is representative of three experiments. (D) U87-MG cells were treated with DMSO, 2 μM Y102 or 50 μM HCQ for 24 h. At 30 min prior to the end of treatment, cells were stained with MitoTracker Red CMXROS (red). DAPI was used to counterstain cell nuclei (blue). Scale bar: 50 µm. (E) 100 cells as in D were analyzed in triplicate experiments to determine differences in perinuclear clustering between treatment conditions. (F) U87-MG cells were treated with DMSO, 2 μM Y102, 50 μM HCQ or 100 µM tBHP, an inducer of oxidative stress, for 24 h. At 30 min prior to collection, cells were stained with MitoTracker Red CMXROS (red). Cells were stained for oxidative stress marker 8-hydroxyguanosine (8-OHG) (green). DAPI was used to counterstain cell nuclei (blue). Scale bar: 50 µm. (G) Quantification of 8-OHG positive cells as in F. 100 cells were analyzed in triplicate experiments. N.S., not significant (P>0.1234);  **P<0.0021; ***P<0.0002; ****P<0.0001 (one-way ANOVA with multiple comparisons using the Dunnett correction method). Results in B,E,G are the mean±s.d.
Fig. 3.
Fig. 3.
Treatment with Y102 prevents lysosome-mediated mitochondrial clearance. (A) U87-MG cells were treated for 24 h with DMSO, 2 μM Y102 or 100 μM CoCl2. 30 min prior to collection, cells were stained with MitoTracker Red CMXROS (red). Cells were also stained for the mitophagy receptor BNIP3L (green). DAPI was used to counterstain cell nuclei (blue). Scale bar: 50 µm. (B) Quantification of BNIP3L expression. 100 cells were analyzed from triplicate experiments. (C) RT-qPCR analysis of BNIP3L mRNA expression following Y102 treatment compared to DMSO from triplicate experiments. (D) Western blotting analysis of BNIP3L expression after 2 h of 20 μM Q-VD-OPh hydrate (QVD) pre-treatment, followed by 24 h co-treatment with DMSO, 2 μM Y102, 100 μM CoCl2 or 10 μM CCCP. α-Tubulin served as a loading control. Vertical white line indicates where image was spliced; samples shown are all from the same blot. Densitometry analysis was used to determine the ratios of BNIP3L to tubulin. Values are for blot shown. Blot is representative of three experiments. (E) U87-MG cells were treated for 16 h with DMSO, 2 μM Y102, 2 μM JW-1, 50 μM HCQ or 100 μM CoCl2. Cells were stained for the lysosome marker LAMP1 (red) and the mitochondria marker Tom20 (green). DAPI was used to counterstain cell nuclei (blue). Ratiometric images comparing the colocalization between mitochondria and lysosomes were generated using Fiji. Resulting fluorescence is displayed as intensities (16-color; color bar on right). Images are representative of three repeats. Scale bar: 50 µm. N.S., not significant (P>0.1234); **P<0.0021; ****P<0.0001 (one-way ANOVA with multiple comparisons using the Dunnett correction method). Results in B,C are the mean±s.d.
Fig. 4.
Fig. 4.
Identification of potential targets of Y102 using a multipronged proteomics approach. (A) Yeast were grown at 30°C starting at an OD600 of 0.05 with Y102 or various analogs of Y102 at concentrations ranging from 100 µM to 0.039 μM. At 18 h, OD600 was measured. (B) U87-MG cells were treated for 72 h with Y102 or various analogs of Y102 at concentrations ranging from 100 µM to 0.039 μM. At 3 h prior to collection, cells were stained with alamarBlue. (C) Chemical structure of azide-tagged Y102 (az-Y102), modification based on the structure–activity relationship studies performed with analogs of Y102. (D) Yeast were grown at 30°C starting at an OD600 of 0.05 with Y102 or az-Y102 at concentrations ranging from 100 µM to 0.039 μM. At 18 h, the OD600 was measured. (E) U87-MG cells were treated for 72 h with Y102 or az-Y102 at concentrations ranging from 100 µM to 0.039 μM. At 3 h prior to collection, cells were stained with alamarBlue. (F) Comparison between the two proteomics approaches, along with the implementation of additional criteria to the results, led to the identification of two potential targets of Y102: p21 and BORC. (G) CETSA results for p21 and BORCS6. Graphs represent triplicate analyses and measure the fraction of soluble protein following exposure to the indicated temperatures. (H) Click-chemistry enriched pulldown results for p21 and BORCS7. Graphs represent triplicate analyzes and measure the iBAQ area ratio between az-Y102 and parent compound Y102. α-Tubulin is included as a comparative control. Results in A, B, D and E are the mean±s.d. of four technical replicates. Results in G are the mean±s.d. of three experiments. For H, the box represents the range, and the median is indicated.
Fig. 5.
Fig. 5.
Knockdown of a BORC subunit recapitulates the phenotypes of Y102 treatment. (A) A western blot of lysates from U87-MG cells treated for 72 h with negative control siRNA (siNeg) or siRNA against BORCS6 (siBORCS6) was probed for BORCS6. Densitometry analysis was used to determine the ratio of BORCS6 to α-Tubulin control to determine sufficient knockdown. Densitometry analysis was used to determine their ratio for the blot shown. Blot is representative of two experiments. (B) U87-MG cells were treated with negative control siRNA (siNegative) or siBORCS6. Following 72 h knockdown, cells were stained for the lysosome marker LAMP1 (red), the mitophagy receptor BNIP3L (green), and the autophagy marker p62 (red). DAPI was used to counterstain cell nuclei (blue). Scale bars: 150 µm. Images are representative of three repeats. (C) U87-MG cells were treated for 72 h with siNeg or siBORCS6. At 3 h prior to collection, cells were stained with alamarBlue. Results are the mean±s.d. (n=3). ***P<0.0003 (unpaired two-tail t-test).
Fig. 6.
Fig. 6.
Knockdown of a BORC subunit or treatment with Y102 leads to increased p21 expression and nuclear size. (A) U87-MG cells were treated for 24 h with DMSO, 2 μM Y102 or 2 μM JW-1. Cells were stained for p21, a regulator of the cell cycle (green). DAPI was used to counterstain cell nuclei (blue). Scale bar: 150 µm. (B) Quantification of p21-positive cells for cells treated as per A. 100 cells were analyzed in triplicate experiments. (C) 100 cells were analyzed in triplicate experiments to determine the average nucleus size for cells treated as per A. (D) 100 cells were analyzed in triplicate experiments to determine the average nucleus size of p21-positive cells for cells treated as per A. Number of positive cells out of 300 total cells is indicated by n. (E) U87-MG cells were treated for 24 h with DMSO, 2 µM Y102 or 100 µM CoCl2. Following treatment, cells were trypsinized, permeabilized, and stained with DAPI. Data presented is the percentage of cells in each stage of the cell cycle as measured by flow cytometry for duplicate experiments. (F) To measure senescence, U87-MG cells were treated for 72 h with DMSO, 2 µM Y102 or 100 nM Doxorubicin. Following treatment, cells were fixed and stained with 1 mg/ml β-galactosidase solution. 100 cells were analyzed in triplicate to determine the number of β-galactosidase positive cells. (G) U87-MG cells were treated with negative (siNeg) or BORCS6-specific (siBORCS6) siRNA. Following 72 h knockdown, cells were stained for the cell cycle regulator p21 (green). DAPI was used to counterstain cell nuclei (blue). Scale bar: 150 µm. (H) Quantification of p21-positive cells. 100 cells were analyzed in triplicate experiments for cells treated as per G. (I) 100 cells in triplicate experiments were analyzed to determine the average nucleus size for cells treated as per G. (J) 100 cells in triplicate experiments were analyzed to determine the mean nucleus size of p21-positive cells for cells treated as per G. Results in B–F, H–J are the mean±s.d. N.S., not significant (P>0.1234), *P<0.0332, ***P<0.0002; ****P<0.0001 (one-way ANOVA with multiple comparisons using the Dunnett correction method).
Fig. 7.
Fig. 7.
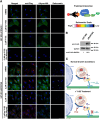
BORC interacts with Y102. (A) U87-MG cells containing an empty vector or expressing FLAG-tagged BORCS6 were treated with az-Y102, Y102 or DMSO. Afterwards, az-Y102 was labeled with alkyne-488 via click chemistry (green), and BORCS6 was visualized using anti-FLAG (red). Nuclei are labeled in blue. Ratiometric images comparing the colocalization between az-Y102 and BORCS6 were generated using Fiji software. Resulting fluorescence is displayed as intensities (16-color; color bar on right). Scale bar: 50 µm. Images are representative of two repeats. (B) A western blot of lysates from U87-MG cells or a clone expressing FLAG-tagged BORCS6 was probed for BORCS6. Densitometry analysis was used to determine the ratios of BORCS6 to GAPDH control to determine sufficient expression for blot shown. Blot is representative of two repeats. Vertical white line indicates where image was spliced; samples shown are all from the same blot. (C) Proposed mechanism of action for Y102. Lysosomal trafficking is carried out through the recruitment of Arl8 by BORC to the lysosome. Arl8 in turn recruits SKIP, which allows for the binding of KLC and kinesin 5. Kinesin 5 traffics the lysosome from the perinuclear region to the cell periphery. Y102 treatment prevents BORC-driven lysosomal trafficking, resulting in the perinuclear clustering of lysosomes.

References

    1. Al-Mehdi, A.-B., Pastukh, V. M., Swiger, B. M., Reed, D. J., Patel, M. R., Bardwell, G. C., Pastukh, V. V., Alexeyev, M. F. and Gillespie, M. N. (2012). Perinuclear mitochondrial clustering creates an oxidant-rich nuclear domain required for hypoxia-induced transcription. Sci. Signal. 5, ra47. 10.1126/scisignal.2002712 - DOI - PMC - PubMed
    1. Alcantara Llaguno, S. R., Wang, Z., Sun, D., Chen, J., Xu, J., Kim, E., Hatanpaa, K. J., Raisanen, J. M., Burns, D. K., Johnson, J. E.et al. (2015). Adult lineage-restricted CNS progenitors specify distinct glioblastoma subtypes. Cancer Cell 28, 429-440. 10.1016/j.ccell.2015.09.007 - DOI - PMC - PubMed
    1. Allaway, R. J., Fischer, D. A., de Abreu, F. B., Gardner, T. B., Gordon, S. R., Barth, R. J., Colacchio, T. A., Wood, M., Kacsoh, B. Z., Bouley, S. J.et al. (2016). Genomic characterization of patient-derived xenograft models established from fine needle aspirate biopsies of a primary pancreatic ductal adenocarcinoma and from patient-matched metastatic sites. Oncotarget 7, 17087-17102. 10.18632/oncotarget.7718 - DOI - PMC - PubMed
    1. Allaway, R. J., Wood, M. D., Downey, S. L., Bouley, S. J., Traphagen, N. A., Wells, J. D., Batra, J., Melancon, S. N., Ringelberg, C., Seibel, W.et al. (2017). Exploiting mitochondrial and metabolic homeostasis as a vulnerability in NF1 deficient cells. Oncotarget 9, 15860-15875. 10.18632/oncotarget.19335 - DOI - PMC - PubMed
    1. Allaway, R. J., Gosline, S. J. C., La Rosa, S., Knight, P., Bakker, A., Guinney, J. and Le, L. Q. (2018). Cutaneous neurofibromas in the genomics era: current understanding and open questions. Br. J. Cancer 118, 1539-1548. 10.1038/s41416-018-0073-2 - DOI - PMC - PubMed

Publication types

MeSH terms