. 2024 Dec;13(1):2382237.
doi: 10.1080/22221751.2024.2382237. Epub 2024 Jul 26.

Numb-associated kinases regulate sandfly-borne Toscana virus entry

Affiliations

Numb-associated kinases regulate sandfly-borne Toscana virus entry

Yarden Moalem et al. Emerg Microbes Infect. 2024 Dec.

Abstract

Sandfly-borne Toscana virus (TOSV) is an enveloped tri-segmented negative single-strand RNA Phlebovirus. It is an emerging virus predominantly endemic in southwestern Europe and Northern Africa. Although TOSV infection is typically asymptomatic or results in mild febrile disease, it is neurovirulent and ranks among the three most common causes of summer meningitis in certain regions. Despite this clinical significance, our understanding of the molecular aspects and host factors regulating phlebovirus infection is limited. This study characterized the early steps of TOSV infection. Our findings reveal that two members of the Numb-associated kinases family of Ser/Thr kinases, namely adaptor-associated kinase 1 (AAK1) and cyclin G-associated kinase (GAK), play a role in regulating the early stages of TOSV entry. FDA-approved inhibitors targeting these kinases demonstrated significant inhibition of TOSV infection. This study suggests that AAK1 and GAK represent druggable targets for inhibiting TOSV infection and, potentially, related Phleboviruses.

Keywords: Bunyaviruses; Phleboviruses; Sandfly; Toscana virus; viral entry.


Conflict of interest statement

No potential conflict of interest was reported by the author(s).

Figures

Figure 1.
Figure 1.
Toscana virus entry depends on endosomal pH. Huh7 cells were pretreated with the indicated concentrations of NH4Cl, followed by infection with TOSV (MOI = 1). (A) Intracellular viral RNA levels were measured after 24 hours. (B) Infectious virus production was determined using plaque assay. Data are plotted relative to DMSO control. (C) Huh7 cells were incubated on ice with TOSV (MOI = 1). After one hour, the cells were shifted to 37°C, and NH4Cl was added at the indicated time points. The cells were stained with a TOSV-specific antibody after 24 hours. Infection levels were calculated based on the fluorescence intensity. Infection levels after 180 min were regarded as 100% infection. (D–E) The effect of endocytosis affecting agents on TOSV entry and cell viability. Huh7 cells were infected with TOSV (MOI = 0.5) and treated with the indicated inhibitors during the infection (0–6 h) or two hours post-infection (2–6 h). Relative viability and intracellular viral RNA levels were determined six hours post-infection. Data are plotted relative to DMSO control. (F) Dose-response of dyngo-4A on TOSV RNA levels. RNA was extracted and analyzed 24 hours post-infection. Data in A and B are mean, ± standard deviation (SD) from a representative experiment out of three performed in triplicates. The results in C are mean ± SD from one experiment performed in triplicates. One-way ANOVA. Results in D and E are mean ± SD, and in F are mean ± standard error of the mean (SEM) from two independent experiments performed in triplicates. Two-way ANOVA, Dunnett’s multiple comparisons test, ****, p < 0.0001, ***, p < 0.001, **, p < 0.01, *, p < 0.05.
Figure 2.
Figure 2.
Knockdown of AAK1 and GAK inhibits TOSV infection. Huh7 clones stably expressing non-targeting (NT) shRNA, shAAK1 (A), or shGAK (B) were infected with TOSV (MOI = 0.01, 0.05, or 0.1). RNA was extracted and analyzed 24 hours post-infection. Data are plotted relative to shNT control. (C, D) shRNA-mediated knockdown was confirmed by western blot using AAK1 and GAK-specific antibodies. Tubulin was used as a loading control. The position and size of the molecular weight markers (kDa) are indicated on the right. The arrowhead indicates the AAK1 band, and the asterisk indicates a non-specific band. (E) Huh7 clones stably expressing shNT, shAAK1, or shGAK were infected with TOSV (MOI = 0.1). After 24 hours, the media was collected to perform plaque assays on Vero cells. The results were normalized to cell viability. The results are mean ± SEM (A, B) or SD (E) from at least two independent experiments performed in duplicates or quadruplicates. Two-way ANOVA, Dunnett’s multiple comparisons test, ****, p < 0.0001, ***, p = 0.0009.
Figure 3.
Figure 3.
Pharmacological inhibition of TOSV infection. Huh7 cells were pretreated for 30 minutes with the indicated doses of (A) sunitinib or (B) erlotinib and infected with TOSV (MOI = 0.1). The drugs were present for the duration of the experiment. Viability (light blue) and TOSV RNA levels (black) were determined 24 hours post-infection. (C) Viral titer was determined using plaque assays. (D–F) Similar experiments were performed using U-87 MG cells (MOI = 0.05). (G–H) Huh7 cells were treated with gefitinib, followed by infection with TOSV (MOI = 0.1) and analysis as described above. The results are mean ± SD from at least two independent experiments performed in triplicates. Two-way ANOVA (C, F) or One-way ANOVA (H), Dunnett's multiple comparisons test, *, p<0.01, **, p<0.001, ****, p<0.0001.
Figure 4.
Figure 4.
AAK1 and GAK inhibit TOSV entry. (A) Replication assay: U-87 MG cells were infected with TOSV (MOI = 1). The cells were harvested 24 hours post-infection and analyzed by strand-specific qRT-PCR. (B) U-87 MG cells were infected with TOSV (MOI = 0.5) on ice for one hour and then shifted to 37°C for an additional 1.5 hours. The media was replaced with media containing 10 μM of the indicated inhibitors. Viability was determined six hours post-infection (blue dashed line). The samples were analyzed as above. (C) Huh7 clones stably expressing shNT, shAAK1, or shGAK were infected with TOSV for two hours (MOI = 5). Viral RNA levels were determined following infection. (D) Huh7 cells were pretreated with the indicated inhibitors or NH4Cl. The cells were infected and analyzed as described in C. (E) Huh7 cells were pretreated with 10 μM of the indicated inhibitors for 30 minutes. The cells were then infected with TOSV (MOI = 1) for one hour on ice. Controls were treated with Proteinase K during infection. Viral RNA levels were determined following infection. Results are mean ± SD from two independent experiments performed in triplicates. (A, B) Two-way ANOVA, Dunnett’s multiple comparisons test, ****, P < 0.0001, *, P = 0.026. (C–E) One-way ANOVA. ****, P < 0.0001, ***, P = 0.0002.
Figure 5.
Figure 5.
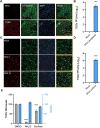
TOSV infection of iPSC-derived neurons. (A) iPSC-derived peripheral neurons from two healthy donors were infected with TOSV (MOI = 5) on day 24. The cells were fixed 24 hours post-infection and stained with TOSV (Red) and Class III β-Tubulin-specific antibodies (Green). DAPI staining is shown in blue. (B) Growth media from the experiment described in A was analyzed for extracellular virus levels. (C) iPSC-derived cortical neurons at day 14 after differentiation were infected with TOSV (MOI = 1 or 10). The cells were fixed and stained as described above. (D) Growth media was used for plaque assays (E) iPSC-derived mature cortical neurons on day 14 of the GENtoniK treatment were pretreated with sunitinib and infected with TOSV (MOI = 0.5). The cells were harvested 6 hours post-infection, and viability and viral RNA levels were determined. Results are mean ± SEM from two independent experiments performed in triplicates. Two-way ANOVA, Dunnett’s multiple comparisons test, ****, P < 0.0001, ***, P < 0.001, **, P < 0.01. Scale bars: 50 µm.
Figure 6.
Figure 6.
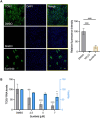
Sunitinib inhibits TOSV infection in primary mouse keratinocytes. (A) Primary mouse keratinocytes were pretreated with sunitinib (5 µM) or NH4Cl (40 mM), followed by infection with TOSV (MOI = 1). The cells were harvested 18 hours post-infection. The treatment continued for the duration of the experiment. The cells were fixed and stained with TOSV-specific antibodies (Green). DAPI staining is shown in blue. Scale bar = 50 µm. The graph shows the quantification of the fluorescent intensity from the images in the experiment. (B) Primary mouse keratinocytes were treated with the indicated concentrations of sunitinib and infected with TOSV (MOI = 0.05), as described above. After 18 hours, viability (light blue) and TOSV RNA levels (black) were determined. Results are mean ± SD from three images for each treatment (A) or two independent experiments performed in triplicates (B). One-way ANOVA (A), Two-way ANOVA (B), Dunnett’s multiple comparisons test, *, p < 0.05, ***, p < 0.001, ****, p < 0.0001.
Figure 7.
Figure 7.
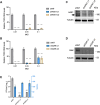
Sunitinib inhibits TOSV entry by inhibiting AP2M1 phosphorylation. (A) Huh7 cells were pretreated with sunitinib (1–10 μM) for 20 minutes and infected with TOSV (MOI = 2.5) for 30 minutes. The cell lysates were analyzed using western blot with the indicated antibodies. pAP2 levels normalized to actinin and total AP2 levels, expressed relative to the DMSO control, are shown. (B) Huh7 cells were transfected with an empty plasmid, AP2M1-expressing plasmid, or a T156A phosphorylation APM21 mutant. The cells were infected with TOSV (MOI = 0.05) the following day. The cells were harvested 24 hours post-infection, and viral RNA levels were determined. (C) Viability was determined 24 hours post-infection. (D) Expression levels of wild-type and mutant AP2M1 were determined using qPCR. (E) Western blot analysis was performed to confirm AP2M1 expression. Results are mean ± SD from two independent experiments performed in duplicates. Two-way ANOVA, Dunnett’s multiple comparisons tests, ***, P < 0.001, ****, P < 0.0001.

References

    1. Alkan C, Bichaud L, de Lamballerie X, et al. . Sandfly-borne phleboviruses of Eurasia and Africa: epidemiology, genetic diversity, geographic range, control measures. Antiviral Res. 2013;100(1):54–74. doi:10.1016/j.antiviral.2013.07.005 - DOI - PubMed
    1. Wang J, Fu S, Xu Z, et al. . Emerging Sand Fly-Borne Phlebovirus in China. Emerg Infect Dis. 2020 Oct;26(10):2435–2438. doi:10.3201/eid2610.191374 - DOI - PMC - PubMed
    1. Ayhan N, Charrel RN.. An update on Toscana virus distribution, genetics, medical and diagnostic aspects. Clin Microbiol Infect. 2020;26(8):1017–1023. doi:10.1016/j.cmi.2019.12.015 - DOI - PubMed
    1. Dersch R, Sophocleous A, Cadar D, et al. . Toscana virus encephalitis in Southwest Germany: a retrospective study. BMC Neurol. 2021;21(1):495–500. doi:10.1186/s12883-021-02528-7 - DOI - PMC - PubMed
    1. Briese T, Calisher CH, Higgs S.. Viruses of the family Bunyaviridae: are all available isolates reassortants? Virology. 2013;446(1–2):207–216. - PubMed

Substances

LinkOut - more resources