. 2024 Sep 2;221(9):e20240365.
doi: 10.1084/jem.20240365. Epub 2024 Jul 17.

Loss of tolerance precedes triggering and lifelong persistence of pathogenic type I interferon autoantibodies

Collaborators, Affiliations

Loss of tolerance precedes triggering and lifelong persistence of pathogenic type I interferon autoantibodies

Sonja Fernbach et al. J Exp Med. .

Abstract

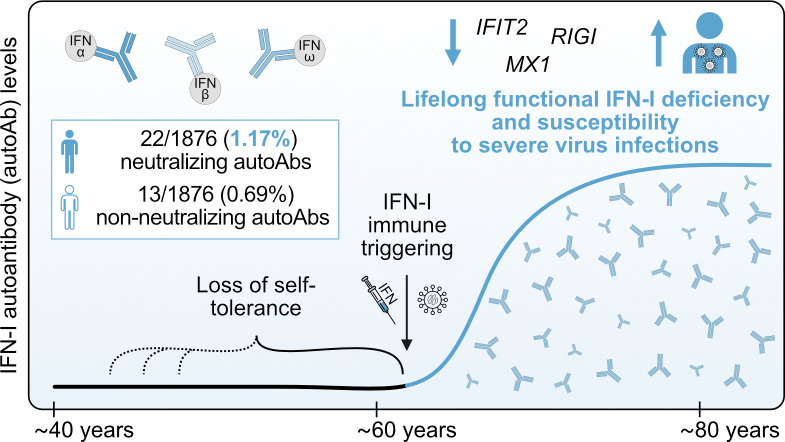
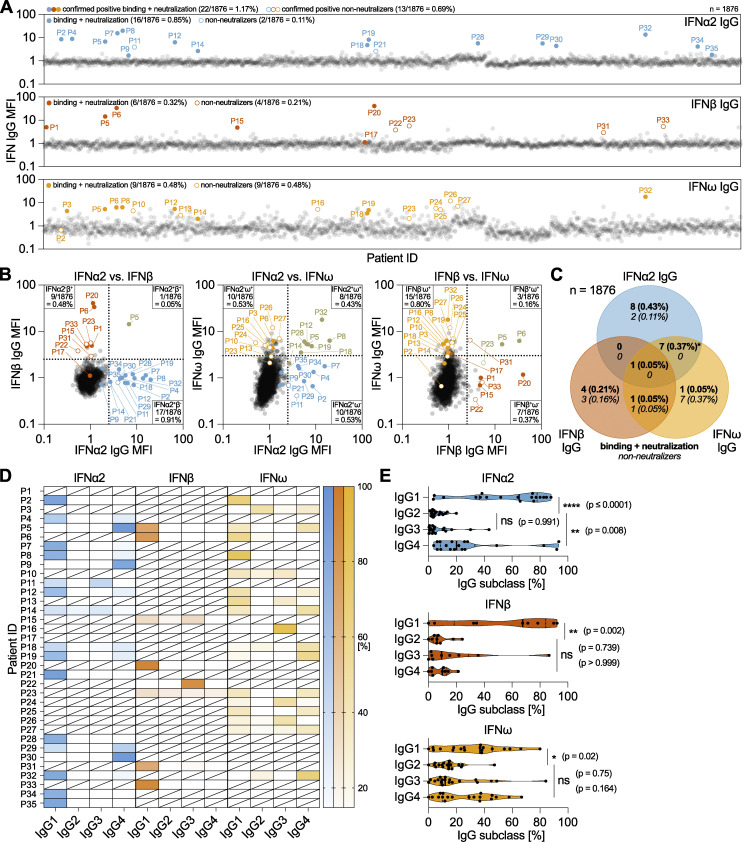
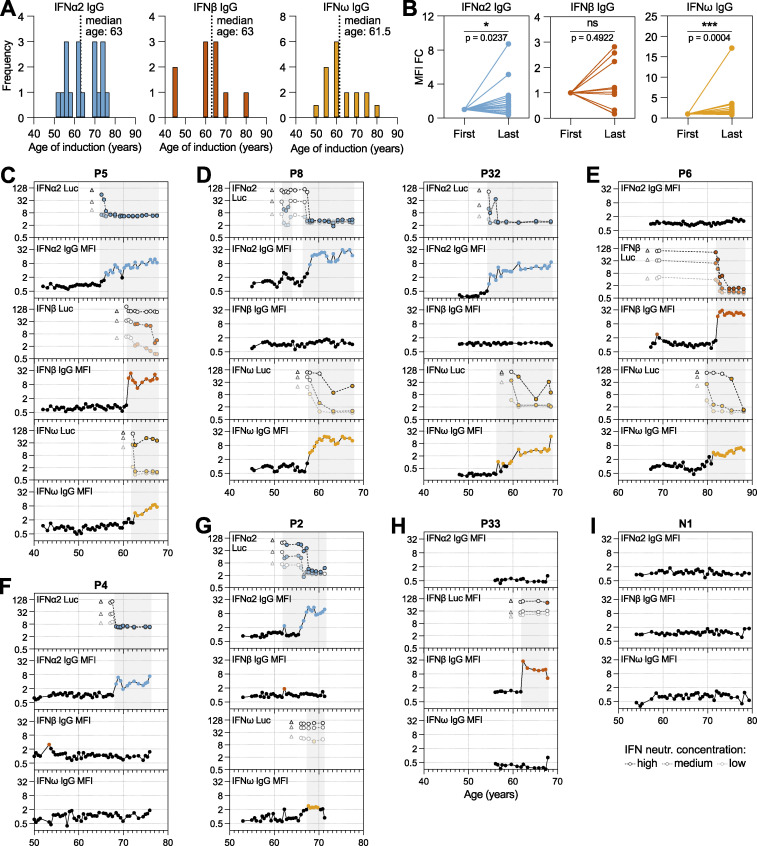
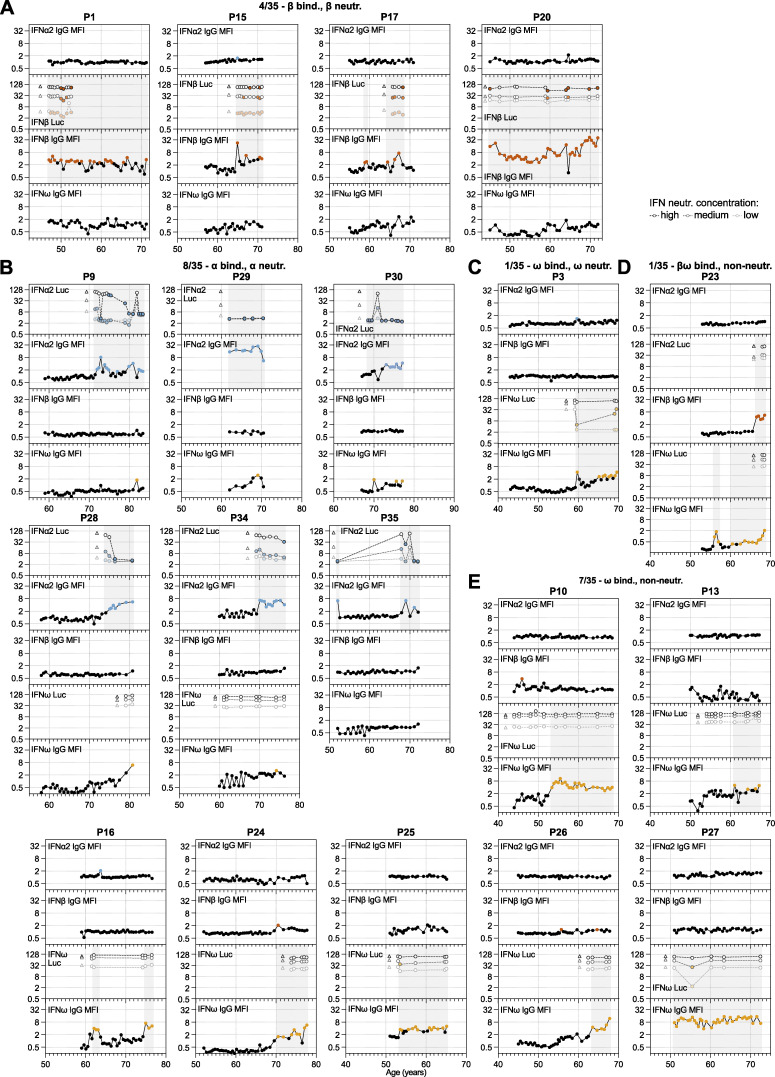
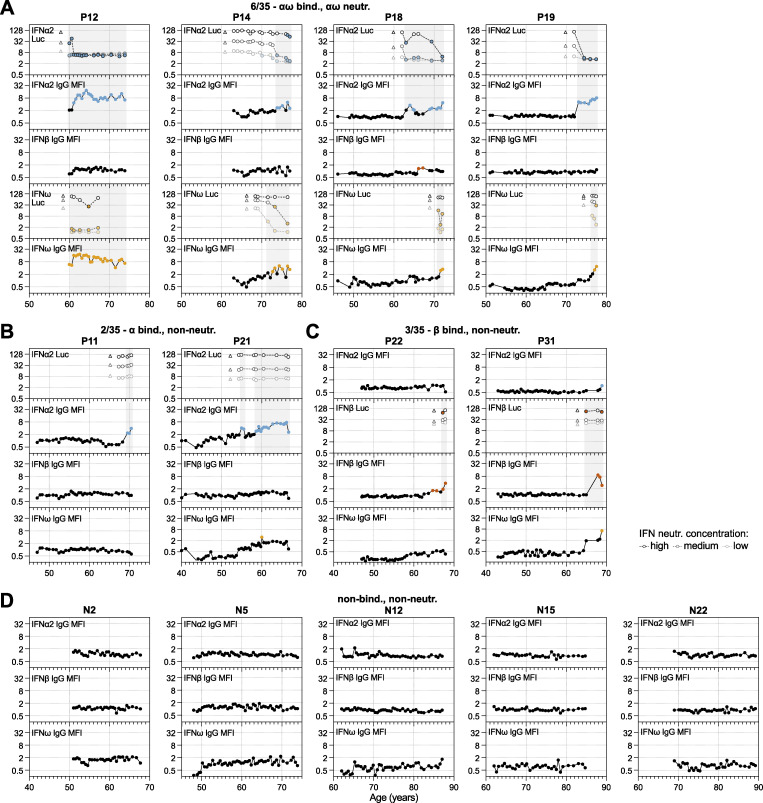
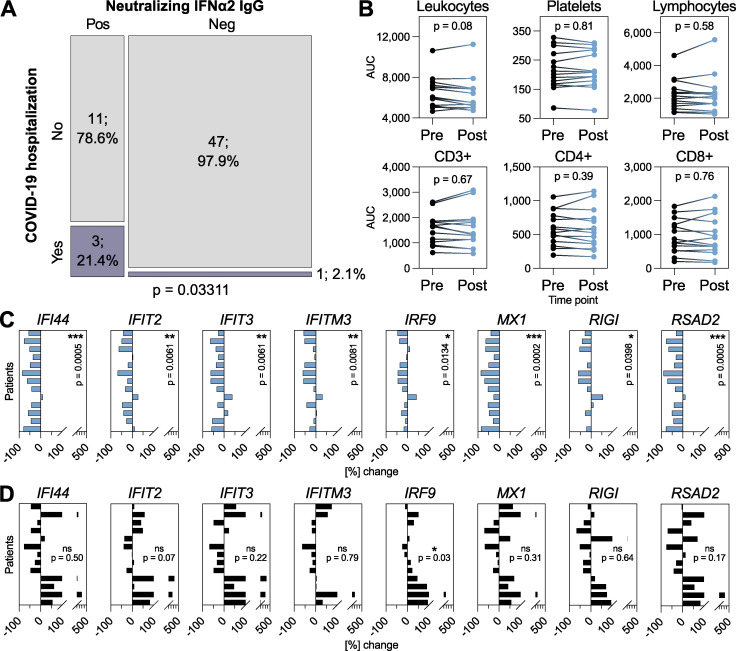
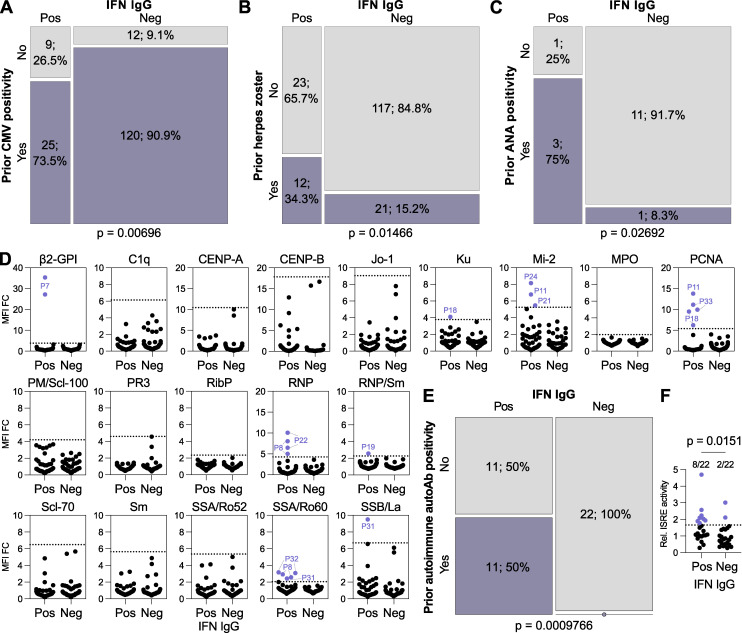
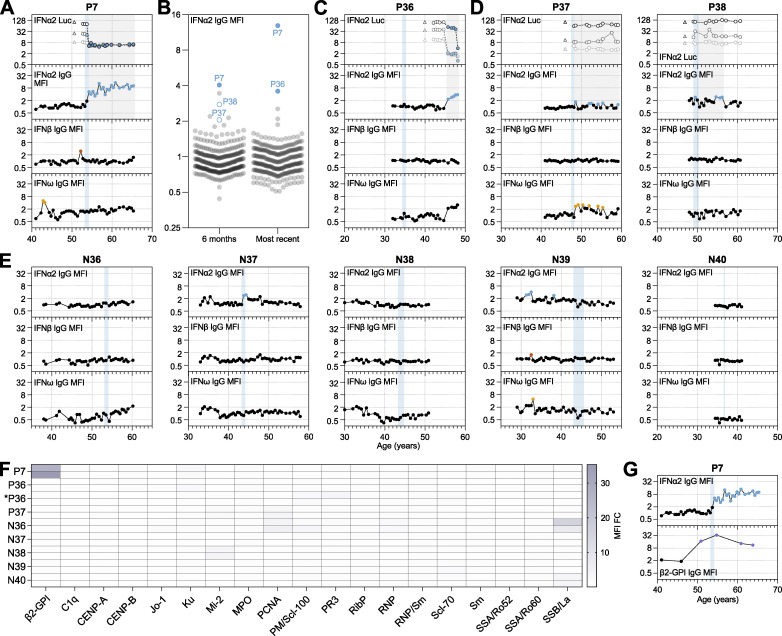
Autoantibodies neutralizing type I interferons (IFN-Is) can underlie infection severity. Here, we trace the development of these autoantibodies at high-resolution using longitudinal samples from 1,876 well-treated individuals living with HIV over a 35-year period. Similar to general populations, ∼1.9% of individuals acquired anti-IFN-I autoantibodies as they aged (median onset ∼63 years). Once detected, anti-IFN-I autoantibodies persisted lifelong, and titers increased over decades. Individuals developed distinct neutralizing and non-neutralizing autoantibody repertoires at discrete times that selectively targeted combinations of IFNα, IFNβ, and IFNω. Emergence of neutralizing anti-IFNα autoantibodies correlated with reduced baseline IFN-stimulated gene levels and was associated with subsequent susceptibility to severe COVID-19 several years later. Retrospective measurements revealed enrichment of pre-existing autoreactivity against other autoantigens in individuals who later developed anti-IFN-I autoantibodies, and there was evidence for prior viral infections or increased IFN at the time of anti-IFN-I autoantibody triggering. These analyses suggest that age-related loss of self-tolerance prior to IFN-I immune-triggering poses a risk of developing lifelong functional IFN-I deficiency.


Conflict of interest statement

Disclosures: E. Bernasconi reported grants from the Swiss National Science Foundation during the conduct of the study, grants from Merck outside the submitted work, and reported that his institution received fees for his participation to advisory boards and travel grants from Merck, Gilead Sciences, ViiV Healthcare, Pfizer AG Switzerland, Moderna, Astra Zeneca, Abbvie, and Ely Lilly. J. Notter reported travel grant/conference attendance paid by Gilead. A. Rauch reported support to his institution for advisory boards and/or travel grants from MSD, Gilead Sciences, Pfizer, and Moderna, and an investigator-initiated trial (IIT) grant from Gilead Sciences. All remuneration went to his home institution and not to A. Rauch personally and all remuneration was provided outside the submitted work. H.F. Günthard reported grants from the Swiss National Science Foundation, NIH, Yvonne Jacob Foundation, Gilead Sciences, and ViiV Healthcare; personal fees from Merck, Gilead Sciences, GSK, Johnson and Johnson, Janssen, and Novartis, and grants from Bill and Melinda Gates Foundation outside the submitted work. R.D. Kouyos reported grants from Gilead Sciences, the Swiss National Science Foundation, and the National Institutes of Health outside the submitted work. No other disclosures were reported.

Figures

None
Graphical abstract
Figure 1.
Figure 1.
Identification and characterization of anti-IFN-I autoAbs in a longitudinally sampled infectious disease patient cohort. (A–C) Validated screening results for the presence of anti-IFNα2, anti-IFNβ, and anti-IFNω IgG in plasma samples derived from unique patients enrolled in the SHCS and aged >65 years at the time of sampling (n = 1,876, representative of two independent screenings). MFI fold change (FC) of IgG values obtained from IFN-I–coated beads relative to the MFI of IgG values obtained from empty beads is shown, normalized to the cohort means for each IFN-I. All individual patient sample results from the initial screening are shown (circles), but only patients considered positive after secondary analysis of longitudinal samples are colored (see Materials and methods for thresholds). Solid-colored circles represent patients who also neutralized the respective IFN-I in subsequent assays. Numbers and percentages of positive patients (neutralizing and non-neutralizing IgG) are indicated for each anti-IFN-I IgG. (B) Pairwise representation of the data shown in A comparing the indicated combinations of anti-IFNα2, anti-IFNβ, and anti-IFNω IgG found in each patient. (C) Venn diagram analysis of the 35 anti-IFN-I autoAb-positive patients highlighting the anti-IFN-I autoAb specificities observed for neutralizing and non-neutralizing IgG. Percentages refer to the entire subcohort (n = 1,876). The asterisk denotes the inclusion of a single patient found to possess binding and neutralizing anti-IFNα2 IgG, as well as binding and non-neutralizing anti-IFNω IgG. (D and E) Plasma samples from anti-IFN-I autoAb-positive patients were analyzed to determine relative levels (%) of each of the four IgG subclasses targeting IFN-Is (n = 33 patients, with at least two independent samples tested per patient). (D) Patient-level analysis is shown as a heat map, where white blocks indicate no anti-IFN-I IgG subclass was detected, and slashed blocks indicate IgG subclass was not determined. (E) IgG subclass analysis in all patients for each IFN-I. Statistical analysis was performed using a one-way ANOVA with Tukey’s multiple comparison (single pooled variance). Exact P values are stated in the panel (* = significant; ns = non-significant).
Figure 2.
Figure 2.
High-resolution longitudinal analysis of anti-IFN-I autoAb development over decades. Semiannually biobanked plasma samples available for all 35 anti-IFN-I autoAb-positive patients (and several negative patients) were analyzed for anti-IFNα2, anti-IFNβ, and anti-IFNω IgG levels, as well as for IFNα2, IFNβ, or IFNω neutralization capacity. (A) Frequency of ages (years) where each anti-IFN-I autoAb was first detected. The median age of first detection (induction) is noted (n = 35). (B) MFI FC values for each anti-IFNα2, anti-IFNβ, and anti-IFNω IgG in each patient comparing relative levels between the first time point where anti-IFN-I autoAbs were detected and the last available time point sampled (n = 35). Statistical analysis was performed using a Wilcoxon matched-pairs signed rank test. Exact P values are stated in the panel (* = significant; ns = non-significant). (C–I) Patient-level representation of anti-IFNα2, anti-IFNβ, and anti-IFNω IgG levels (MFI FC), as well as IFNα2, IFNβ, or IFNω neutralization (inhibition of IFN-induced luciferase [Luc] activity) at three different doses (see Materials and methods), for all available longitudinal samples plotted as a function of patient age (years). Each sample was tested in duplicate, and selected samples were retested for independent experimental validation. Colored circles represent samples considered positive for either binding IgG or neutralization (see Materials and methods for thresholds). Triangles in neutralization plots represent negative controls. The patient in I is a negative patient who never developed anti-IFN-I autoAbs. See also Figs. S1 and S2.
Figure S1.
Figure S1.
High-resolution longitudinal analysis of anti-IFN-I autoAb development over decades. Continued from Fig. 2. (A–E) Patient-level representation of anti-IFNα2, anti-IFNβ, and anti-IFNω IgG levels (MFI FC), as well as IFNα2, IFNβ, or IFNω neutralization (inhibition of IFN-induced luciferase [Luc] activity) at three different doses (see Materials and methods) for all available longitudinal samples plotted as a function of patient age (years). Each sample was tested in duplicate, and selected samples were retested for independent experimental validation. Colored circles represent samples considered positive for either binding IgG or neutralization (see Materials and methods for thresholds). Triangles in neutralization plots represent negative controls. In all panels, individual patients are grouped according to the types of IFN-I to which they possess binding and neutralizing IgG (indicated at the top of each panel, together with the n/35 patients who have a similar phenotype).
Figure S2.
Figure S2.
High-resolution longitudinal analysis of anti-IFN-I autoAb development over decades, together with negative patients. Continued from Fig. 2. (A–C) Patient-level representation of anti-IFNα2, anti-IFNβ, and anti-IFNω IgG levels (MFI FC), as well as IFNα2, IFNβ, or IFNω neutralization (inhibition of IFN-induced luciferase [Luc] activity) at three different doses (see Materials and methods) for all available longitudinal samples plotted as a function of patient age (years). Each sample was tested in duplicate, and selected samples were retested for independent experimental validation. Colored circles represent samples considered positive for either binding IgG or neutralization (see Materials and methods for thresholds). Triangles in neutralization plots represent negative controls. In all panels, individual patients are grouped according to the types of IFN-I to which they possess binding and neutralizing IgG (indicated at the top of each panel, together with the n/35 patients who have a similar phenotype). (D) Semiannually biobanked plasma samples available for 5 patients who were negative for anti-IFN-I autoAbs in initial screenings were analyzed for anti-IFNα2, anti-IFNβ, and anti-IFNω IgG (n = 5). Each panel is a patient-level representation of anti-IFNα2, anti-IFNβ, and anti-IFNω IgG levels (MFI FC) plotted as a function of patient age (years). Each sample was tested in duplicate, and selected samples were retested for independent experimental validation. All samples were considered negative for binding IgG based on established thresholds (see Materials and methods for details).
Figure 3.
Figure 3.
Neutralizing anti-IFNα2 autoAbs are associated with subsequent COVID-19 hospitalization and with compromised baseline ISG levels. (A) Mosaic plot comparing the SHCS recorded incidence of COVID-19 hospitalization between patients who developed neutralizing anti-IFNα2 autoAbs (n = 14) and matched control patients who did not (n = 48). Only patients who were still actively enrolled in the SHCS in 2020 were included (therefore n differs from that in Table S2). Statistical analysis was performed using Fisher’s exact test for count data, and the exact P value is indicated in the panel. (B) Area under the curve (AUC) values for clinically determined cell compositions in whole blood (as indicated) in patients who developed neutralizing anti-IFNα2 autoAbs. Existing clinical cell titers were obtained for each patient from the SHCS, and AUC values were determined from all available data up to 1 year before (pre) or 1 year after (post) the time point where anti-IFNα2 autoAbs were first detected (n = 16). Statistical analysis was performed using a paired Wilcoxon signed rank test. Exact P values are indicated in the panel. (C and D) RT-qPCR analysis of the indicated ISGs in PBMCs from patients who developed neutralizing anti-IFNα autoAbs (n = 13, two to three independent samples per time point) (C) or age-matched control patients who never developed anti-IFN-I autoAbs (n = 13, two to three independent samples per time point) (D). Data shown for each patient represent mean percentage changes in expression of the indicated ISG relative to the first time point (i.e., samples taken before the development of anti-IFNα autoAbs for C, or to the equivalent time point for D). The statistical significance of changes across all patients was determined based on the original ΔCt values (normalized to GAPDH) using a Mann–Whitney U test. Exact P values are indicated in the panels (* = significant; ns = non-significant).
Figure 4.
Figure 4.
Prior infections and immune factors influence the development of anti-IFN-I autoAbs. (A–C) Mosaic plots comparing the SHCS recorded incidence of prior CMV positivity (A), prior herpes zoster diagnosis (B), or prior ANA test positivity (C) between patients who developed anti-IFN-I autoAbs and matched control patients who did not. In A and B, only patients with complete data for the indicated parameter were included (therefore n differs slightly from that in Table S3). In C, only patients who were tested are included. For all panels, n and % are shown. (D) Screening results for the presence of 19 different anti-autoantigen IgGs in plasma samples derived from anti-IFN-I autoAb positive (Pos) patients (n = 22 patients, with two independent samples tested per patient) and age-matched negative control (Neg) patients (n = 22 patients, with two independent samples tested per patient) who were confirmed to have never developed anti-IFN-I autoAbs. The two samples tested per patient were the two samples immediately preceding the first detection of anti-IFN-I autoAbs (for the positive patients; typically 6 and 12 mo before) or age-matched time points for the negative patients. MFI FC IgG values obtained from the indicated autoantigen-coated beads are shown relative to the MFI of IgG values obtained from empty beads normalized to the negative patient mean for each autoantigen. All patient samples are shown (circles). Patient plasmas exhibiting normalized MFI values >5 SDs above the mean MFIs obtained from the negative patient samples (dotted lines) were considered positive for the specific anti-autoantigen IgG and were colored and labeled. (E) Mosaic plot analysis of the data in D. (F) Average relative ISRE-driven luciferase (Luc) activity induced by the two plasma samples from each patient described in D (Pos, n = 22; Neg, n = 22). For A and B, statistical analyses were performed using conditional-logistic regression (taking into account the matched nature of the data) and likelihood-ratio tests; for C, statistical analysis was performed using Fisher’s exact test for count data (as the routine ANA data were not available for matched pairs of cases and controls); and for E, statistical analysis was performed using the exact McNemar test (as this takes into account both the paired nature of the data and the absence of events in one group). For F, statistical analysis was performed using a Mann–Whitney U test. Exact P values are indicated in the appropriate panel.
Figure 5.
Figure 5.
Therapeutic IFNα likely triggered the development and lifelong persistence of neutralizing anti-IFNα autoAbs in an individual with pre-existing autoimmunity. (A) Representation of anti-IFNα2, anti-IFNβ, and anti-IFNω IgG levels (MFI FC), as well as IFNα2 neutralization (inhibition of IFN-induced luciferase [Luc] activity) at three different doses (see Materials and methods), for all available longitudinal samples from patient P7 (who was treated therapeutically with IFNα2) plotted as a function of patient age (years). Each sample was tested in duplicate, and selected samples were retested for independent experimental validation. (B) Validated screening results for the presence of anti-IFNα2 IgG in plasma samples derived from unique patients enrolled in the SHCS who were treated with IFNα2 (n = 300). Two independent samples per patient were assayed in duplicate: the first sample available after IFNα treatment (typically around 6 mo), and the last sample available (most recent: typically 10–20 years later). MFI FC values obtained from IFNα2-coated beads relative to the MFI of values obtained from empty beads are shown, normalized to the cohort mean. All individual patient samples are shown (circles), with samples considered positive after subsequent independent analysis of longitudinal samples colored (see Materials and methods for thresholds). Solid colored circles represent plasma samples that also neutralized IFNα when assayed. Positive patient samples are labeled. (C–E) Representation of data similar to A, but for all available longitudinal samples from the indicated patients who had also been treated therapeutically with IFNα2. Each sample was tested in duplicate, and selected samples were retested for independent experimental validation. (F) Heatmap representation of screening results for the presence of 19 different anti-autoantigen IgGs in plasma samples derived from several patients who had been treated therapeutically with IFNα2 (n = 8). Two independent samples per patient were tested, which were the two samples immediately preceding the start of IFNα2 treatment (typically 6 and 12 mo before), as well as immediately preceding first detection of anti-IFN-I autoAbs (for newly identified patient *P36). MFI FC IgG values obtained from the indicated autoantigen-coated beads are shown relative to the MFI of IgG values obtained from empty beads normalized to the means of controls shown in Fig. 4. Patient plasmas exhibiting normalized MFI values >5 SDs above the mean MFIs obtained from the controls shown in Fig. 4 were considered positive for the specific anti-autoantigen IgG and are colored. Note that the samples for P7 are the same as shown in Fig. 4, as the start of IFNα2 treatment coincided with the first detection of anti-IFN-I autoAbs. (G) Representation of anti-IFNα2 (from A) and anti-β2-GPI IgG levels (MFI FC), in selected longitudinal samples from patient P7 plotted as a function of patient age (years). Each sample was tested in duplicate. In A–E and G, colored circles represent samples considered positive for either binding IgG or neutralization (see Materials and methods for thresholds). Triangles in neutralization plots represent negative controls. Blue shading indicates the period of time when each patient underwent IFNα2 treatment.

References

    1. Abers, M.S., Rosen L.B., Delmonte O.M., Shaw E., Bastard P., Imberti L., Quaresima V., Biondi A., Bonfanti P., Castagnoli R., et al. . 2021. Neutralizing type-I interferon autoantibodies are associated with delayed viral clearance and intensive care unit admission in patients with COVID-19. Immunol. Cell Biol. 99:917–921. 10.1111/imcb.12495 - DOI - PMC - PubMed
    1. Achleitner, M., Mair N.K., Dänhardt J., Kardashi R., Puhan M.A., Abela I.A., Toepfner N., de With K., Kanczkowski W., Jarzebska N., et al. . 2023. Absence of type I interferon autoantibodies or significant interferon signature alterations in adults with post-COVID-19 syndrome. Open Forum Infect. Dis. 11:ofad641. 10.1093/ofid/ofad641 - DOI - PMC - PubMed
    1. Akbil, B., Meyer T., Stubbemann P., Thibeault C., Staudacher O., Niemeyer D., Jansen J., Mühlemann B., Doehn J., Tabeling C., et al. . 2022. Early and rapid identification of COVID-19 patients with neutralizing type I interferon auto-antibodies. J. Clin. Immunol. 42:1111–1129. 10.1007/s10875-022-01252-2 - DOI - PMC - PubMed
    1. Alotaibi, F., Alharbi N.K., Rosen L.B., Asiri A.Y., Assiri A.M., Balkhy H.H., Al Jeraisy M., Mandourah Y., AlJohani S., Al Harbi S., et al. . 2023. Type I interferon autoantibodies in hospitalized patients with Middle East respiratory syndrome and association with outcomes and treatment effect of interferon beta-1b in MIRACLE clinical trial. Influenza Other Respir. Viruses. 17:e13116. 10.1111/irv.13116 - DOI - PMC - PubMed
    1. Babcock, B.R., Kosters A., Eddins D.J., Donaire M.S.B., Sarvadhavabhatla S., Pae V., Beltran F., Murray V.W., Gill G., Xie G., et al. . 2024. Transient anti-interferon autoantibodies in the airways are associated with efficient recovery from COVID-19. medRxiv. 10.1101/2024.01.11.24301000 (Preprint posted January 11, 2024). - DOI

Publication types