. 2024 Jul 19;10(29):eado1218.
doi: 10.1126/sciadv.ado1218. Epub 2024 Jul 17.

Endogenous retroviruses mediate transcriptional rewiring in response to oncogenic signaling in colorectal cancer

Affiliations

Endogenous retroviruses mediate transcriptional rewiring in response to oncogenic signaling in colorectal cancer

Atma Ivancevic et al. Sci Adv. .

Abstract

Cancer cells exhibit rewired transcriptional regulatory networks that promote tumor growth and survival. However, the mechanisms underlying the formation of these pathological networks remain poorly understood. Through a pan-cancer epigenomic analysis, we found that primate-specific endogenous retroviruses (ERVs) are a rich source of enhancers displaying cancer-specific activity. In colorectal cancer and other epithelial tumors, oncogenic MAPK/AP1 signaling drives the activation of enhancers derived from the primate-specific ERV family LTR10. Functional studies in colorectal cancer cells revealed that LTR10 elements regulate tumor-specific expression of multiple genes associated with tumorigenesis, such as ATG12 and XRCC4. Within the human population, individual LTR10 elements exhibit germline and somatic structural variation resulting from a highly mutable internal tandem repeat region, which affects AP1 binding activity. Our findings reveal that ERV-derived enhancers contribute to transcriptional dysregulation in response to oncogenic signaling and shape the evolution of cancer-specific regulatory networks.


Figures
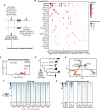
Fig. 1.
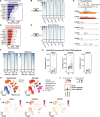
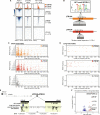
Fig. 1.. Pan-cancer epigenomic analysis of TE activity.
(A) Pipeline to estimate TE subfamily enrichment within cancer-specific regulatory regions. Aggregate ATAC-seq maps associated with TCGA tumor types were filtered to remove regulatory regions predicted in normal adult tissues. Cancer-specific accessible chromatin regions were tested for enrichment of 1315 repeat subfamilies. (B) Bubble chart summarizing TE subfamily enrichment within cancer-specific ATAC-seq regions across 21 cancer types profiled by TCGA (acronyms shown on the x axis; full names provided at https://gdc.cancer.gov/resources-tcga-users/tcga-code-tables/tcga-study-abbreviations). TE subfamilies and cancer types are sorted on the basis of maximum enrichment score. (C) Enrichment of TE subfamilies within cancer-specific ATAC-seq associated with colon adenocarcinomas from TCGA. Every point represents a TE subfamily. Enriched TEs are shown in red; depleted TEs are shown in blue. (D) Estimated origin of HERV-I elements on the primate phylogeny based on the genomic presence or absence. (E) Principal components analysis based on multiple sequence alignment of LTR10 sequences in the human genome. Every point represents an individual LTR10 sequence. LTR10A and LTR10F sequences are colored orange and red, respectively. (F) Heatmap of representative patient tumor ATAC-seq signals (TCGA patients COAD P053, P012, P002, P025, P004, P016, P001, and P049) over the merged set of 649 LTR10A/F elements. Bottom metaprofiles represent average normalized ATAC signal across elements. (G) Heatmap of enhancer-associated chromatin marks from HCT116 cells over the merged set of 649 LTR10A/F elements. From left to right: H3K27ac ChIP-seq (GSE97527), H3K4me1 ChIP-seq (GSE101646), POLR2A ChIP-seq (GSE32465), EP300 ChIP-seq (GSE51176), and HCT116 ATAC-seq (GSE126215). Bottom metaprofiles represent the normalized signal across elements.
Fig. 2.
Fig. 2.. Regulatory activity of LTR10 in tumor and normal cells.
(A) Transcriptional repressors associated with LTR10A/F elements, ranked by enrichment score. (B) Heatmap of ChIP-seq signal from H3K9me3 and repressive factors, over LTR10A/F elements. From left to right: H3K9me3 ChIP-seq (GSE16256), ZNF562 ChIP-seq (GSE78099), TRIM28 ChIP-seq (GSE84382), SETDB1 ChIP-seq (GSE31477), ZEB1 (GSE106896), and ZEB2 ChIP-seq (GSE91406). (C) Transcriptional activators associated with LTR10A/F elements, ranked by enrichment score. (D) Heatmap of ChIP-seq signal from H3K27ac and activating transcription factors in HCT116 cells, over LTR10A/F elements. From left to right: H3K27ac ChIP-seq (GSE96299) and ChIP-seq for FOSL1, JUND, USF1, SRF, and CEBPB (all from GSE32465). (E) Schematic of AP1 motif locations for LTR10 consensus sequences from each subfamily. Sequence logo for AP1 motif FOSL1 (MA0477.1 from JASPAR) is shown, and predicted motif locations are marked. (F) Heatmap of H3K27ac and H3K4me1 ChIP-seq signals from tumor (T) and normal (N) samples from patients AKCC52 and AKCC58 with colorectal cancer (39) over LTR10A/F elements. Bottom metaprofiles represent average normalized ChIP signal. (G) Dot plots of normalized counts for FOSL1, LTR10A, and LTR10F from bulk RNA-seq derived from a cohort of 38 TCGA patients with colorectal adenocarcinomas. Each patient has one tumor (T) sample and one normal (N) colon sample. ***P < 0.001, paired sample Wilcoxon test. (H) UMAP projections of the single-cell transcriptome of patient C136 from (40). UMAPs are colored by tissue type or cell type. (I) UMAP projections of the same patient, colored by the expression of FOSL1, LTR10A, or LTR10F. (J) Bubble plot of the same patient, showing the mean expression of FOSL1, LTR10A, and LTR10F in tumor epithelia versus normal epithelia.
Fig. 3.
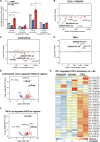
Fig. 3.. Control of LTR10 activity by AP1/MAPK signaling.
(A) Luciferase reporter assays of LTR10A/F consensus sequences, including sequence variants containing shuffled AP1 motifs. Reporter activity was measured in HCT116 cells treated with dimethyl sulfoxide (DMSO; n = 3), cobimetinib (n = 3), or TNFα (n = 3) for 24 hours. Values are normalized to firefly cotransfection controls and presented as fold change (FC) against the mean values from cells transfected with an empty minimal promoter pNL3.3 vector. *P < 0.05, **P < 0.01, and ***P < 0.001, two-tailed Student’s t test. Error bars denote SEM. (B to D) MA (also known as minus-average plots) plots of TE subfamilies showing significant differential expression in HCT116 cells subject to FOSL1 silencing (B), 24-hour cobimetinib treatment (C), or 24-hour TNFα treatment (D), based on RNA-seq. Dots are colored in red if they are significant (adjusted P < 0.05, log2FC < 0 for FOSL1/cobimetinib and log2FC > 0 for TNFα). (E) Volcano plot showing TE subfamily enrichment in the set of H3K27ac regions significantly down-regulated by cobimetinib. (F) Volcano plot showing TE subfamily enrichment in the set of H3K27ac regions significantly up-regulated by TNFα. (G) Heatmap of normalized H3K27ac CUT&RUN signal for 38 LTR10 elements predicted to function as enhancers regulating AP1 target genes for each treatment replicate.
Fig. 4.
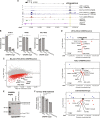
Fig. 4.. Functional characterization of LTR10.ATG12 in HCT116 cells.
(A) Genome browser screenshot of the ATG12/AP3S1 locus with the LTR10.ATG12 enhancer labeled. From top to bottom: JUND and FOSL1 ChIP-seq (GSE32465), H3K27ac CUT&RUN (in-house), tumor/normal H3K27ac ChIP-seq from patient AKCC52 (39), tumor ATAC-seq from TCGA-COAD patient P022, HCT116 RNA-seq (in-house), and HCT116 PRO-seq (GSE129501). (B) Normalized RNA-seq expression values of ATG12, AP3S1, and ARL14EPL in dCas9-KRAB-MeCP2 HCT116 cells stably transfected with gRNAs targeting the ATG12 TSS (n = 2), the LTR10.ATG12 element (n = 2), or nontargeting [green fluorescent protein (GFP)] control (n = 2). *P < 0.05, **P < 0.01, and ***P < 0.001, Welch’s t test. Error bars denote SEM. (C) MA plot showing global gene expression changes in cells in response to silencing LTR10.ATG12. Significantly down-regulated genes are shown in red. (D) Scatterplot of gene expression changes in the locus containing the LTR10.ATG12 element, associated with (i) silencing LTR10.ATG12, (ii) silencing FOSL1, or (iii) cobimetinib treatment. Significantly down-regulated genes are shown in red; significantly up-regulated genes are shown in blue. Significantly down-regulated genes located within 1.5 Mb of the targeted element are labeled (element box not drawn to scale). (E) Immunoblot of endogenous ATG12 in each CRISPRi cell line. Different ATG12 conjugate forms are labeled. (F) Caspase-3/7 activity after 12 hours staurosporine (STS) treatment, measured by the Caspase-Glo 3/7 assay. Treatments were performed in triplicate, and signal for each cell line was normalized to signal from DMSO treatment. *P < 0.05 and **P < 0.01, Welch’s t test. Error bars denote SEM.
Fig. 5.
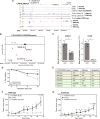
Fig. 5.. Functional characterization of LTR10.XRCC4 in HCT116 cells and xenograft models.
(A) Genome browser screenshot of the XRCC4 locus with the LTR10.XRCC4 enhancer labeled. From top to bottom: JUND and FOSL1 ChIP-seq (GSE32465), H3K27ac CUT&RUN (in-house), H3K27ac ChIP-seq from patient AKCC52 (39), ATAC-seq from TCGA-COAD patient P022, HCT116 RNA-seq (in-house), and HCT116 PRO-seq (GSE129501). (B) Scatterplot of gene expression changes at the XRCC4 locus after CRISPR silencing of the LTR10.XRCC4 enhancer. Significantly down-regulated genes are shown in red; significantly up-regulated genes are shown in blue. Significantly down-regulated genes located within 1.5 Mb of the targeted element are labeled. (C) Quantitative reverse transcription polymerase chain reaction expression values of XRCC4 and VCAN in wild-type HCT116 cells (n = 3) and LTR10.XRCC4 knockout cells (n = 3). *P < 0.05, Welch’s t test. Error bars denote SEM. CTCF, CCCTC-binding factor. (D) Dose-response curve showing cell viability in response to 0 to 10 Gy irradiation for LTR10.XRCC4 knockout and wild-type cells. *P < 0.05, paired Student’s t test. Error bars denote SEM. (E) Classification of responder versus nonresponder for wild-type and LTR10.XRCC4 knockout cells, based on xenograft growth curves of untreated or irradiated mice. Three measures were calculated (100): tumor growth inhibition (TGI), modified response evaluation criteria in solid tumors (mRECIST), and area under the curve (AUC). PD, progressive disease; SD, stable disease. (F and G) Average growth curves for wild-type (F) versus LTR10.XRCC4 knockout (G) xenograft tumors, with and without irradiation, for 28 days. 8 Gy treatment time points (days 2, 4, 14, 16, and 18) are indicated by red triangles. *P < 0.05, **P < 0.01, and ***P < 0.001, two-sample t test assuming equal variances. Error bars denote SEM.
Fig. 6.
Fig. 6.. LTR10 repeat instability and polymorphism.
(A) Heatmap of FOSL1 ChIP-seq, gnomAD indels between 10 and 300 bp in length, and AP1 motif matches (P < 1 × 10⁻⁴) across LTR10A, LTR10F, and LTR10C elements. Overlapping elements were removed, retaining 990 LTR10 elements total across the three subfamilies. FOSL1 ChIP-seq was obtained from GSE32465. (B) Schematic of VNTR regions within LTR10A and LTR10F elements. (C) Scatterplot of high-confidence gnomAD indels between 10 and 300 bp in length detected in LTR10A, LTR10F, or LTR10C subfamilies. Each indel is plotted by its length and allele frequency. (D) As in (C) but using long-read supported data. (E) Genome browser screenshot of LTR10.ATG12 showing AP1 motifs, long-read indels [e.g., 58-bp deletion reported in (78)], and gnomAD indels. (F) GIGGLE enrichment of ERVs within long-read indels. Significantly enriched ERVs are shown in red; significantly depleted ERVs are shown in blue.

References

    1. You J. S., Jones P. A., Cancer genetics and epigenetics: Two sides of the same coin? Cancer Cell 22, 9–20 (2012). - PMC - PubMed
    1. Rheinbay E., Nielsen M. M., Abascal F., Wala J. A., Shapira O., Tiao G., Hornshøj H., Hess J. M., Juul R. I., Lin Z., Feuerbach L., Sabarinathan R., Madsen T., Kim J., Mularoni L., Shuai S., Lanzós A., Herrmann C., Maruvka Y. E., Shen C., Amin S. B., Bandopadhayay P., Bertl J., Boroevich K. A., Busanovich J., Carlevaro-Fita J., Chakravarty D., Chan C. W. Y., Craft D., Dhingra P., Diamanti K., Fonseca N. A., Gonzalez-Perez A., Guo Q., Hamilton M. P., Haradhvala N. J., Hong C., Isaev K., Johnson T. A., Juul M., Kahles A., Kahraman A., Kim Y., Komorowski J., Kumar K., Kumar S., Lee D., Lehmann K.-V., Li Y., Liu E. M., Lochovsky L., Park K., Pich O., Roberts N. D., Saksena G., Schumacher S. E., Sidiropoulos N., Sieverling L., Sinnott-Armstrong N., Stewart C., Tamborero D., Tubio J. M. C., Umer H. M., Uusküla-Reimand L., Wadelius C., Wadi L., Yao X., Zhang C.-Z., Zhang J., Haber J. E., Hobolth A., Imielinski M., Kellis M., Lawrence M. S., von Mering C., Nakagawa H., Raphael B. J., Rubin M. A., Sander C., Stein L. D., Stuart J. M., Tsunoda T., Wheeler D. A., Johnson R., Reimand J., Gerstein M., Khurana E., Campbell P. J., López-Bigas N.; PCAWG Drivers and Functional Interpretation Working Group; PCAWG Structural Variation Working Group, Weischenfeldt J., Beroukhim R., Martincorena I., Pedersen J. S., Getz G.; PCAWG Consortium , Analyses of non-coding somatic drivers in 2,658 cancer whole genomes. Nature 578, 102–111 (2020). - PubMed
    1. Cohen A. J., Saiakhova A., Corradin O., Luppino J. M., Lovrenert K., Bartels C. F., Morrow J. J., Mack S. C., Dhillon G., Beard L., Myeroff L., Kalady M. F., Willis J., Bradner J. E., Keri R. A., Berger N. A., Pruett-Miller S. M., Markowitz S. D., Scacheri P. C., Hotspots of aberrant enhancer activity punctuate the colorectal cancer epigenome. Nat. Commun. 8, 14400 (2017). - PMC - PubMed
    1. Chapuy B., McKeown M. R., Lin C. Y., Monti S., Roemer M. G. M., Qi J., Rahl P. B., Sun H. H., Yeda K. T., Doench J. G., Reichert E., Kung A. L., Rodig S. J., Young R. A., Shipp M. A., Bradner J. E., Discovery and characterization of super-enhancer-associated dependencies in diffuse large B cell lymphoma. Cancer Cell 24, 777–790 (2013). - PMC - PubMed
    1. Roe J.-S., Hwang C.-I., Somerville T. D. D., Milazzo J. P., Lee E. J., Da Silva B., Maiorino L., Tiriac H., Young C. M., Miyabayashi K., Filippini D., Creighton B., Burkhart R. A., Buscaglia J. M., Kim E. J., Grem J. L., Lazenby A. J., Grunkemeyer J. A., Hollingsworth M. A., Grandgenett P. M., Egeblad M., Park Y., Tuveson D. A., Vakoc C. R., Enhancer reprogramming promotes pancreatic cancer metastasis. Cell 170, 875–888.e20 (2017). - PMC - PubMed

Publication types