. 2024 Jul 19;10(29):eadl5638.
doi: 10.1126/sciadv.adl5638. Epub 2024 Jul 17.

Repression of mRNA translation initiation by GIGYF1 via disrupting the eIF3-eIF4G1 interaction

Affiliations

Repression of mRNA translation initiation by GIGYF1 via disrupting the eIF3-eIF4G1 interaction

Jung-Hyun Choi et al. Sci Adv. .

Abstract

Viruses can selectively repress the translation of mRNAs involved in the antiviral response. RNA viruses exploit the Grb10-interacting GYF (glycine-tyrosine-phenylalanine) proteins 2 (GIGYF2) and eukaryotic translation initiation factor 4E (eIF4E) homologous protein 4EHP to selectively repress the translation of transcripts such as Ifnb1, which encodes the antiviral cytokine interferon-β (IFN-β). Herein, we reveal that GIGYF1, a paralog of GIGYF2, robustly represses cellular mRNA translation through a distinct 4EHP-independent mechanism. Upon recruitment to a target mRNA, GIGYF1 binds to subunits of eukaryotic translation initiation factor 3 (eIF3) at the eIF3-eIF4G1 interaction interface. This interaction disrupts the eIF3 binding to eIF4G1, resulting in transcript-specific translational repression. Depletion of GIGYF1 induces a robust immune response by derepressing IFN-β production. Our study highlights a unique mechanism of translational regulation by GIGYF1 that involves sequestering eIF3 and abrogating its binding to eIF4G1. This mechanism has profound implications for the host response to viral infections.


Figures
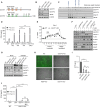
Fig. 1.
Fig. 1.. GIGYF1 enables RNA virus replication by repressing the translation of Ifnb1 mRNA through a 4EHP-independent mechanism.
(A) Schematic representation of the critical motifs in human GIGYF1 and GIGYF2 proteins. Domain sizes are not depicted at scale. Images were generated with BioRender.com. (B) WB analysis with the indicated antibodies of WT, GIGYF1-KO, GIGYF2-KO, and 4EHP-KO HEK293 cell lysates. (C) Fractionation of endogenous proteins by size exclusion chromatography, followed by WB with the indicated antibodies. Elution position of the molecular weight markers is shown. (D) ELISA measurement of IFN-β production in TLR3-HEK293 cells with indicated genotypes following 6 hours of poly(I:C) (1 μg/ml) stimulation. (E) Polysome profiling and quantitative reverse transcription polymerase chain reaction (qRT-PCR) analysis of Ifnb1 mRNA translation in poly(I:C)-treated WT and GIGYF1-KO HEK293 cells. 80S peak corresponds to fractions 4 to 5. An increase in the fraction number (x axis) corresponds with higher translation rate. (F) WB analysis of cell lysates from (D). (G) WB analysis of viral protein VSV-G in the HEK293 cells with indicated genotypes 12 hours after infection with mock or VSVΔ51. (H and I) Virus protection assay for measurement of the impact of GIGYF1-KO on viral replication and spread. HEK293 cells with indicated genotypes were treated with poly(I:C) (1 μg/ml) for 6 hours. Culture media from the treated cells were transferred to recipient untreated HEK293 cells, which were subsequently exposed to the GFP-expressing VSVΔ51-GFP (multiplicity of infection = 0.01). Virus replication was visualized by fluorescence microscopy. Scale bar, 1 mm (H) and the GFP signal was quantified (I). (J) GFP control, v5-GIGYF1, or the 4EHP-binding mutant (Y39A, Y41A, M46A, L47A) v5-GIGYF1-Mut plasmids were transfected into the WT or GIGYF1-KO cells. IFN-β ELISA was performed following 6 hours of poly(I:C) (1 μg/ml) stimulation. Data are presented as mean ± SD (n = 3). ns, nonsignificant, *P < 0.05, ****P < 0.0001; one-way analysis of variance (ANOVA) with Bonferroni’s post hoc test.
Fig. 2.
Fig. 2.. The C-terminal region of GIGYF1 is required for translational repression of target mRNAs.
(A) Top: Schematic representation of the psiCHECK2-RL-Ifnb1 3′UTR reporter. Bottom: WT and GIGYF1-KO HEK293 cells were cotransfected with psiCHECK2-RL-Ifnb1 3′UTR reporter or the psiCHECK2-RL reporter without the Ifnb1 3′UTR and a firefly luciferase (FL) reporter. Eighteen hours after transfection, cells were mock-treated or stimulated with poly(I:C) (0.05 μg/ml) for 12 hours, followed by measurement of luciferase activities. Renilla luciferase (RL) values were normalized against FL, and the ratios were calculated for the psiCHECK2-RL-Ifnb1 3′UTR relative to the control psiCHECK2-RL reporter for each condition. (B) Schematic representation of the λN:BoxB tether-function system with the deadenylation-permissive RL-5boxB-polyA and deadenylation-resistant RL-5boxB-HhR reporters. (C) Analysis of the relative silencing of the RL-5boxB-polyA and RL-5boxB-HhR upon tethering with λN-v5-GIGYF1 or λN-v5-GIGYF2 in HEK293 cells. (D) Schematic of the domain structures of WT and mutated GIGYF1 isoforms used in (E) and (F). Images were generated with BioRender.com. (E) Tether-function assay in GIGYF1-KO HEK293 cells cotransfected with the indicated plasmid, RL-5BoxB-HhR and FL, followed by dual-luciferase measurement 24 hours after transfection. (F) ELISA measurement of IFN-β production in GIGYF1-KO HEK293 cells overexpressing the full-length or indicated mutant GIGYF1 isoforms, following 6 hours of treatment with poly(I:C) (1 μg/ml). (G) Schematic domain structures of WT GIGYF1 and GIGYF2 and chimeric constructs derived from the N terminus of GIGYF1 and C terminus of GIGYF2 (Chimera A) or N terminus of GIGYF2 and C terminus of GIGYF1 (Chimera B). Images were generated with BioRender.com. (H) Tether-function assay for measurement of repression of the RL-5BoxB-HhR reporter with the indicated constructs in GIGYF1/2-DKO HEK293 cells. Data are presented as mean ± SD (n = 3). *P < 0.05, **P < 0.01, ****P < 0.0001; two-way ANOVA [(A) and (C)] or one-way [(E), (F), and (H)] ANOVA with Bonferroni’s post hoc test.
Fig. 3.
Fig. 3.. The C-terminal domain of GIGYF1 mediates its interaction with the eIF3 complex.
(A) Co-IP for detection of interaction between FLAG-eIF3L and indicated proteins in HEK293T cells. Cell lysates were prepared 24 hours after transfection for immunoprecipitation using an anti-FLAG antibody followed by WB with indicated antibodies. (B and C) Left: PLA for detection of interactions between GIGYF1 and indicated subunits of eIF3 complex. Sites of interactions are visualized as fluorescent punctate in HEK293T cells transfected with vectors expressing v5-GIGYF1 or v5-GIGYF2 together with FLAG-eIF3L (B) or FLAG-eIF3E (C). PLA signals are shown in yellow. The nucleus and actin cytoskeleton were counterstained with 4′,6-diamidino-2-phenylindole (DAPI) and phalloidin (red), respectively. Scale bar, 10 μm. Right: Bar graph represents the number of PLA signals from at least 30 cells, counted in each sample. n = 5 independent experiments. (D) Left: HEK293T cells were cotransfected with FLAG-eIF3L and the v5-tagged full-length or indicated truncated isoforms of GIGYF1 (see fig. S4K for more details). PLA signals are shown in yellow. The nucleus and actin cytoskeleton were counterstained with DAPI and phalloidin (red), respectively. Scale bar, 10 μm. Right: Bar graph represents the number of PLA signals from at least 20 cells, counted in each sample. n = 3 independent experiments. (E) Left: PLA for detecting the interactions between eIF3L and the indicated chimeric constructs (described in Fig. 2G). Right: Bar graph represents the number of PLA signals from at least 20 cells, counted in each sample. Scale bar, 10 μm. n = 3 independent experiments. Data are presented as mean ± SD (n = 3). ****P < 0.0001; unpaired t test [(B) and (C)] or one-way ANOVA with Bonferroni’s post hoc test [(D) and (E)].
Fig. 4.
Fig. 4.. GIGYF1 disrupts the interaction between eIF4G1 and eIF3 subunits.
(A) Schematic depiction of the subunits of eIF3 at the interface of eIF3-eIF4G1 interaction. Image was generated with BioRender.com. (B) Co-IP assay for detection of the impact of ectopically expressed GIGYF1 on interaction between eIF3D and indicated proteins in GIGYF1-KO HEK293 cells. (C and D) Left: PLA for detection of the impact of ectopic expression of v5-GIGYF1 on eIF4G-eIF3D (C) or eIF4G1-eIF4A1 (D) interactions in GIGYF1-KO HEK293 cells. Twenty-four hours after transfection, cells were fixed and subjected to PLA using HA and FLAG antibodies. Right: Bar graphs represent the number of PLA signals from at least 20 cells, counted in each sample. n = 3 independent experiments. Scale bar, 10 μm. Data are presented as mean ± SD (n = 3). ****P < 0.0001; unpaired t test. (E and F) Streptavidin-biotin RNA affinity purification assay with biotinylated Ifnb1 3′UTR in parental (E) or GIGYF1-KO (F) HEK293 cells. Biotinylated Ifnb1 3′UTR was incubated with cell lysates in the presence or absence of 10X nonbiotinylated Ifnb1 3′UTR for 16 hours at 4°C. The pulled-down proteins were subjected to Western blotting and probed with the indicated antibodies. (G) Streptavidin-biotin RNA affinity purification assay with biotinylated Ifnb1 3′UTR and lysates from GIGYF1-KO cells expressing v5-GIGYF1 or GYF motif mutant v5-GIGYF1. (H) Streptavidin-biotin RNA affinity purification assay with biotinylated Ifnb1 3′UTR in TTP-depleted cells. Biotinylated Ifnb1 3′UTR was incubated with lysates derived from HEK293 cells treated with control siRNA (si-Con) or si-TTP, followed by Western blotting and probing with the indicated antibodies. (I) Co-IP assay for detection of the impact of mutating the GYF motif on the interaction between GIGYF1, eIF3D, eIF3E, and TTP in GIGYF1-KO HEK293 cells.
Fig. 5.
Fig. 5.. Poly(I:C) stimulation induces GIGYF1-mediated disruption of the eIF3/eIF4G1 interaction.
(A) Left: Co-IP for detection of interaction between endogenous eIF3L and GIGYF1 or eIF4G1 upon poly(I:C) stimulation. Right: Quantification of the indicated coprecipitated proteins, normalized to eIF3L. n = 3 independent experiments. (B) Left: PLA for detection of interactions between v5-GIGYF1 and FLAG-eIF3D upon poly(I:C) stimulation. PLA signals are shown in yellow; the nucleus and actin cytoskeleton were counterstained with DAPI and phalloidin (red), respectively. Scale bar, 10 μm. Right: Bar graph represents the number of PLA signals from at least 20 cells, counted in each sample. n = 3 independent experiments. (C) WB analysis of cell lysates from (B). (D) Left: PLA for detection of interactions between HA-eIF4G1 and FLAG-eIF3D upon poly(I:C) stimulation. Right: Bar graph represents the number of PLA signals from at least 20 cells, counted in each sample. Scale bar, 10 μm. n = 3 independent experiments. (E) WB analysis of cell lysates from (D). (F) Co-IP assay for detection of the interaction between GIGYF1, eIF3D, and eIF2α in GIGYF1-KO HEK293 cells transfected with v5-tagged full-length or N-terminal fragment (amino acids 1 to 239) of GIGYF1. (G) Co-IP assay for detection of the interaction between endogenous eIF4G1, eIF3, and eIF2α proteins in WT and GIGYF1-KO cells upon poly(I:C) stimulation. (H) Biotinylated Ifnb1 3′UTR was incubated with lysates from vehicle or poly(I:C)-treated HEK293 cells. The pulled-down proteins were subjected to WB and probed with the indicated antibodies. (I) RNA-IP and qRT-PCR analysis of the association between v5-GIGYF1 and Ifnb1 mRNA in vehicle or poly(I:C)-treated HEK293 cells. Data are presented as mean ± SD (n = 3). *P < 0.05, **P < 0.01, ****P < 0.0001; unpaired t test [(A), (B), and (D)] or two-way ANOVA with Bonferroni’s post hoc in (I).
Fig. 6.
Fig. 6.. The mechanism of GIGYF1-mediated repression of the cap-dependent mRNA translation initiation.
Proposed model for mechanism of translational repression of the Ifnb1 mRNA by GIGYF1. Left: Cap-dependent translation initiation involves the recognition of the m7G cap by the eIF4F complex, comprising eIF4E, eIF4A, and eIF4G1. The eIF3 complex serves as a bridge between eIF4G1 and the PIC. Upon recruitment by eIF3, the PIC scans the 5′UTR until it reaches the translation start codon. Subsequently, it recruits the 60S ribosomal subunit, leading to the assembly of the 80S ribosome and the beginning of the elongation phase. Right: Upon recruitment to an mRNA by RBPs, typically through GYF:PRS motifs, the C-terminal region of GIGYF1 binds to the subunits of eIF3 at the interface of the eIF3:eIF4G interaction. This binding effectively disrupts the crucial eIF3/eIF4G interaction, thereby repressing mRNA translation initiation. Images were generated with BioRender.com.

References

    1. Hinnebusch A. G., Ivanov I. P., Sonenberg N., Translational control by 5′-untranslated regions of eukaryotic mRNAs. Science 352, 1413–1416 (2016). - PMC - PubMed
    1. Valášek L. S., Zeman J., Wagner S., Beznosková P., Pavlíková Z., Mohammad M. P., Hronová V., Herrmannová A., Hashem Y., Gunišová S., Embraced by eIF3: Structural and functional insights into the roles of eIF3 across the translation cycle. Nucleic Acids Res. 45, 10948–10968 (2017). - PMC - PubMed
    1. Wagner S., Herrmannová A., Malík R., Peclinovská L., Valášek L. S., Functional and biochemical characterization of human eukaryotic translation initiation factor 3 in living cells. Mol. Cell. Biol. 34, 3041–3052 (2014). - PMC - PubMed
    1. Aguero T., Jin Z., Chorghade S., Kalsotra A., King M. L., Yang J., Maternal Dead-end 1 promotes translation of nanos1 by binding the eIF3 complex. Development 144, 3755–3765 (2017). - PMC - PubMed
    1. Grzmil M., Rzymski T., Milani M., Harris A. L., Capper R. G., Saunders N. J., Salhan A., Ragoussis J., Norbury C. J., An oncogenic role of eIF3e/INT6 in human breast cancer. Oncogene 29, 4080–4089 (2010). - PubMed

Publication types

MeSH terms

LinkOut - more resources