. 2024 Jul 16;5(7):101649.
doi: 10.1016/j.xcrm.2024.101649.

PARP11 inhibition inactivates tumor-infiltrating regulatory T cells and improves the efficacy of immunotherapies

Affiliations

PARP11 inhibition inactivates tumor-infiltrating regulatory T cells and improves the efficacy of immunotherapies

Raghavendra Basavaraja et al. Cell Rep Med. .

Abstract

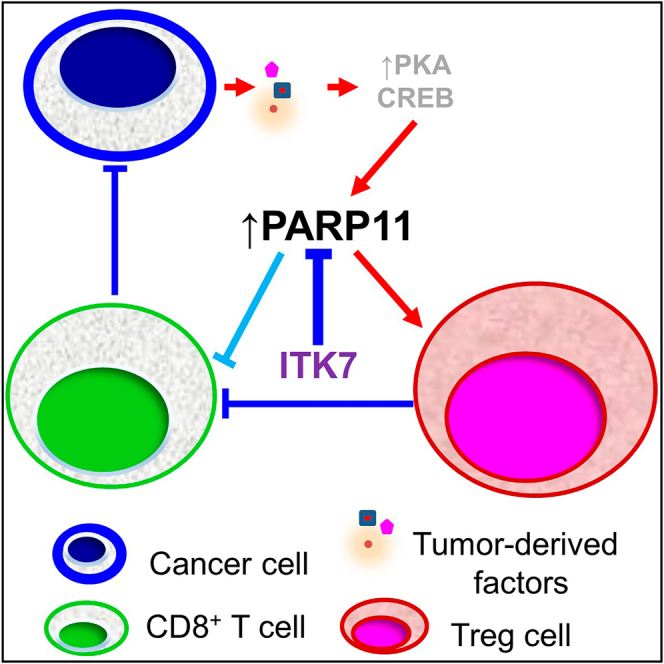
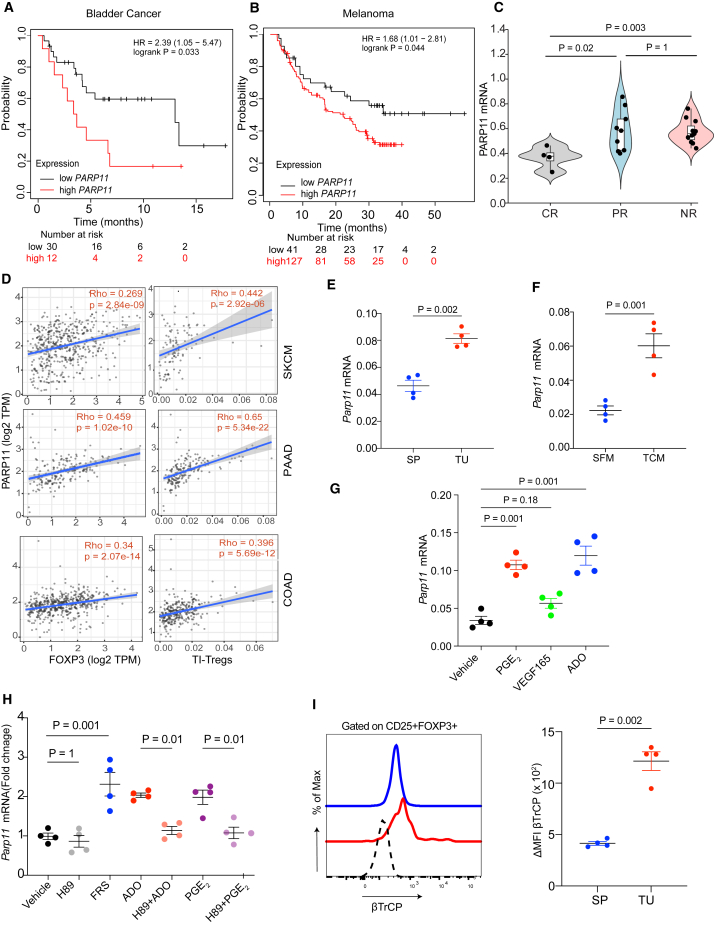
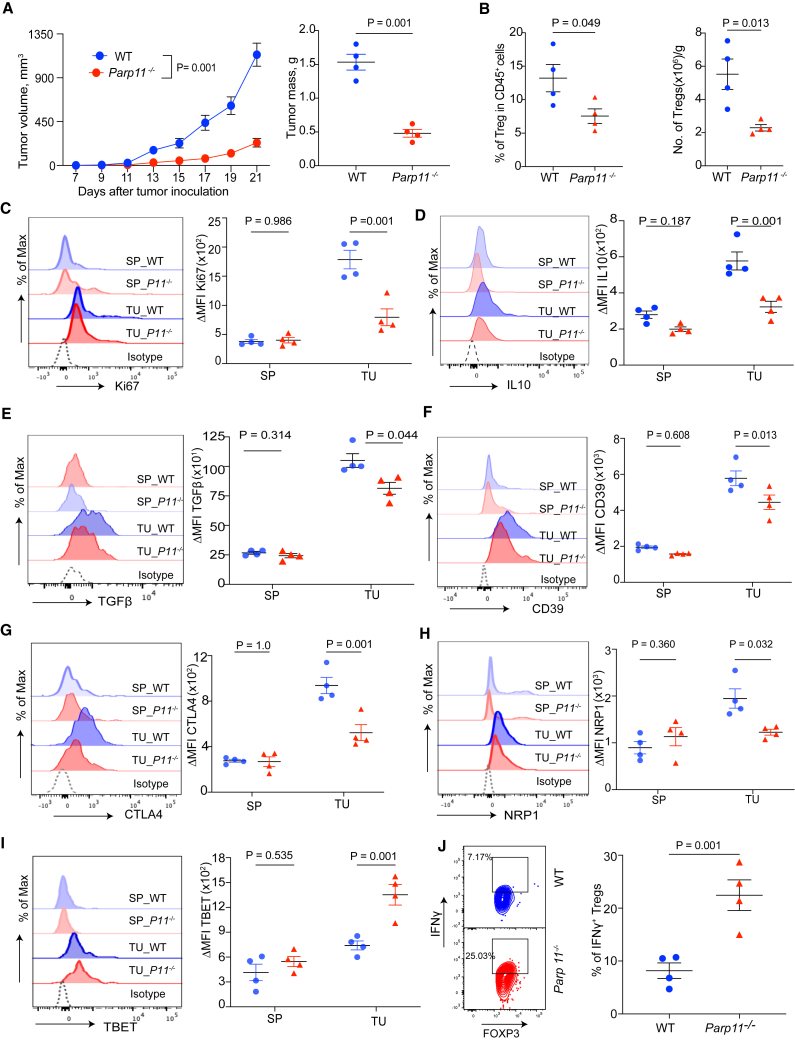
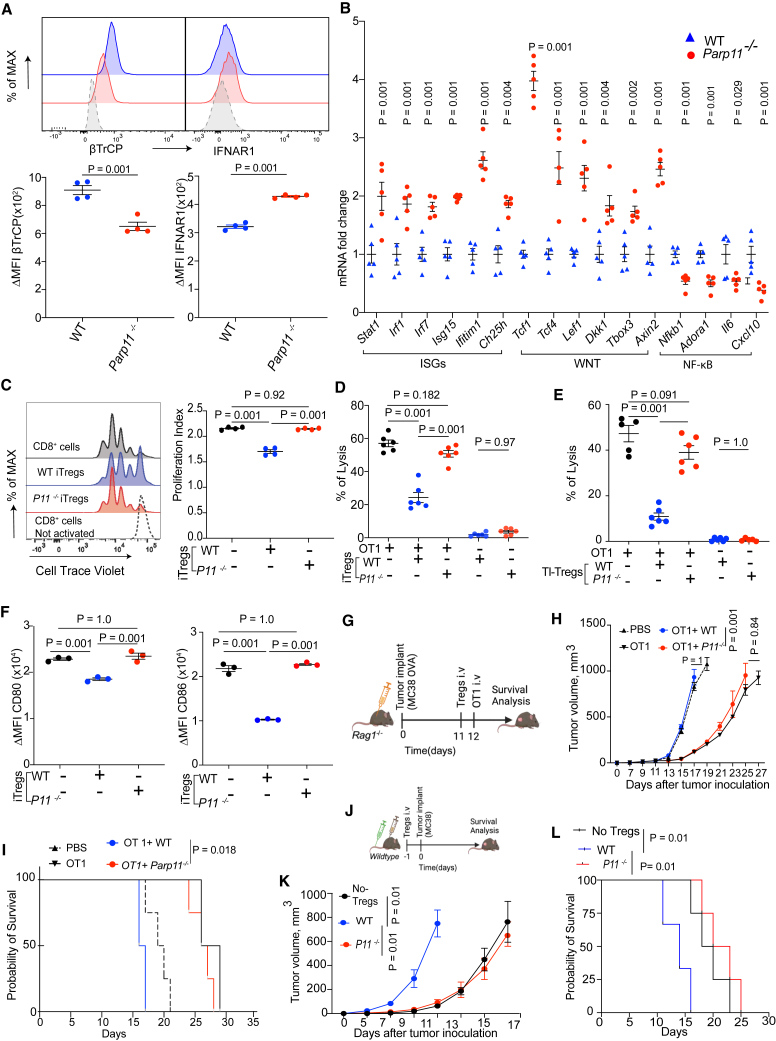
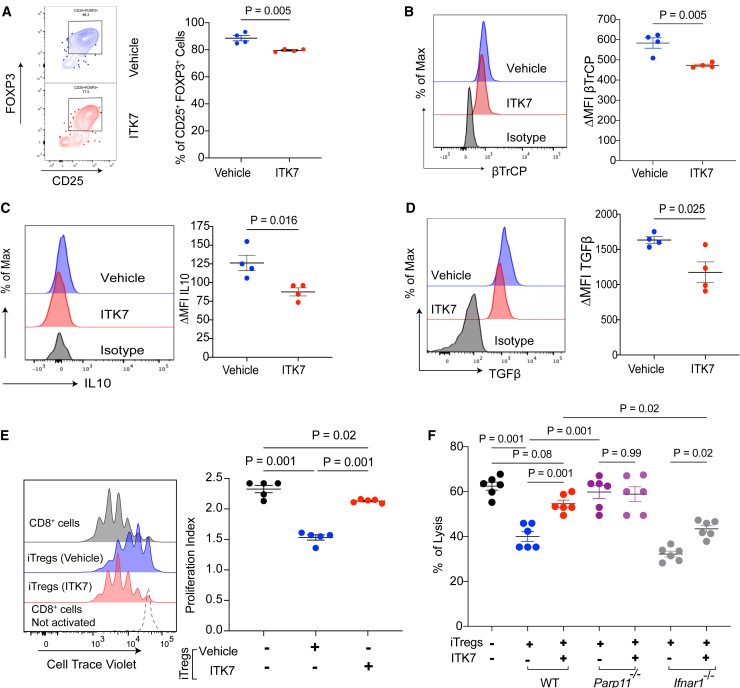
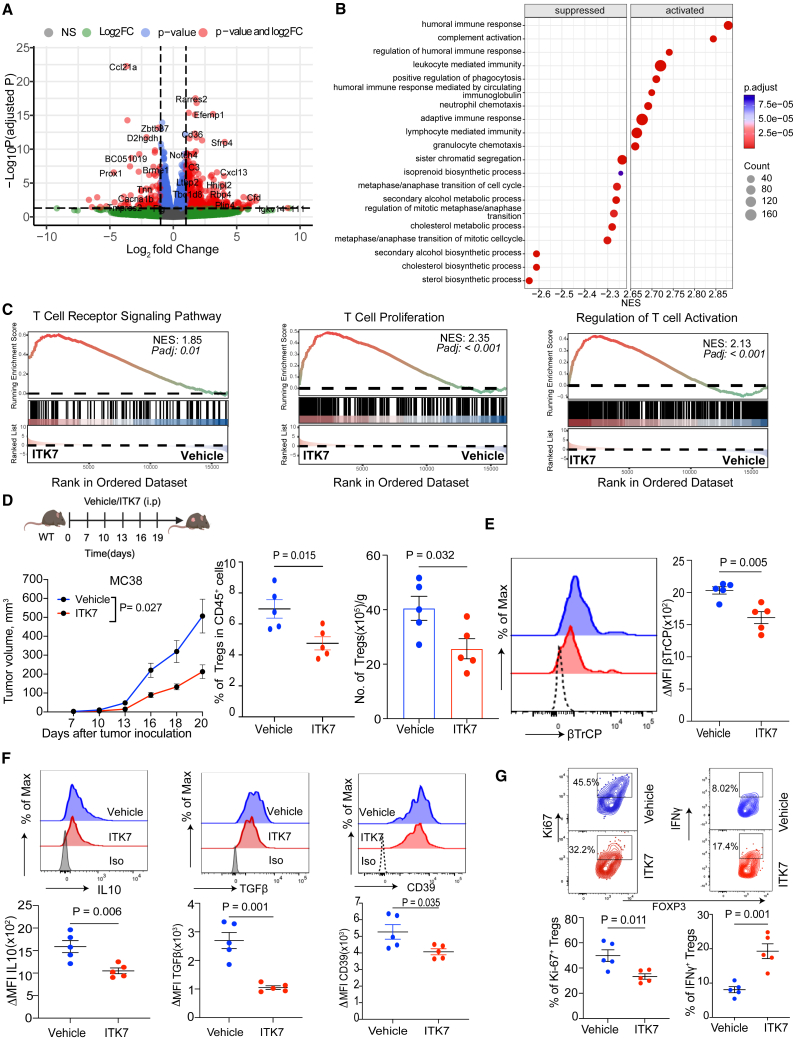
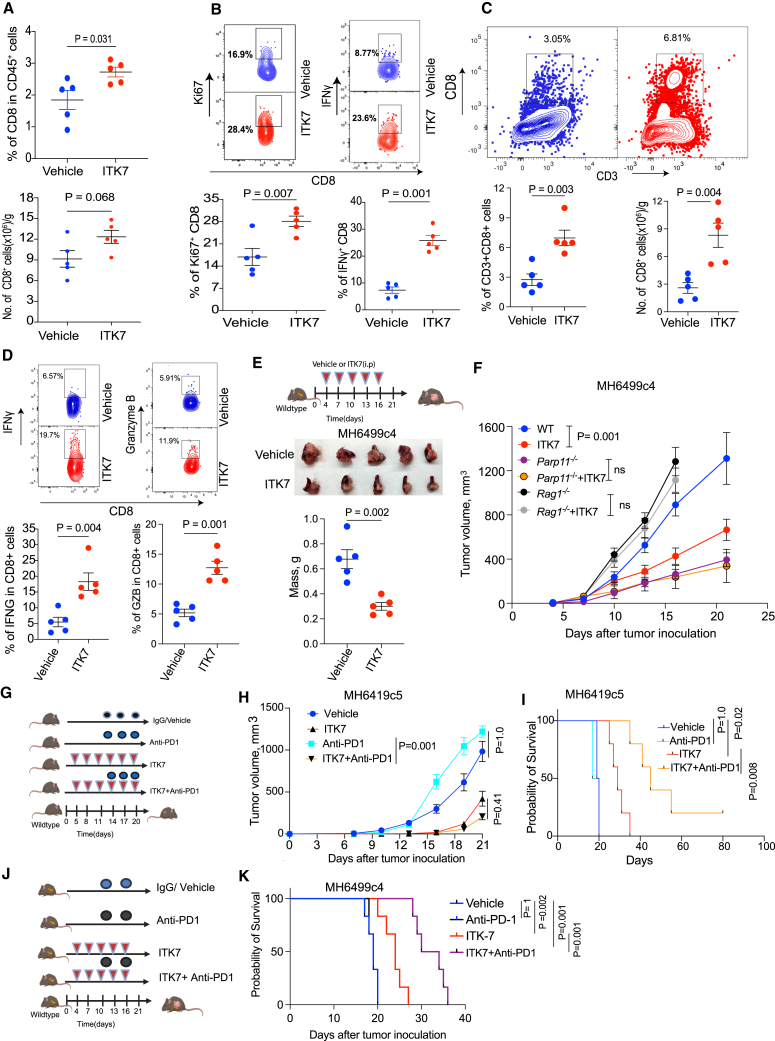
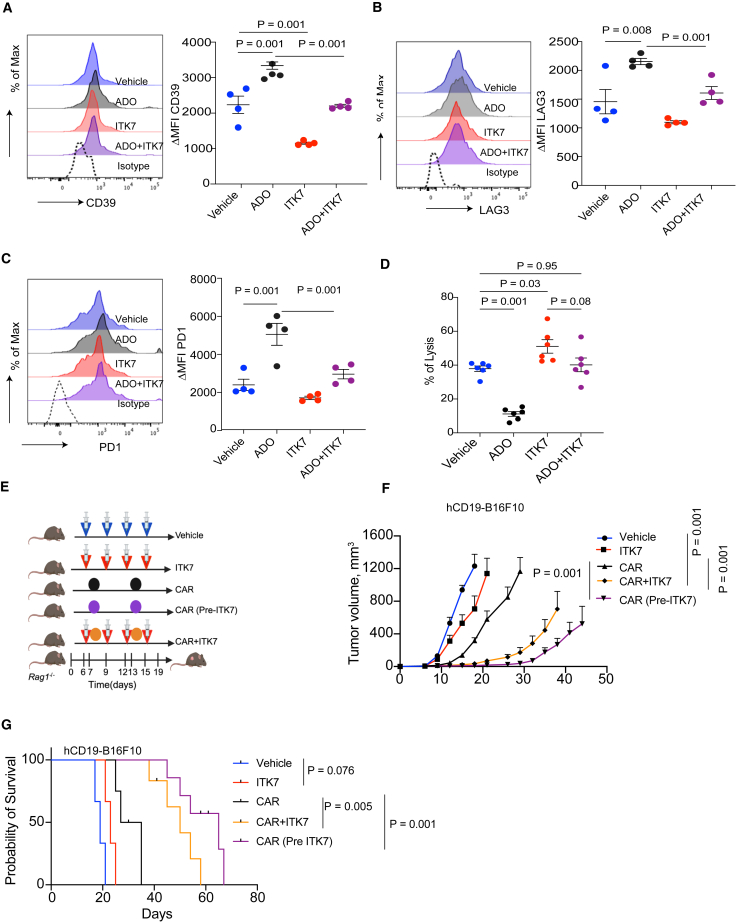
Tumor-infiltrating regulatory T cells (TI-Tregs) elicit immunosuppressive effects in the tumor microenvironment (TME) leading to accelerated tumor growth and resistance to immunotherapies against solid tumors. Here, we demonstrate that poly-(ADP-ribose)-polymerase-11 (PARP11) is an essential regulator of immunosuppressive activities of TI-Tregs. Expression of PARP11 correlates with TI-Treg cell numbers and poor responses to immune checkpoint blockade (ICB) in human patients with cancer. Tumor-derived factors including adenosine and prostaglandin E2 induce PARP11 in TI-Tregs. Knockout of PARP11 in the cells of the TME or treatment of tumor-bearing mice with selective PARP11 inhibitor ITK7 inactivates TI-Tregs and reinvigorates anti-tumor immune responses. Accordingly, ITK7 decelerates tumor growth and significantly increases the efficacy of anti-tumor immunotherapies including ICB and adoptive transfer of chimeric antigen receptor (CAR) T cells. These results characterize PARP11 as a key driver of TI-Treg activities and a major regulator of immunosuppressive TME and argue for targeting PARP11 to augment anti-cancer immunotherapies.

Keywords: ITK7; PARP11; PARP11 inhibitor; Treg cells; immunotherapy; tumor microenvironment.


Conflict of interest statement

Declaration of interests M.S.C. is an inventor on an OHSU patent related to the general use of the ITK7 compound. M.S.C., R.B., and S.Y.F. are co-inventors on a pending patent from OHSU/University of Pennsylvania related to ITK7 use.

Figures

None
Graphical abstract
Figure 1
Figure 1
Expression of PARP11 is upregulated in TI-Tregs and associated with failure of ICB therapies (A) Association between PARP11 expression and overall survival in patients with bladder cancer treated with pembrolizumab. (B) Association between PARP11 expression and overall survival in patients with metastatic melanoma treated with nivolumab. (C) PARP11 expression in patients with metastatic melanoma treated with pembrolizumab and grouped by indicated therapeutic outcomes: complete response (CR), partial response (PR), or non-responsive (NR). (D) Association between PARP11 expression with tumor-infiltrating Treg cells (TI-Tregs) and FOXP3 expression in human melanoma (skin cutaneous melanoma), pancreatic (pancreatic adenocarcinoma), and colon (colon adenocarcinoma) cancers. (E) qPCR analysis of Parp11 expression in Tregs cells isolated from tumors (TI-Treg, TU) or spleens (SP) from the Foxp3-YFP mice bearing MC38 s.c. tumors (n = 4). (F) qPCR analysis of Parp11 expression in iTregs exposed to B16F10 tumor conditioned media (TCM) or control serum-free media (SFM) for 12 h. (G) qPCR analysis of Parp11 expression in iTregs treated with vehicle or tumor-derived factors including PGE2 (1 μM), VEGFA (20 nM), or adenosine (1 mM) for 12 h (n = 4). (H) qPCR analysis of Parp11 expression in iTregs treated with forskolin (FRS; 10 μM), adenosine (ADO; 1 mM), or prostaglandin E2 (PGE2; 1 μM) with or without PKA inhibitor H89 (10 μM) for 6 h (n = 4). (I) Levels of βTrCP in the splenic Tregs or TI-Tregs isolated from MC38 s.c. tumor-bearing mice (n = 4). Data are presented as mean ± SEM. Statistical analysis was performed using 1-way ANOVA with Tukey’s multiple comparison test (C, G, and H) or two-tailed unpaired Student’s t test (E, F, and I). A p value of less than 0.05 was considered as statistically significant for all.
Figure 2
Figure 2
PARP11 supports immune-suppressive activities of TI-Tregs (A) Volume and mass (on day 21 after inoculation) of s.c. MC38 tumors growing in WT or Parp11 knockout mice (n = 4). (B) Frequencies (percentage of CD45+ cells) and absolute numbers (per gram of tumor tissue) of TI-Tregs isolated from MC38 tumor-bearing mice as indicated in (A). (C–I) Levels of Ki67, IL-10, TGFβ, CD39, CTLA4, NRP1, and TBET in the splenic Tregs (SP) and TI-Tregs (TU) isolated from WT (blue symbols) or Papr11−/− (red symbols) mice described in (A). (J) Flow cytometry analysis of percentage of IFN-γ+ Tregs isolated from mice described in (A). Data are presented as mean ± SEM. Statistical analysis was performed using 1-way ANOVA with Sidak’s multiple comparison test (C–I) or log rank test (A) or two-tailed unpaired Student’s t test (A, B, and J). A p value of less than 0.05 was considered as statistically significant for all.
Figure 3
Figure 3
Loss of PARP11 is associated with reduced immunoregulatory functions of Tregs (A) Levels of intracellular β-TrCP and cell surface IFNAR1 in iTregs derived from WT or Parp11−/− mice and normalized per FOXP3 levels (n = 4). (B) qPCR analysis of expression of genes representing IFN1 pathway (Stat1, Irf1, Irf7, Isg15, Ifitim1, and Ch25h), WNT pathway (Tcf1, Tcf4, lef1, Dkk1, TBox3, and Axin2), and NF-κB pathway (Nfkb1, Adoar1, Il6, and Cxcl13) in iTregs derived from WT or Parp11−/− mice and normalized per FOXP3 levels (n = 5). (C) Flow cytometry analysis and quantification of CD8+ T cell proliferation index in vitro. Activated WT CD8+ T cells stained with CellTrace Violet were co-cultured for 72 h with or without WT and Parp11−/− iTregs in the ratio 2:1 (n = 4). (D) Lysis of MC38OVA-luc cells by OT1 CTLs pre-incubated for 24 h with or without WT or Parp11−/− iTregs (OT1: iTreg = 3:1; OT1: MC38OVA-luc = 10:1; n = 6). (E) Lysis of MC38OVA-luc cells by OT1 CTLs pre-incubated for 24 h with or without TI-Treg cells isolated from MC38 tumors growing in WT or Parp11−/− mice (OT1: Treg = 2:1; OT1: MC38OVA-luc = 10:1; n = 6). (F) Cell surface levels of CD80 and CD86 on CD11c+MHCII+ dendritic cells upon being co-cultured (1:1) with WT or Parp11−/− iTregs for 18 h (n = 3). Representative raw data are shown in Figure S3H. (G) Schematic depiction of experiment to test comparative immunosuppressive activities of WT or Parp11−/− iTregs (2.5×10⁶ cells/mouse) administered into MC38OVA tumor-bearing immunocompromised host (Rag1−/−) in vivo before adoptive transfer of OT1 CTLs (5 × 106 cells/mouse) (n = 3–5). (H) Volume of MC38OVA s.c. tumors in mice described in (G). (I) Kaplan-Meier analysis of survival of MC38OVA tumor-bearing mice described in (G). (J) Schematic depiction of experiment to test comparative immunosuppressive activities of WT or Parp11−/− iTregs (1×10⁶ cells/mouse) administered into C57BL/6 hosts before inoculation of MC38 tumors (1×10⁶ cells/mouse, n = 4–5). (K) Volume of s.c. MC38 tumors in mice described in (J). (L) Kaplan-Meier analysis of survival of MC38 tumor-bearing mice as described in (J) (n = 4–5). Data are presented as mean ± SEM. Statistical analysis was performed using 2-tailed unpaired Student’s t test (A and B), 1-way ANOVA with Tukey’s multiple comparison test (C, D, E, F, H, and K), or log rank test (I and L). A p value of less than 0.05 was considered as statistically significant for all.
Figure 4
Figure 4
PARP11-specific inhibitor ITK7 mimics the loss of PARP11 phenotype on Tregs suppressive function (A) Frequencies of CD25+FOXP3+ cells (percentage of CD4+ cells) within the WT iTreg population pre-exposed or not to ITK7 (5 nM) for 48 h (n = 4). (B–D) Levels of β-TrCP, IL-10, and TGF-β in iTreg cells treated as described in (A). (E) Flow cytometry analysis and quantification of CD8+ T cell proliferation index in vitro. Activated WT CD8+ T cells stained with CellTrace Violet were co-cultured for 72 h with or without WT iTreg cells (Treg:CD8 = 1:2) pre-treated or not with ITK7 (5 nM, 48 h) (n = 5). (F) Lysis of MC38OVA-luc cells by OT1 CTLs pre-incubated (OT1:iTreg = 3:1; OT1:MC38OVA-lu = 10:1; n = 6) for 48 h with iTregs derived from mice of indicated genotype (WT, Parp11−/−, or Ifnar1−/−). These iTreg cells were pre-exposed to ITK7 (5 nM, 48 h) or vehicle. Data are presented as mean ± SEM. Statistical analysis was performed using 2-tailed unpaired Student’s t test (A–D) and 1-way ANOVA with Tukey’s multiple comparison test (E and F). A p value of less than 0.05 was considered as statistically significant.
Figure 5
Figure 5
Selective PARP11 inhibitor ITK7 disrupts the immune-suppressive activities of TI-Tregs and activates the immune pathways in the TME (A) Enhanced volcano plot of differentially expressed genes in MC38 s.c. tumors from mice administered with ITK7 (100 μg/mouse intraperitoneally [i.p.]) on days 7, 10, 13, 16, and 19 and harvested on day 20 after tumor inoculation (n = 2). (B) Top 20 significantly enriched suppressed and activated gene set enrichment analysis (GSEA) pathways in MC38 tumors described in (A). Color indicates the adjusted p values and dot size indicates the number of genes within a particular pathway. (C) GSEA and Kyoto Encyclopedia of Genes and Genomes plots of indicated signatures detected in MC38 tumors described in (A). (D) Growth s.c. MC38 tumors and TI-Tregs frequencies (percentage of CD45+) and numbers (per gram of tumor tissue) in mice treated with vehicle or ITK7 (100 μg/mouse) as shown in the schema (n = 5). (E) Levels of β-TrCP on TI-Tregs isolated from MC38 tumors described in (D). (F) Levels of IL-10, TGF-β, and CD39 in TI-Tregs from tumors described in (D). (G) Flow cytometry analysis of percentage of Ki-67+ and IFN-γ+ Tregs isolated from MC38 tumors described in (D) (n = 5). Data are presented as mean ± SEM. Statistical analysis was performed with 2-tailed unpaired Student’s t test (D–G) or 1-way ANOVA with Tukey’s multiple comparison test (for tumor volumes shown in D). A p value of less than 0.05 was considered as statistically significant for all.
Figure 6
Figure 6
ITK7 reactivates CTLs and elicits anti-tumor effects alone and in combination with immunotherapies (A) Frequencies (percentage of CD45+) and numbers (per gram of tumor) of CD8+ cells from s.c. MC38 tumors described in 5D (n = 5). (B) Flow cytometry analysis of percentage of Ki67+ and IFN-γ+ among the CD8+ CTLs T cells from MC38 tumors described in 5D (n = 5). (C) Frequencies (percentage of CD45+) and numbers (per gram of tumor) of CD8+ cells from orthotopic PDAC MH6499c4 tumors (n = 5). (D) Flow cytometry analysis of percentage of IFN-γ+ and granzyme B among the CD8+ CTLs T cells from orthotopic PDAC MH6499c4 tumors (n = 5). (E) Schematic illustration and tumor mass of testing the anti-tumor efficacy of ITK7 (100 μg/mouse) against orthotopic MH6499C4 tumors in syngeneic WT mice. Mice were sacrificed on day 20 (n = 5). (F) Volume of s.c. MH6499c4 tumors in WT, Parp11−/−, or Rag1−/− mice treated with either vehicle or ITK7 (100 μg/mouse i.p.) on days 4, 7, 10, 13, and 16 after tumor inoculation (n = 5). (G) Schematic illustration of testing the anti-tumor effects of anti-PD1 (200 μg/mouse) and ITK7 (100 μg/mouse) against s.c. cold MH6419c5 tumors in syngeneic WT mice (n = 3–6). (H) Volume of s.c. MH6419c5 tumors described in (G). (I) The Kaplan-Meier survival analysis of MH6419c5 tumor-bearing mice described in (G). Mice were sacrificed when the tumor volume reached 1,000 mm3. (J) Schematic illustration of testing the anti-tumor effects of anti-PD1 (200 μg/mouse) and ITK7 (100 μg/mouse) against orthotopic MH6499C4 tumors in syngeneic WT mice (n = 6). (K) The Kaplan-Meier survival analysis of MH6499C4 tumor-bearing mice described in (J). Mice were sacrificed when they became moribund. Data are presented as mean ± SEM. Statistical analysis was performed with 2-tailed unpaired Student’s t test (A–E), 1-way ANOVA with Tukey’s multiple comparison test (F and H) or log rank test (I and K). A p value of less than 0.05 was considered as statistically significant for all.
Figure 7
Figure 7
ITK7 improves the efficacy of CAR T therapy (A–C) Levels of CD39, LAG3, and PD1 in CAR T cells after their pre-incubation with either a vehicle or ITK7 (10 nM) for 72 h, followed by additional treatment with or without adenosine (ADO, 1 μM, 24 h; n = 4). (D) Lysis of hCD19-B16F10 cells by hCD19 CAR T cells treated as in (A) (n = 6). (E) Schematic illustration of experiments combing CD19 CAR T cell therapy with ITK7 (100 μg/mouse) against s.c. hCD19-B16F10 tumors growing in Rag1−/− mice. (F) Volume of hCD19-B16F10 s.c. tumors growing in Rag1−/− mice treated as described in (E). Treatments included anti-hCD19 CAR T cells (1.5×10⁶/mouse, intravenously), pre-treated or not in vitro with ITK7 (10 nM; 72 h; n = 6), vehicle (DMSO, n = 3), ITK7 (100 μg/mouse, i.p., n = 3), or combination of ITK7 and CAR T cells administered into mice separately (n = 5). (G) The Kaplan-Meier analysis of survival of mice described in (F). Mice were sacrificed when the tumor volume reached 1,000 mm3. Data are presented as mean ± SEM. Statistical analysis was performed using 1-way ANOVA with Tukey’s multiple comparison test (A–F) or log rank test (G). A p value of less than 0.05 was considered as statistically significant for all.

References

    1. Bagchi S., Yuan R., Engleman E.G. Immune Checkpoint Inhibitors for the Treatment of Cancer: Clinical Impact and Mechanisms of Response and Resistance. Annu. Rev. Pathol. 2021;16:223–249. doi: 10.1146/annurev-pathol-042020-042741. - DOI - PubMed
    1. Ribas A., Wolchok J.D. Cancer immunotherapy using checkpoint blockade. Science. 2018;359:1350–1355. doi: 10.1126/science.aar4060. - DOI - PMC - PubMed
    1. Kronig M.N., Wehrli M., Salas-Benito D., Maus M.V. Hurdles race for CAR T-cell therapy in digestive tract cancer. Immunol. Rev. 2023;320:100–119. doi: 10.1111/imr.13273. - DOI - PMC - PubMed
    1. Hanahan D., Coussens L.M. Accessories to the crime: functions of cells recruited to the tumor microenvironment. Cancer Cell. 2012;21:309–322. doi: 10.1016/j.ccr.2012.02.022. - DOI - PubMed
    1. Joyce J.A., Fearon D.T. T cell exclusion, immune privilege, and the tumor microenvironment. Science. 2015;348:74–80. doi: 10.1126/science.aaa6204. - DOI - PubMed

MeSH terms

Substances