. 2024 Jul 16;5(7):101646.
doi: 10.1016/j.xcrm.2024.101646.

Aberrant bowel movement frequencies coincide with increased microbe-derived blood metabolites associated with reduced organ function

Affiliations

Aberrant bowel movement frequencies coincide with increased microbe-derived blood metabolites associated with reduced organ function

Johannes P Johnson-Martínez et al. Cell Rep Med. .

Abstract

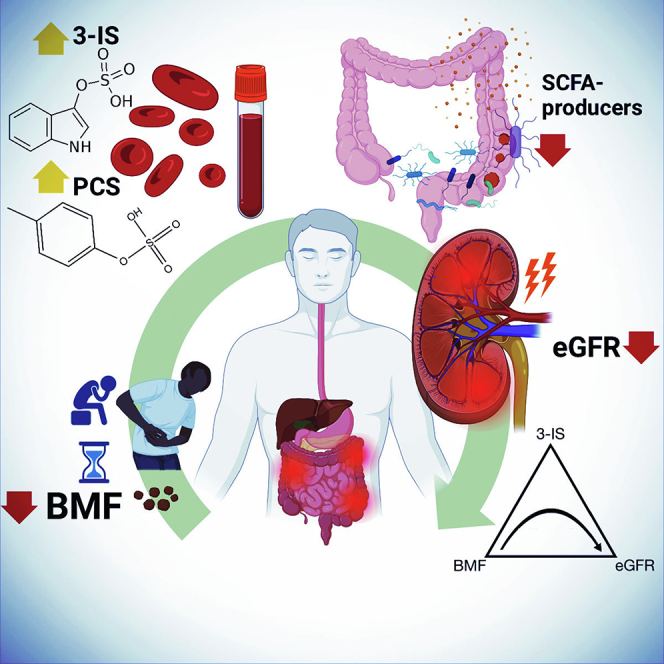
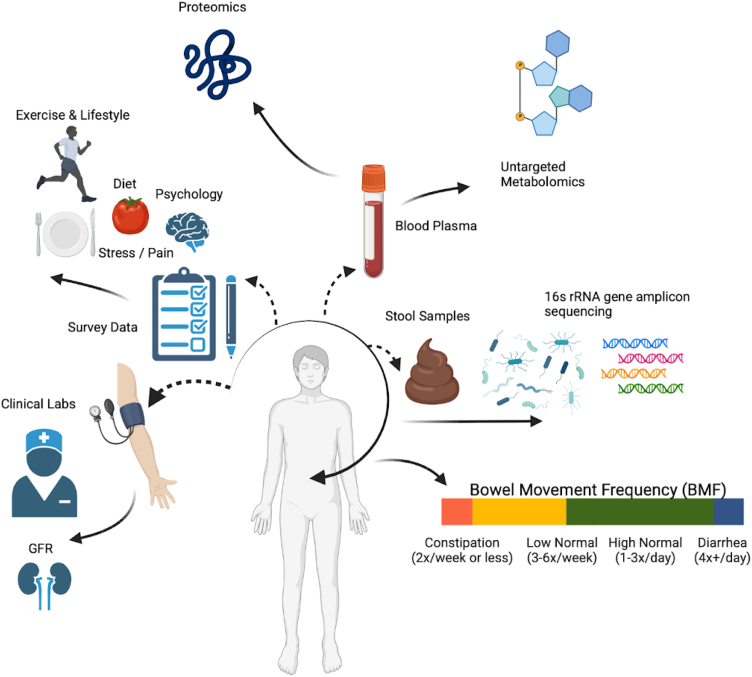
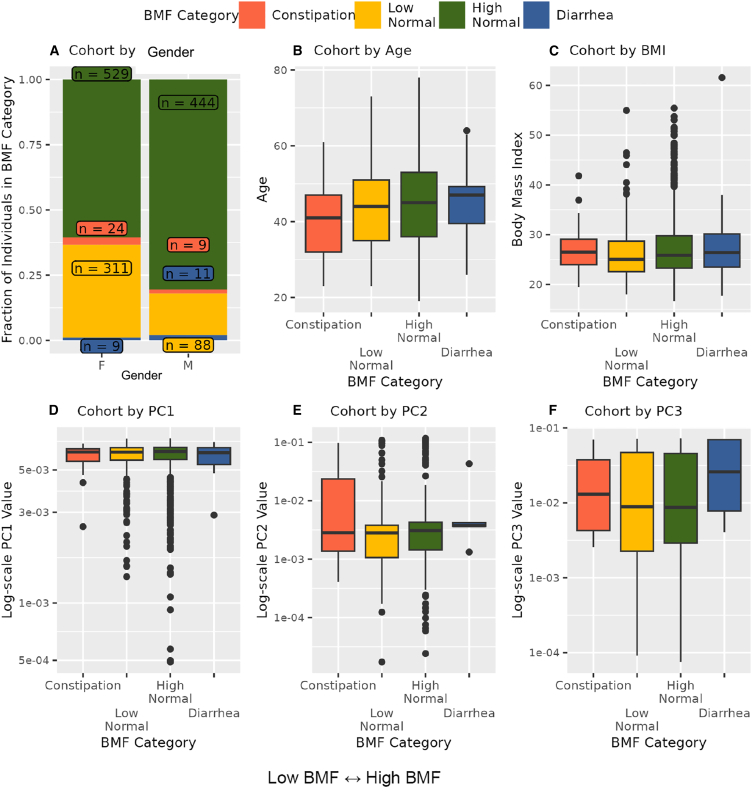
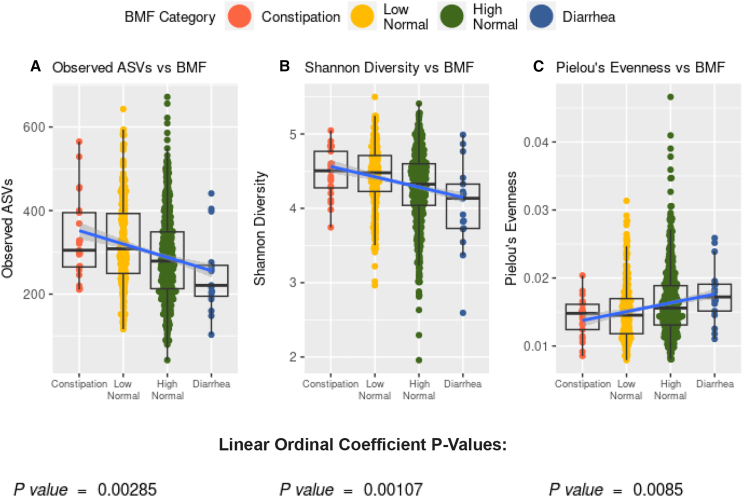
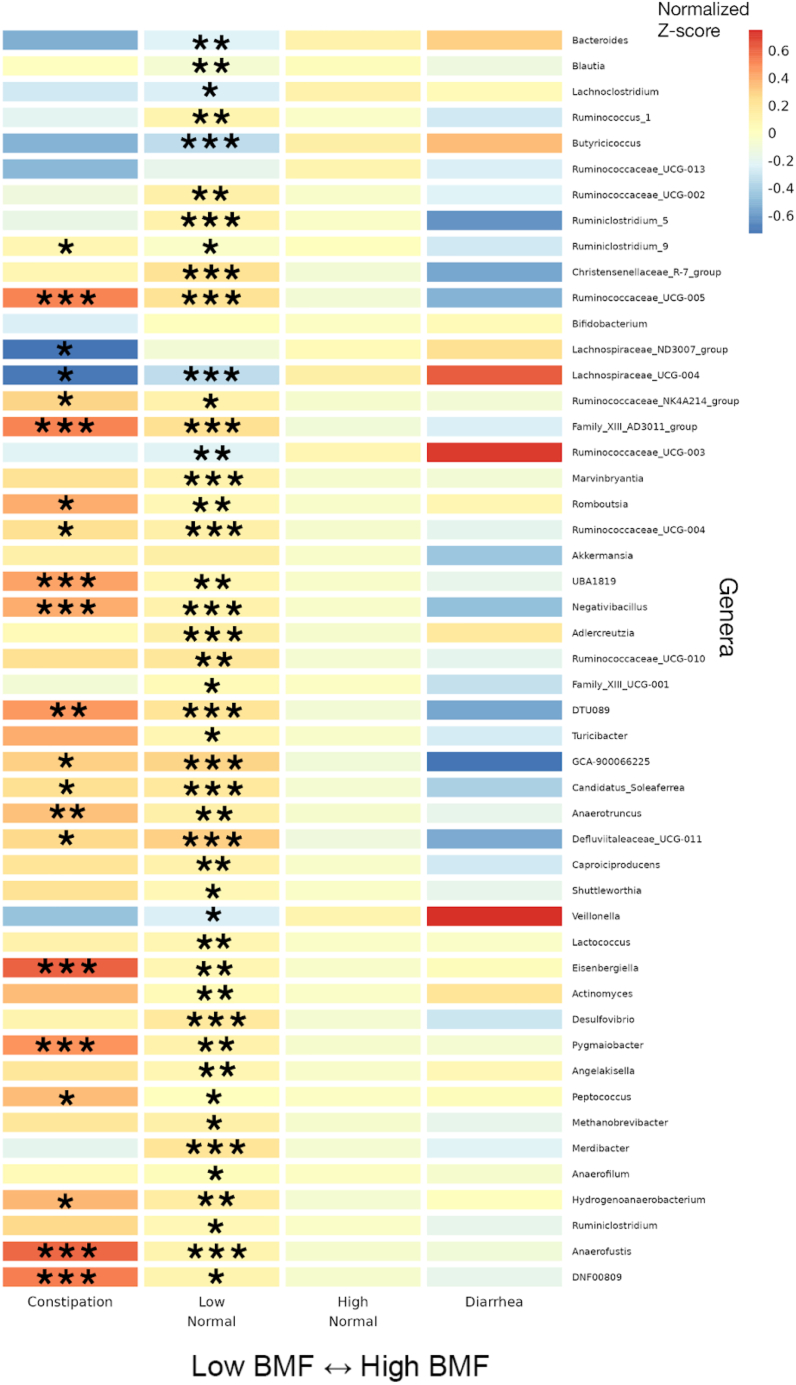
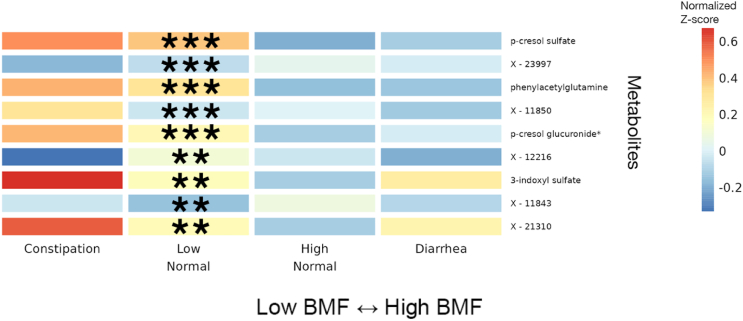
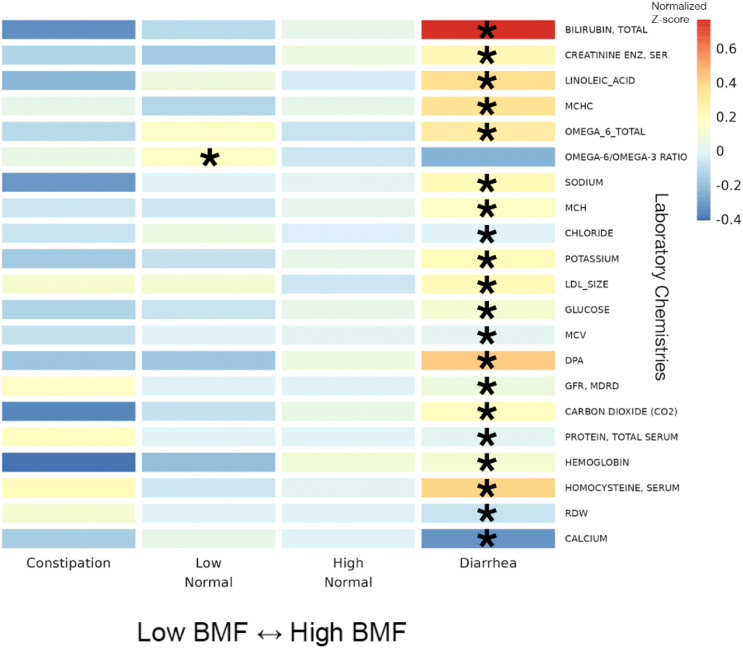
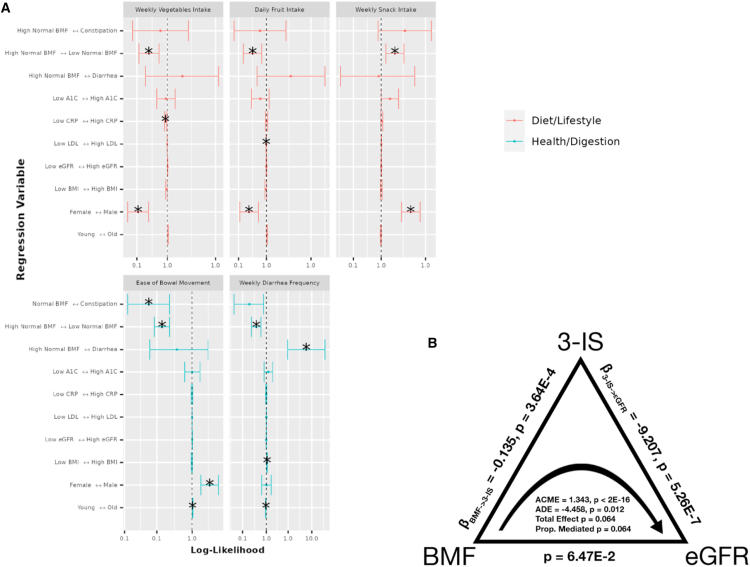
Bowel movement frequency (BMF) directly impacts the gut microbiota and is linked to diseases like chronic kidney disease or dementia. In particular, prior work has shown that constipation is associated with an ecosystem-wide switch from fiber fermentation and short-chain fatty acid production to more detrimental protein fermentation and toxin production. Here, we analyze multi-omic data from generally healthy adults to see how BMF affects their molecular phenotypes, in a pre-disease context. Results show differential abundances of gut microbial genera, blood metabolites, and variation in lifestyle factors across BMF categories. These differences relate to inflammation, heart health, liver function, and kidney function. Causal mediation analysis indicates that the association between lower BMF and reduced kidney function is partially mediated by the microbially derived toxin 3-indoxyl sulfate (3-IS). This result, in a generally healthy context, suggests that the accumulation of microbiota-derived toxins associated with abnormal BMF precede organ damage and may be drivers of chronic, aging-related diseases.

Keywords: bowel movement frequency; chronic disease; gut microbiome; health; lifestyle; protein fermentation; short chain fatty acids.


Conflict of interest statement

Declaration of interests L.H. is a former shareholder of Arivale. A.T.M. was a former employee of Arivale. Arivale is no longer a commercially operating company as of April 2019.

Figures

None
Graphical abstract
Figure 1
Figure 1
Data collection strategy Arivale participants were sampled for blood plasma and stool, in addition to filling out extensive diet, health, and lifestyle questionnaires. Clinical chemistries, untargeted metabolomics, and proteomics data were generated from blood plasma samples. Gut microbiome 16S rRNA amplicon sequencing data were generated from stool samples collected using at-home kits. BMF data were extracted from the questionnaire data as self-reported frequencies per week or day.
Figure 2
Figure 2
Exploring covariate associations with bowel movement frequency (BMF) Plotting covariates that showed a significant association with BMF: gender, age, BMI, and the first three principal components of genetic ancestry (PC1-PC3) (A–F). POLR was used to regress BMF against the covariates (gender, age, BMI, eGFR, LDL, CRP, A1C, plus the first three principal components of genetic ancestry in the cohort, PC1, PC2, and PC3). The result was that gender (p = 3.68E−16), BMI (p = 1.82E−3), age (p = 2.075E−3), and PCs 1–3 (p < 0.00001, respectively) were significantly associated with BMF. In panels (B)–(E), center lines on boxplots represent the median, the top and bottom edges of the box represent the interquartile range, the black dots show points more than 1.5 times the interquartile range from the ends of the box, and the whiskers show the smallest or largest value within 1.5 times the 25th or 75th quartile, respectively.
Figure 3
Figure 3
Associations between gut microbiome alpha-diversity and BMF (A) Richness of amplicon sequence variants (ASVs) across BMF categories (ordinal BMF variable, linear regression, p = 2.85E−3). (B) Shannon diversity across BMF categories (ordinal BMF variable, linear regression, p = 1.07E−3). (C) Pielou’s evenness across BMF categories (ordinal BMF variable, linear regression, p = 8.5E−2). Center lines in the boxplots show the median, the ends of the boxes show the interquartile range, and whiskers show the span of points within 1.5 times the interquartile range from the ends of the box.
Figure 4
Figure 4
Heatmap of average Z scored CLR abundances within each BMF category for all annotated genera significantly associated with BMF 46 significant taxa, in order of decreasing average relative abundance, with their Z scored, CLR-transformed abundances averaged within each BMF category plotted as a heatmap. Covariates included gender, age, BMI, eGFR, LDL, CRP, A1C, and PCs 1–3. Asterisks denote the individual FDR-corrected significance threshold for the Wald test p value of the βBMF coefficient for each BMF category, relative to the high-normal reference category. Rows without asterisks showed a significant overall model (FDR p value <0.05), despite a lack of significance for the individual coefficients. (∗∗∗): p < 0.0001, (∗∗): 0.0001 < p < 0.01, (∗): 0.01 < p < 0.05.
Figure 5
Figure 5
Heatmap of average Z scored blood plasma metabolites levels within each BMF category for all metabolites significantly associated with BMF 11 significant blood plasma metabolites, with average Z scores within each BMF category plotted as a heatmap. Significant associations were identified using LIMMA, with FDR-corrected p values of the ratio test between the main model and the null model. Here, the covariates included gender, age, BMI, eGFR, LDL, CRP, A1C, and PCs 1–3. Asterisks denote metabolites with significant βBMF coefficient(s) in the linear regression model after FDR correction. (∗∗∗): p < 0.0001, (∗∗): 0.0001 < p < 0.01, (∗): 0.01 < p < 0.05.
Figure 6
Figure 6
Heatmap of average Z scored clinical chemistries within each BMF category for all chemistries significantly associated with BMF 22 BMF-associated chemistries, identified using LIMMA models with FDR-corrected p values of the ratio test between the main model and the null model, with average Z scores within each BMF category plotted as a heatmap. Here, the covariates included gender, age, BMI, eGFR, LDL, CRP, A1C, and PCs 1–3. Asterisks denote FDR-corrected p value thresholds for metabolites with significant βBMF coefficient(s) in the linear regression model. (∗∗∗): p < 0.0001, (∗∗): 0.0001 < p < 0.01, (∗): 0.01 < p < 0.05.
Figure 7
Figure 7
Ordinal regression odds ratio for health, diet, and lifestyle survey data vs. BMF and covariates, and causal mediation analysis, with BMF as the treatment variable, 3-IS as the mediator variable, and eGFR as the response variable (A) BMF categories are shown by question type (diet/lifestyle or health/digestion). “High-normal” BMF (7–21/week) is the reference. Vertical ticks show directional associations in likelihood between variables across the horizontal axis. The center line (x = 1.0) indicates equal likelihood of increased values on either side. Confidence intervals not crossing the line are significant associations (FDR p < 0.05). (B) BMF affects eGFR directly (average direct effect, ADE) and indirectly (average causal mediated effect, ACME) through 3-IS (a metabolite). Both effects are significant (N = 572); the total effect was not significant (N = 572; ADE = −4.458, p = 0.012; ACME = 1.343, p < 2E−16). The total effect and the proportion-mediated terms did not pass our significance threshold of ɑ = 0.05.

Update of

Similar articles

Cited by

References

    1. Magalhães-Guedes K.T. Psychobiotic Therapy: Method to Reinforce the Immune System. Clin. Psychopharmacol. Neurosci. 2022;20:17–25. doi: 10.9758/cpn.2022.20.1.17. - DOI - PMC - PubMed
    1. Kim J., Lee H.K. Potential Role of the Gut Microbiome In Colorectal Cancer Progression. Front. Immunol. 2021;12 doi: 10.3389/fimmu.2021.807648. - DOI - PMC - PubMed
    1. Hughes R.L. A Review of the Role of the Gut Microbiome. Personalized Sports Nutrition. 2020;6:191. doi: 10.3389/fnut.2019.00191. - DOI - PMC - PubMed
    1. Ceballos D., Hernández-Camba A., Ramos L. Diet and microbiome in the beginning of the sequence of gut inflammation. World J. Clin. Cases. 2021;9:11122–11147. doi: 10.12998/wjcc.v9.i36.11122. - DOI - PMC - PubMed
    1. Cryan J.F., O’Riordan K.J., Cowan C.S.M., Sandhu K.V., Bastiaanssen T.F.S., Boehme M., Codagnone M.G., Cussotto S., Fulling C., Golubeva A.V., et al. The Microbiota-Gut-Brain Axis. Physiol. Rev. 2019;99:1877–2013. doi: 10.1152/physrev.00018.2018. - DOI - PubMed

LinkOut - more resources