. 2024 Aug 14;4(8):100609.
doi: 10.1016/j.xgen.2024.100609. Epub 2024 Jul 16.

Rare variation in non-coding regions with evolutionary signatures contributes to autism spectrum disorder risk

Affiliations

Rare variation in non-coding regions with evolutionary signatures contributes to autism spectrum disorder risk

Taehwan Shin et al. Cell Genom. .

Abstract

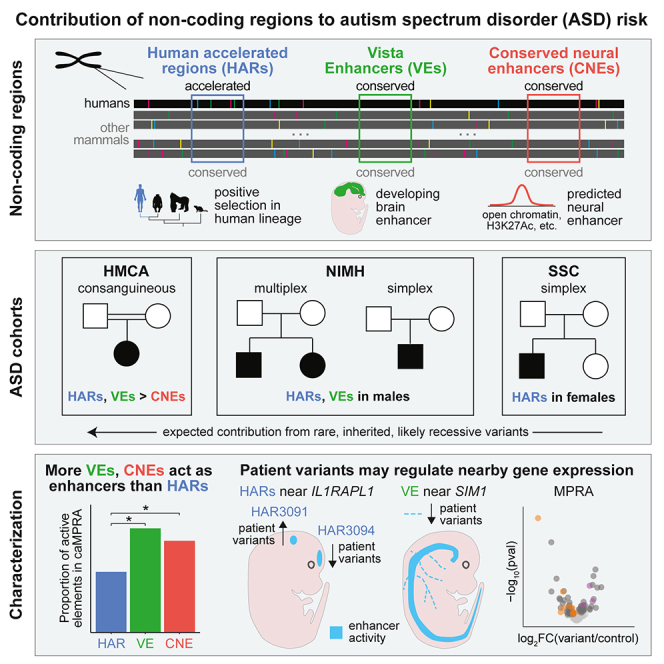
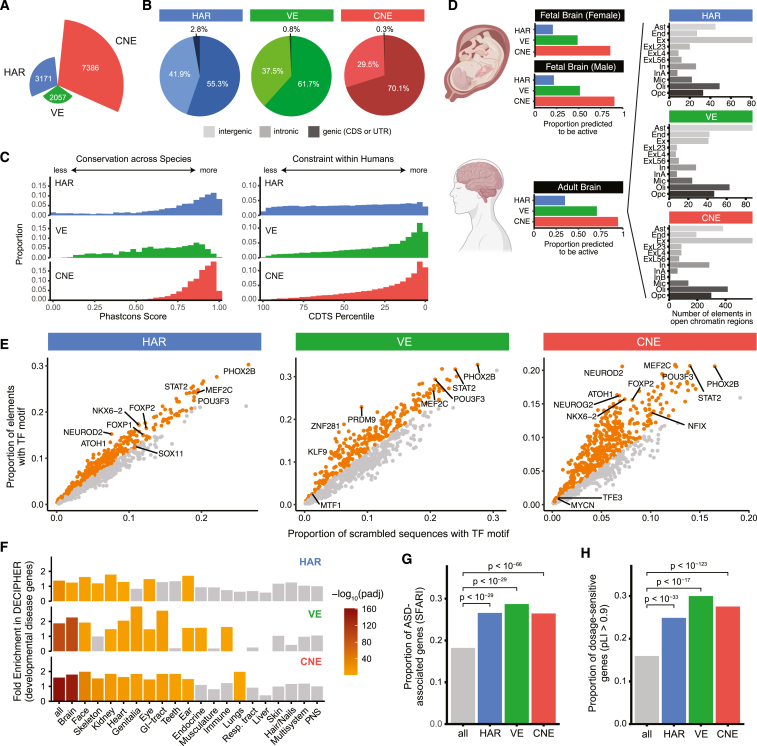
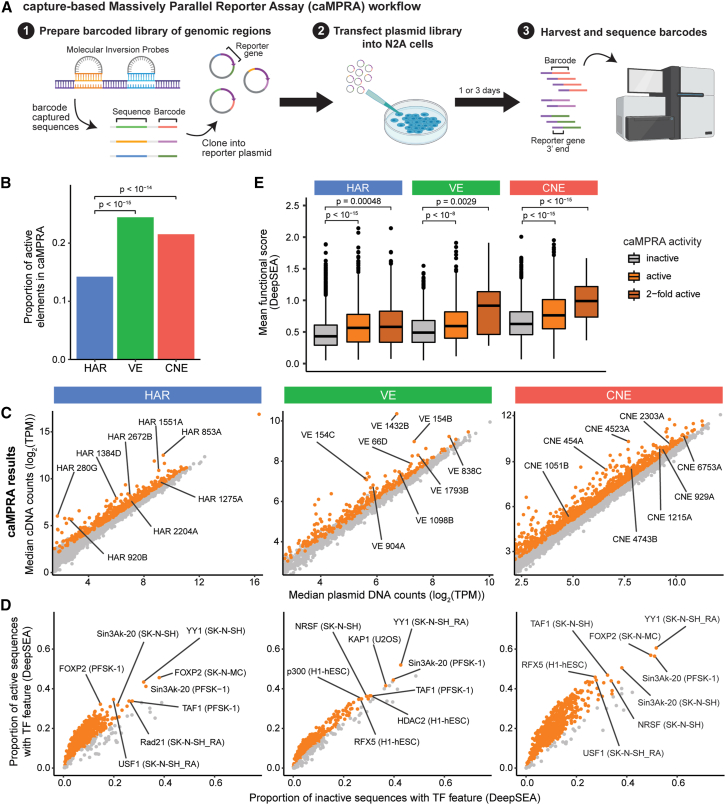
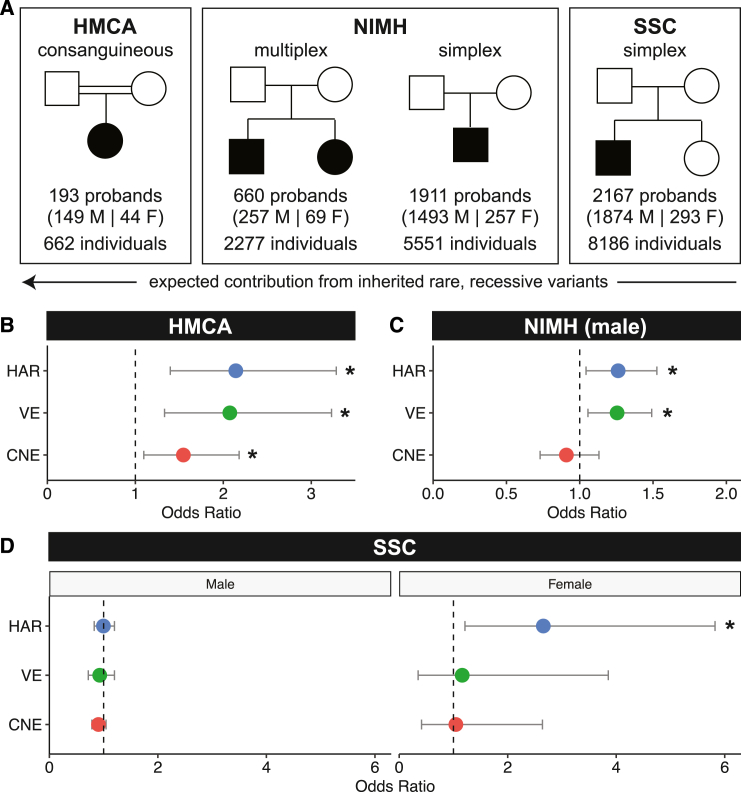
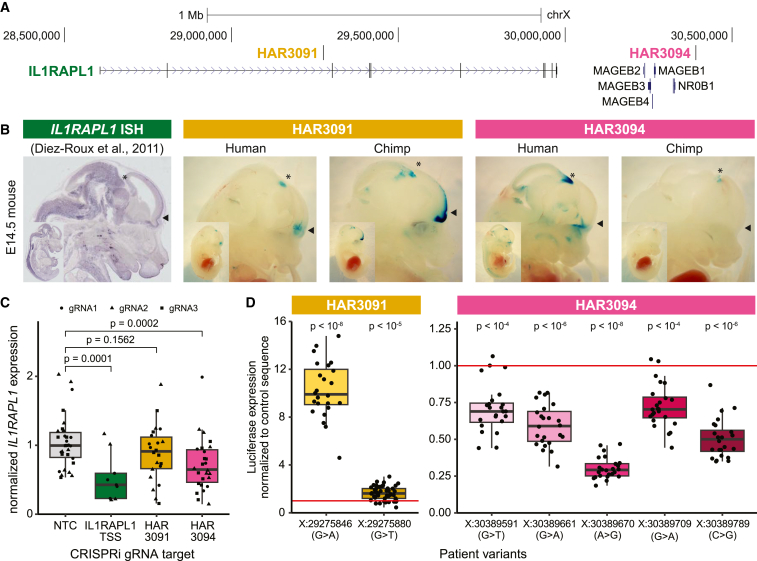
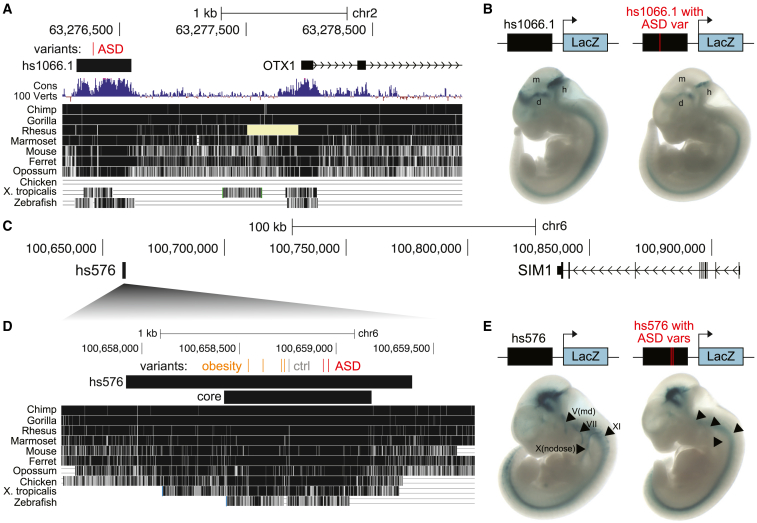
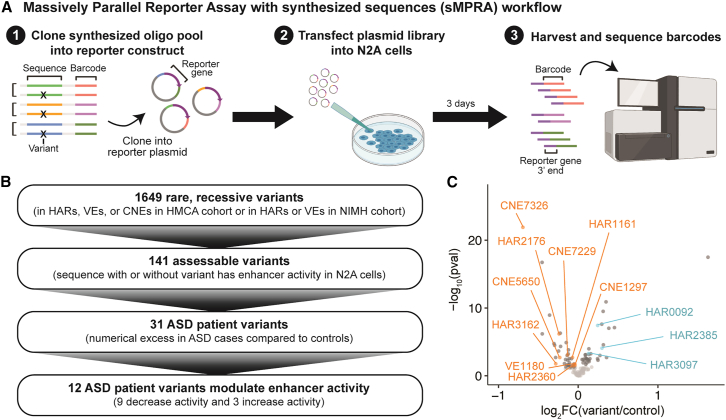
Little is known about the role of non-coding regions in the etiology of autism spectrum disorder (ASD). We examined three classes of non-coding regions: human accelerated regions (HARs), which show signatures of positive selection in humans; experimentally validated neural VISTA enhancers (VEs); and conserved regions predicted to act as neural enhancers (CNEs). Targeted and whole-genome analysis of >16,600 samples and >4,900 ASD probands revealed that likely recessive, rare, inherited variants in HARs, VEs, and CNEs substantially contribute to ASD risk in probands whose parents share ancestry, which enriches for recessive contributions, but modestly contribute, if at all, in simplex family structures. We identified multiple patient variants in HARs near IL1RAPL1 and in VEs near OTX1 and SIM1 and showed that they change enhancer activity. Our results implicate both human-evolved and evolutionarily conserved non-coding regions in ASD risk and suggest potential mechanisms of how regulatory changes can modulate social behavior.

Keywords: IL1RAPL1; OTX1; SIM1; VISTA enhancers; autism spectrum disorder; caMPRA; consanguineous families; conserved neural enhancers; human accelerated regions; noncoding regions.


Conflict of interest statement

Declaration of interests The authors declare no competing interests.

Figures

None
Graphical abstract
Figure 1
Figure 1
Genomic and epigenomic features of HARs, VEs, and CNEs (A) Numbers of HARs, VEs, and CNEs. (B) Proportions of HARs, VEs, and CNEs in intergenic (light coloring), intronic (moderate coloring), and genic (dark coloring) regions. (C) Conservation across species (left) and constraint within humans (right) are represented by phastCons score and CDTS percentile, respectively. (D) Proportions of HARs, VEs, and CNEs predicted to be active by ChromHMM based on epigenomic data from a fetal male brain, a fetal female brain, and an adult brain (left). Numbers of HARs, VEs, and CNEs that overlap open chromatin regions from single-cell transposome hypersensitive site sequencing (scTHS-seq) across cell types in the adult brain (right). Ast, astrocytes; End, endothelial cells; Ex, excitatory neurons; ExL23, layers 2–3 excitatory neurons; ExL4, layer 4 excitatory neurons; ExL56, layers 5–6 excitatory neurons; In, inhibitory neurons; InA, inhibitory neurons subtype A; InB, inhibitory neurons subtype B; Mic, microglia; Oli, oligodendrocytes; Opc, oligodendrocyte precursor cells. (E) Enrichment of TF-binding-site motifs in HARs, VEs, and CNEs (STAR Methods). Orange dots indicate significantly enriched elements, as assessed with the hypergeometric test at 5% false discovery rate (FDR). (F) Enrichment of HARs, VEs, and CNEs near genes associated with developmental diseases in different body systems from the DECIPHER Consortium by the binomial test at 5% FDR. (G) HARs, VEs, and CNEs are enriched for ASD-associated genes annotated in the SFARI database by the binomial test at 5% FDR. (H) Genes near HARs, VEs, or CNEs are enriched for genes with pLI >0.9 (loss-of-function intolerant) by the hypergeometric test at 5% FDR. Full details of statistical analyses are in STAR Methods.
Figure 2
Figure 2
HARs, VEs, and CNEs display enhancer activity in a capture-based massively parallel reporter assay (caMPRA) (A) Schematic of caMPRA (STAR Methods). (B) Proportions of HARs, VEs, and CNEs that have enhancer activity in at least one captured sequence. Statistical significance was assessed with the chi-squared test at 5% FDR. (C) Normalized cDNA versus plasmid counts for sequences captured from HARs, VEs, and CNEs. (D) TF features were predicted by DeepSEA for each captured sequence. Representative TF features are marked in the following format: TF (cell type). (E) Sequences captured from HARs, VEs, and CNEs were classified as inactive, active, or 2-fold active and compared to their mean functional score from DeepSEA (average of −log10(e value) for every feature). Significant sequences are in orange and were determined by the Wilcoxon test at 5% FDR. Full details of statistical analyses are in the STAR Methods.
Figure 3
Figure 3
Contribution of rare, recessive variants in HARs, VEs, and CNEs to ASD varies across cohorts based on family structure (A) ASD cohorts. (B) In the HMCA cohort, cases are enriched for rare, recessive variants in HARs (adjusted p = 0.0014), VEs (adjusted p = 0.0038), and CNEs (adjusted p = 0.0412) at allele frequency (AF) < 0.005. (C) In the NIMH cohort, male cases are enriched for rare, recessive variants in HARs (adjusted p = 0.0495) and VEs (adjusted p = 0.0297) at AF < 0.001. (D) In the SSC cohort, female cases are enriched for rare, recessive variants in HARs (adjusted p = 0.0438) at AF < 0.005. All analyses were done on conserved bases. Odds ratios and 95% confidence intervals were calculated as previously described, and p values comparing odds ratios were calculated using z values assuming deviation from a normal distribution. Full details of statistical analyses are in STAR Methods.
Figure 4
Figure 4
Patient variants in HAR3091 and HAR3094 likely regulate IL1RAPL1 expression in multiple brain regions (A) Genomic interval containing IL1RAPL1, HAR3091, and HAR3094. (B) Constructs containing either the human or the chimpanzee version of HAR3091 and HAR3094 cloned upstream of a minimal promoter driving lacZ expression were randomly integrated into mice and analyzed at E14.5. Representative embryos are shown (all embryos are in Figure S15). Arrowheads, telencephalon and olfactory bulb; asterisks, midbrain. E14.5 embryos have an average crown-rump length of 12 mm. In situ hybridization of IL1RAPL1 at E14.5 from the Eurexpress database is shown for comparison. (C) CRISPRi targeting the transcription start site (TSS) of IL1RAPL1, HAR3091, and HAR3094 compared to non-targeting control (NTC) gRNAs in iPSC-derived neurons. Statistical significance was determined with the Wilcoxon test and Fisher’s method at 5% FDR. (D) Patient variants in HAR3091 and HAR3094 were tested for luciferase expression in N2A cells. Statistical significance was determined with the Wilcoxon test and Fisher’s method at 5% FDR. Coordinates are in hg19. Full details of statistical analyses are in the STAR Methods.
Figure 5
Figure 5
Patient variants in VISTA enhancers reduce enhancer activity in the nervous system (A–E) Genomic intervals containing hs1066.1 and OTX1 (A) or hs576 and SIM1 (C and D). Coordinates are in hg19. The locations of ASD patient variants are in red, control variants are in gray, and obesity-associated variants are in orange. (A) The pale yellow bar in the alignment to Rhesus indicates missing sequence (Ns) in that region. (D) The core region of hs576 recapitulates most of the enhancer activity of the entire element. Constructs containing hs1066.1 (B) or hs576 (E) without or with ASD patient variant(s) upstream of a minimal promoter driving the lacZ gene were integrated into the safe-harbor H11 locus and analyzed for lacZ expression at E11.5 (STAR Methods). Representative embryos are shown (all embryos are in Figures S18 and S19). E11.5 embryos have an average crown-rump length of 6 mm. (B) d, diencephalon; m, midbrain; and h, hindbrain. (E) Arrowheads indicate cranial nerves where the inclusion of the two ASD patient variants reduces enhancer activity.
Figure 6
Figure 6
Identification of patient variants that modulate enhancer activity using MPRA with synthesized sequences (sMPRA) (A) Schematic of sMPRA. (B) Flowchart showing the number of rare, recessive variants that pass each filter. (C) Volcano plot of fold change of enhancer activity and adjusted p value for each variant-containing sequence compared to its matched control sequence. Significant patient variants are labeled and in color, significant control variants are in dark gray, and all other variants are in light gray. Statistical significance was assessed with the Wilcoxon test at 5% FDR. Full details of statistical analyses are in the STAR Methods.

Update of

References

    1. Maenner M.J., Warren Z., Williams A.R., Amoakohene E., Bakian A.V., Bilder D.A., Durkin M.S., Fitzgerald R.T., Furnier S.M., Hughes M.M., et al. Prevalence and Characteristics of Autism Spectrum Disorder Among Children Aged 8 Years - Autism and Developmental Disabilities Monitoring Network, 11 Sites, United States, 2020. MMWR. Surveill. Summ. 2023;72:1–14. - PMC - PubMed
    1. Hyman S.L., Levy S.E., Myers S.M., COUNCIL ON CHILDREN WITH DISABILITIES, SECTION ON DEVELOPMENTAL AND BEHAVIORAL PEDIATRICS Identification, Evaluation, and Management of Children With Autism Spectrum Disorder. Pediatrics. 2020;145 - PubMed
    1. De Rubeis S., He X., Goldberg A.P., Poultney C.S., Samocha K., Cicek A.E., Kou Y., Liu L., Fromer M., Walker S., et al. Synaptic, transcriptional and chromatin genes disrupted in autism. Nature. 2014;515:209–215. - PMC - PubMed
    1. Iossifov I., O’Roak B.J., Sanders S.J., Ronemus M., Krumm N., Levy D., Stessman H.A., Witherspoon K.T., Vives L., Patterson K.E., et al. The contribution of de novo coding mutations to autism spectrum disorder. Nature. 2014;515:216–221. - PMC - PubMed
    1. Zhou X., Feliciano P., Shu C., Wang T., Astrovskaya I., Hall J.B., Obiajulu J.U., Wright J.R., Murali S.C., Xu S.X., et al. Integrating de novo and inherited variants in 42,607 autism cases identifies mutations in new moderate-risk genes. Nat. Genet. 2022;54:1305–1319. - PMC - PubMed