. 2024 Sep 25;112(18):3069-3088.e4.
doi: 10.1016/j.neuron.2024.06.021. Epub 2024 Jul 16.

A single-cell atlas deconstructs heterogeneity across multiple models in murine traumatic brain injury and identifies novel cell-specific targets

Affiliations

A single-cell atlas deconstructs heterogeneity across multiple models in murine traumatic brain injury and identifies novel cell-specific targets

Ruchira M Jha et al. Neuron. .

Abstract

Traumatic brain injury (TBI) heterogeneity remains a critical barrier to translating therapies. Identifying final common pathways/molecular signatures that integrate this heterogeneity informs biomarker and therapeutic-target development. We present the first large-scale murine single-cell atlas of the transcriptomic response to TBI (334,376 cells) across clinically relevant models, sex, brain region, and time as a foundational step in molecularly deconstructing TBI heterogeneity. Results were unique to cell populations, injury models, sex, brain regions, and time, highlighting the importance of cell-level resolution. We identify cell-specific targets and previously unrecognized roles for microglial and ependymal subtypes. Ependymal-4 was a hub of neuroinflammatory signaling. A distinct microglial lineage shared features with disease-associated microglia at 24 h, with persistent gene-expression changes in microglia-4 even 6 months after contusional TBI, contrasting all other cell types that mostly returned to naive levels. Regional and sexual dimorphism were noted. CEREBRI, our searchable atlas (https://shiny.crc.pitt.edu/cerebri/), identifies previously unrecognized cell subtypes/molecular targets and is a leverageable platform for future efforts in TBI and other diseases with overlapping pathophysiology.

Keywords: ependymal cells; heterogeneity; microglia; single-cell transcriptomic atlas; traumatic brain injury.


Conflict of interest statement

Declaration of interests The authors declare no competing interests.

Figures

Figure 1:
Figure 1:
Single-cells isolated with mRNA sequenced from murine cortex post-TBI. (A) Workflow of injury models/conditions and tissue sampling from naïve and injured brain (Supplemental-Table-1). Tissue was isolated from naïve or left pericontusional brain 24h post-injury (rCHI, CCI, CCI+HS), and 7d and 6mo post-CCI (Allen-Mouse Brain bregma values −0.755 to −2.75). Tissue was also obtained from females and contralateral mirror-image brain-tissue 24h post-CCI. Tissue was micro-dissected, single-cells were isolated, sequenced and computationally analyzed. (B) UMAP clustering of 23 cell populations (334,376 cells). (C) – (F) UMAPs in: (C) naïve/injury models 24h post-rCHI, CCI, and CCI+HS; (D) sex (CCI); (E) contralateral-region (CCI), and (F) time (CCI, 7d, 6mo). (Supplemental-Table-1). G) Gene-expression violin plot of umbrella cell-type markers (i) and immunofluorescence of an exemplar ependymal marker (Enpp2) across models (ii). (Supplemental-Figure-S1 for microglial/ependymal subtypes). H) Immunohistochemistry-based characterization of histological model severity with representative images of IBA-1+ (microglia) and Ly6g+ (neutrophil) infiltration across models (n=14). 24h and 72h are demonstrated per model across several brain-regions (row1=IBA1+ CA-1 hippocampus, row2=IBA1+ thalamus, row-3=Ly6g+ pericontusion, scale bar=20 μm). UMAP feature plots of Ly6g+ cells (neutrophils-1, Supplemental-Figure-S2) (I) Box plot of select cell-populations in (i) TBI-models (naïve=black, rCHI=gray, CCI=red, CCI+HS=maroon), (ii) sex (female=green, male=red), (iii) space/brain-region (contralateral cortex=blue, ipsilateral cortex=red), and (iv) stacked bar chart showing temporal changes across models. (Supplemental-Figure-S5).
Figure 2:
Figure 2:
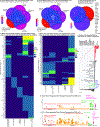
Gene-expression changes across TBI-models agnostic to cell-type. (A) –(C) Venn diagrams showing overlapping DEG counts in any cell-type across TBI-models (p-valueadjusted<0.05, log2FC ≥0.5, naïve=reference) including (A) upregulated DEGs (B) downregulated DEGs (C) upregulated DEGs at three timepoints post-CCI. DEGs overlapping with all models are listed. (D) Ordinal heatmap of upregulated DEGs (y-axis) by TBI-condition (x-axis) demonstrating number of cell-types where DEGs are upregulated (p-valueadjusted<0.05, log2FC>1). Most DEGs are upregulated in a single cell-type (blue). (E) Ordinal heatmap of downregulated DEGs (y-axis) by TBI-condition (x-axis) demonstrating number of cell-types where DEGs are downregulated (p-valueadjusted<0.05, log2FC>1). Most DEGs are downregulated in a single cell-type (blue). (F) Upset plot showing number of overlapping DEGs shared by different cell-types after CCI (naïve=reference). Black=two cell-types, Green=three cell-types, Blue= four cell-types. (G) – (H) Functional enrichment of upregulated DEGs in (D) using g:Profiler highlights select gene ontology augmented in rCHI versus naïve (G), CCI versus naïve (H).
Figure 3:
Figure 3:
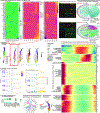
Cell-Specific DEGs, pathways and pseudotime in TBI-models (A) Heatmap of DEGs (naïve=reference, log2FC≥0.5, p-valueadjusted<0.05 ) in (i) rCHI (ii) CCI-microglia, (iii) CCI-neuro-glial-vascular and ependymal cells. Select DEGs annotated. (Supplemental-Figure-S6). (iv) Dual-labelled immunofluorescence of select markers differentially expressed in specific cell-types post-CCI (bottom-panel) versus naïve (top-panel) including CCL3, IL-1β, and SPP1 (n=14) co-stained with established cell-type markers. Minimal-no expression in naïve microglia (IBA1+), endothelial-cells (Cd31+) or astrocytes (GFAP+). Post-CCI, consistent with gene expression changes, immunofluorescent CCL3 is increased in a subpopulation of IBA1+ microglia (with altered morphology), IL-1β is increased in a subpopulation of endothelial cells, SPP1 is increased in astrocytes. White arrowheads=increased expression. (Supplemental-Figure-S6). (B) Chord diagrams highlighting key biological processes and associated genes altered in TBI-models. Naïve=reference. (B-i) Microglia-7 post-rCHI. (B-ii) Microglia-4 24h post-CCI. (Supplemental-Figure-S6). (C) UMAP depicting four microglial pseudotime-lineages. Key microglial-subtypes altered post-rCHI and -CCI stem from microglial lineage-1. Microglia-5= root of all lineages. (D) Pseudotime heatmap showing gene-expression dynamics across microglial lineage-1. Annotation bars above the heatmap demonstrate grouping by model and cell-type. Microglia at extremes of pseudotime are predominantly in CCI±HS with different processes upregulated versus rCHI and Naïve. Microglia-5 is the earliest in pseudotime. Genes are grouped by expression profiles with hierarchical clustering. Gene transcripts (right) with select gene-ontology biological processes and molecular functions (left) for each gene-cluster. (E) Individual expression profiles of top-genes altered along pseudotime based on (i) pseudotime-differentiation state and (ii) microglial cell-type. Each dot=single cell. Solid line=loess regression. Pseudotime (differentiation state) increases from left to right (x-axis). Y-axis=expression levels. (F) Heatmap of IL-1 cell-communication post-CCI identifying relative importance of cell-populations as senders, receivers, mediators, and influencers of IL-1 signaling highlighting central role of ependymal-4 (Supplemental-Figure-S6). (G) Circle plot of IL-1 signaling showing cell-populations that communicate with ependymal-4 post-CCI. (H) Pseudotime UMAP identifying ependymal-4 as lineage root—early and undifferentiated.
Figure 4:
Figure 4:
Temporal cell-specific transcriptomic changes post-CCI. (A) Dotplot of DEGs (y-axis) by cell-type (x-axis) 7d post-CCI (naïve=reference, log2FC≥1.25, p-valueadjusted<0.05) Red=upregulated, blue=downregulated. Dot size =% of cells. Microglia-4 has the most DEGs (Figure-1A) (B) Dotplot of DEGs (y-axis) by cell-type (x-axis) 6mo post-CCI (naïve=reference, log2FC≥1.25, p-valueadjusted<0.05) Red=upregulated, blue=downregulated. Dot size =% of cells. Microglia-4 has persistent differential expression of multiple genes (Figure-1A, Figure-4A). (C) Heatmap of DEGs (y-axis, naïve=reference) in microglia-4 at 24h, 7d and 6mo post-CCI (x-axis=time, log2FC≥1, p-valueadjusted<0.05). (D) Chord diagrams highlighting key biological processes and associated genes altered in Microglia-4 at (i) 7d (ii) 6mo post-CCI (Figure 3B).
Figure 5:
Figure 5:
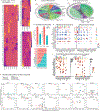
Sex-based transcriptomic differences post-CCI. (A) Heatmap of significant DEGs in female CCI (male=reference) across neuro-glial-vascular and ependymal cells (left), peripheral immune cells (top-right) and microglia (bottom-right). Log2FC threshold≥0.5, p-valueadjusted<0.05. (B-C): Chord diagrams of gene set enrichment analyses highlighting key biological processes and associated genes altered in microglia-4 (B) and neurons (C) in females post-CCI. (Reference=male CCI). (D) Bar graph (top) showing differences in number and strength of cell-signaling pathways in females versus males post-CCI. Cell-communication signaling pathways ranked based on differences in relative information flow (bottom) within the specified network (y-axis) comparing females (teal) with males (red). (E) Heatmap comparing differential number (left) and strength of interactions (right) between specific cell-populations in females versus males. Top bar in both heatmaps=column sum. Right bar=row sum. Red=increased female signaling, Blue=decreased female signaling. (F) Heatmap showing strength of incoming and outgoing signaling in males (left) and females (right) demonstrating differences based on cell-type and signaling-pathway. Rows=signaling pathways. Columns=cell populations. Darker red=greater signaling strength. Top bar in both heatmaps=column sum. Right bar=row sum. (G) Scatter plots of individual cell-types showing changes in signaling pathways based on sex and incoming/outgoing signals. Red=male-specific, Teal=female specific, Black=shared by both sexes, Squares=Incoming, Triangles=outgoing, Diamonds= incoming and outgoing.
Figure 6:
Figure 6:
Brain-region based transcriptomic differences post-CCI. (B) Heatmap of significant DEGs in contralateral brain-regions post-CCI (ipsilateral brain-region=reference) across microglia (left), peripheral immune-cells (center) and neuro-glial-vascular and ependymal cells (right). Log2FC threshold≥0.5, p-valueadjusted<0.05. (B-E): Chord diagrams of gene set enrichment analyses highlighting key biological processes and associated genes altered in astrocytes (B), NK-cells (C), T-memory (D) and endothelial-1 (E) contralaterally post-CCI. Reference=ipsilateral brain-region. (F) Significant cell-communication signaling pathways ranked based on differences in the relative information flow (top-graph) within the specified network (y-axis) comparing contralateral (teal) ipsilateral/pericontusional (red) cortex post-CCI. Bar graph (bottom) showing differences in number and strength of cell-signaling pathways in the pericontusion versus contralaterally post-CCI. (G) Heatmap comparing differential number of interactions (left) and strength of interactions (right) between cell populations contralaterally versus pericontusion. Top bar in both heatmaps=column sum. Right bar=row sum. Red=increased signaling contralaterally. Blue=decreased signaling contralaterally. (H) Heatmap showing strength of incoming and outgoing signaling in pericontusion (left) and contralateral cortex (right) demonstrating differences based on cell-type and signaling pathway. Rows=signaling pathways. Columns=cell populations. Darker red= greater signaling strength. Top-bar in both heatmaps=column sum. Right-bar=row sum. (I) Scatter plots of select cell-types showing changes in signaling pathways based on brain-region and incoming/outgoing signals. Red=pericontusion. Teal=mirror-image contralateral cortex. Black=shared by both regions. Squares=incoming. Triangles=outgoing. Diamond=incoming and outgoing.

References

    1. Maas AIR, Menon DK, Manley GT, Abrams M, Åkerlund C, Andelic N, Aries M, Bashford T, Bell MJ, Bodien YG, et al. (2022). Traumatic brain injury: progress and challenges in prevention, clinical care, and research. Lancet Neurol. 21, 1004–1060. 10.1016/S1474-4422(22)00309-X. - DOI - PMC - PubMed
    1. Wright DW, Yeatts SD, Silbergleit R, Palesch YY, Hertzberg VS, Frankel M, Goldstein FC, Caveney AF, Howlett-Smith H, Bengelink EM, et al. (2014). Very early administration of progesterone for acute traumatic brain injury. N. Engl. J. Med. 371, 2457–2466. 10.1056/NEJMoa1404304. - DOI - PMC - PubMed
    1. Edwards P, Arango M, Balica L, Cottingham R, El-Sayed H, Farrell B, Fernandes J, Gogichaisvili T, Golden N, Hartzenberg B, et al. (2005). Final results of MRC CRASH, a randomised placebo-controlled trial of intravenous corticosteroid in adults with head injury-outcomes at 6 months. Lancet 365, 1957–1959. 10.1016/S0140-6736(05)66552-X. - DOI - PubMed
    1. Temkin NR, Anderson GD, Winn HR, Ellenbogen RG, Britz GW, Schuster J, Lucas T, Newell DW, Mansfield PN, Machamer JE, et al. (2007). Magnesium sulfate for neuroprotection after traumatic brain injury: a randomised controlled trial. Lancet Neurol. 6, 29–38. 10.1016/S1474-4422(06)70630-5. - DOI - PubMed
    1. Andrews PJD, Sinclair HL, Rodriguez A, Harris BA, Battison CG, Rhodes JKJ, Murray GD, and Eurotherm3235 Trial Collaborators (2015). Hypothermia for Intracranial Hypertension after Traumatic Brain Injury. N. Engl. J. Med. 373, 2403–2412. 10.1056/NEJMoa1507581. - DOI - PubMed