. 2024 Jul 18;15(1):6039.
doi: 10.1038/s41467-024-50107-4.

Replication timing alterations are associated with mutation acquisition during breast and lung cancer evolution

Affiliations

Replication timing alterations are associated with mutation acquisition during breast and lung cancer evolution

Michelle Dietzen et al. Nat Commun. .

Abstract

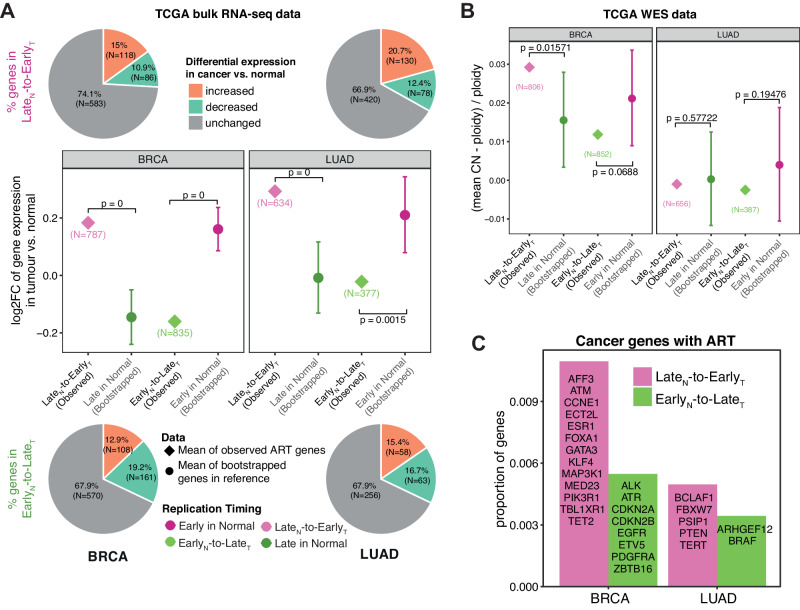
During each cell cycle, the process of DNA replication timing is tightly regulated to ensure the accurate duplication of the genome. The extent and significance of alterations in this process during malignant transformation have not been extensively explored. Here, we assess the impact of altered replication timing (ART) on cancer evolution by analysing replication-timing sequencing of cancer and normal cell lines and 952 whole-genome sequenced lung and breast tumours. We find that 6%-18% of the cancer genome exhibits ART, with regions with a change from early to late replication displaying an increased mutation rate and distinct mutational signatures. Whereas regions changing from late to early replication contain genes with increased expression and present a preponderance of APOBEC3-mediated mutation clusters and associated driver mutations. We demonstrate that ART occurs relatively early during cancer evolution and that ART may have a stronger correlation with mutation acquisition than alterations in chromatin structure.


Conflict of interest statement

N.M. has stock options in and has consulted for Achilles Therapeutics and holds a European patent in determining HLA LOH (PCT/GB2018/052004) and is a co-inventor to a patent to identifying responders to cancer treatment (PCT/GB2018/051912). N.K. acknowledges grant support from AstraZeneca. C.S. acknowledges grant support from AstraZeneca, Boehringer-Ingelheim, Bristol Myers Squibb, Pfizer, Roche-Ventana, Invitae (previously Archer Dx Inc. - collaboration in minimal residual disease sequencing technologies), and Ono Pharmaceutical. He is an AstraZeneca Advisory Board member and Chief Investigator for the AZ MeRmaiD 1 and 2 clinical trials and is also chief investigator of the NHS Galleri trial. He has consulted for Achilles Therapeutics, Amgen, AstraZeneca, Pfizer, Novartis, GlaxoSmithKline, MSD, Bristol Myers Squibb, Illumina, Genentech, Roche-Ventana, GRAIL, Medicxi, Metabomed, Bicycle Therapeutics, Roche Innovation Centre Shanghai, and the Sarah Cannon Research Institute, C.S. had stock options in Apogen Biotechnologies and GRAIL until June 2021, and currently has stock options in Epic Bioscience, Bicycle Therapeutics, and has stock options and is co-founder of Achilles Therapeutics. C.S. holds patents relating to assay technology to detect tumour recurrence (PCT/GB2017/053289); to targeting neoantigens (PCT/EP2016/059401), identifying patent response to immune checkpoint blockade (PCT/EP2016/071471), determining HLA LOH (PCT/GB2018/052004), predicting survival rates of patients with cancer (PCT/GB2020/050221), identifying patients who respond to cancer treatment (PCT/GB2018/051912), US patent relating to detecting tumour mutations (PCT/US2017/28013), methods for lung cancer detection (US20190106751A1) and both a European and US patent related to identifying insertion/deletion mutation targets (PCT/GB2018/051892). The remaining authors declare no competing interests.

Figures

Fig. 1
Fig. 1. Overview of the data cohort used to explore the relationship between mutation acquisition and replication timing.
A, B Mutation density (measured as the number of mutations relative to the size of the affected genomic regions) in gained, lost and copy number neutral genomic regions in 482 breast carcinomas (BRCA) (A) and 470 lung adenocarcinomas (LUAD) (B). P-values reflect one-sided paired Wilcoxon tests. The centre line of the box plots represents the median value, the limits represent the 25th and 75th percentile, and the whiskers extend from the box to the largest and lowest value no further than 1.5 * IQR (interquartile range) away from the box. C Schematic demonstrating the method of copy number correcting the mutation load within a single 50 kb bin. Both the total copy number at the mutated position (referred to as CN segment) and the number of mutated alleles (referred to as CN mutation) are calculated. D Copy number adjusted mutation load in 5 Mb bins across the genome for 482 BRCA and 470 LUAD tumours. E Fraction of the genome presenting conserved and non-conserved RT across 5 non-malignant cell lines from ENCODE. F Variance in mutation load explained by the average replication timing (RT) signal across all 16 ENCODE cell lines in conserved and non-conserved RT regions identified across non-malignant cells. The bars represent the R2 value derived from a linear model with mutation load as an independent variable and the averaged RT signal as a dependent variable. G Hierarchical clustering of RT signals in 50 kb windows across the genome. The Euclidean distance and the ward criterion were used to cluster RT signals of 31 cell lines (including 15 IN-STUDY and 16 ENCODE cell lines). Additional information about the cell lines, including whether the cell line was derived from normal or cancer cells and the presence of different driver gene mutations, are displayed on the top tracks. Names of a subset of cell lines were coloured regarding their involvement in the corresponding cancer type in further analyses. A549 was Repli-sequenced as part of both the ENCODE and our IN-STUDY cohort representing two replicates; A549(E) presents the results using the ENCODE data.
Fig. 2
Fig. 2. Replication timing alterations in BRCA and LUAD cell lines.
A Distribution of ART across the genome for one lung adenocarcinoma (LUAD) cell line, H1650. The bars on the left illustrate the proportion of each chromosome affected by altered replication timing (ART). The bars on the right present the localisation of genomic regions with ART on each chromosome. One genomic region on chromosome 1 is displayed to highlight the definition of altered EarlyN-to-LateT and LateN-to-EarlyT replicated regions. B Proportions of the genome affected by ART in each of the breast carcinoma (BRCA) and LUAD cell lines. C Two examples illustrating how IMR90 and TT1 result in distinct ART regions when used as normal reference for H1650 cells. The regions presented as grey rectangles can be considered false-positive ART regions. In contrast, the yellow rectangle shows a true ART region which has been missed by IMR90 and TT1 (false negative). D Proportion of overlapping ART regions that have been identified when using three different cell lines as a reference (IMR90, TT1 and cells most closely resembling the reported tissue-of-origin for LUAD, T2P). The proportions are displayed as pie charts for the 4 different LUAD cell lines with the upset plot present for the H1650 cell line. E Pie charts showing the proportions of overlapping ART regions between cell lines within each cancer type by using the correct tissue-of-origin as normal reference, and line charts showing examples of genomic regions with recurrent, shared and unique ART. F Comparisons of gene density between genomic regions with unaltered replication timing or shared and recurrent ART in BRCA and LUAD cell lines (BRCA: 9521 genes with unaltered EarlyN+T replication timing, 4531 genes with EarlyN-to-LateT ART, 4129 genes with LateN-to-EarlyT ART and 17873 genes with unaltered LateN+T replication timing; LUAD: 11104 genes with unaltered EarlyN+T replication timing, 1569 genes with EarlyN-to-LateT ART, 2029 genes with LateN-to-EarlyT ART and 21782 genes with unaltered LateN+T replication timing). The centre line of the box plot represents the median value, the limits represent the 25th and 75th percentile, and the whiskers extend from the box to the largest and lowest value no further than 1.5 * IQR (interquartile range) away from the box. P-values reflect two-sided paired Wilcoxon tests.
Fig. 3
Fig. 3. The correlation of ART with the mutation distribution across the genome in BRCA and LUAD tumours.
A The association between average replication timing (RT) signals and mutation load in genomic regions 500 kb before and after the start of an unaltered RT or recurrently altered replication timing (ART) domain in breast carcinomas (BRCA) and lung adenocarcinomas (LUAD). B Expected and observed bootstrapped mean mutation load distributions in ART and unaltered RT regions, indicating the timing of ART occurrence relative to mutation accumulation in the most recent common ancestor (MRCA). Upper plots: Expected patterns illustrating how the relative timing of ART should be captured by the number of mutations occurring before or after ART. The distribution in EarlyN-to-LateT regions is expected to be the same as in LateN+T regions when all mutations in the MRCA are accumulated after ART while the distribution is expected to move closer to the distribution in EarlyN+T regions when more mutations are accumulated before ART. Lower plots: Observed distributions of mean mutation load values in different altered and unaltered RT regions per cancer type and their estimated ART timing relative to the mutation accumulation in their MRCA. Middle plot: Bars represent percentages of mutations accumulated prior to ART with percentages from the upper plots highlighted in grey. C The bootstrapped mean mutation load distributions in ART and unaltered RT regions in two LUAD tumours as examples. D Estimated proportions of mutations that were likely accumulated before EarlyN-to-LateT or LateN-to-EarlyT changes in 178 individual LUAD tumours that present a significantly different mutation density in unaltered EarlyN+T versus LateN+T regions. The centre line of the box plot represents the median value, the limits represent the 25th and 75th percentile, and the whiskers extend from the box to the largest and lowest value no further than 1.5 * IQR (interquartile range) away from the box. E Proportions of the genome presenting EarlyN-to-LateT and LateN-to-EarlyT alterations in patient-derived cell cultures (PDCs) from two LUAD tumours from TRACERx patients. F Bootstrapped mean mutation load distributions in ART and unaltered RT regions using mutation and RT information from the same cell line.
Fig. 4
Fig. 4. Alterations to replication timing and chromatin structure in cancer.
A Alluvial plots highlighting the difference in the fraction of genomic bins located in the A compartment and B compartment in unaltered replication timing (RT) and altered replication timing (ART) regions for the two breast carcinoma (BRCA) cell lines MCF-7 (tumour) and T47D (tumour) compared to the cell line derived from their likely tissue-of-origin HMEC (non-malignant as “normal”). B The fraction of the genome exhibiting altered chromatin compartment (ACC) regions in two BRCA cell lines (MCF-7 and T47D) relative to HMEC. C Alluvial plots highlighting the difference in the fraction of genomic bins presenting early and late RT in unaltered chromatin compartment and ACC regions for the two BRCA cell lines MCF-7 (tumour) and T47D (tumour) compared to HMEC (non-malignant as “normal”). D The top panels show the distribution of bootstrapped mean mutation load values in BRCA tumours in unaltered chromatin compartments and ACC regions. The bottom panels show the distribution of bootstrapped mean mutation load values in BRCA tumours in unaltered RT and ART regions. E Variance in BRCA mutation load explained by chromatin or replication timing signal in normal (HMEC) and tumour (MCF-7 or T47D). The bars represent the R2 values derived from separate univariate linear models with mutation load as an independent variable and the chromatin signal or RT signal in normal or cancer cells as a dependent variable. Notably, RT in tumours can explain more of the variance in mutation load than the other factors. F, G The counts (F) and proportions (G) of differently replicated genomic bins classified as A or B compartment in the LUAD cell line A459.
Fig. 5
Fig. 5. The correlation of ART with the activity of DNA damage and repair mechanisms.
A, B Scatter plot comparing the median difference in the exposure of mutational signatures in unaltered LateN+T and EarlyN+T replicated regions (x-axis) against the median difference of mutational signature exposures in altered LateN-to-EarlyT and EarlyN-to-LateT replicated regions (y-axis) in breast carcinoma (BRCA) (A) and lung adenocarcinoma (LUAD) (B) tumours. Signatures located in the top right quadrant were found to be enriched in LateN+T and EarlyN-to-LateT replicated regions. Signatures located in the bottom left quadrant were found to be enriched in EarlyN+T and LateN-to-EarlyT replicated regions. The size of the points demonstrates the fraction of tumours in which the different mutational signatures have been found active. C The number of APOBEC3-mediated omikli mutations (top bar plots) and the unclustered APOBEC3 mutations (bottom bar plots) per Mb in different unaltered replication timing (RT) and altered replication timing (ART) regions in BRCA and LUAD tumours. D The number of APOBEC3 mutations per Mb in an omikli (top) and unclustered (bottom) context in cancer-associated genes localised at different unaltered RT and ART regions in BRCA tumours. Middle plot: the odds ratio is shown as dots and the 95% confidence intervals as vertical lines obtained by Fisher’s tests to investigate whether there was a significant enrichment of APOBEC3-mediated omikli mutations in cancer genes relative to unclustered APOBEC3 mutations in different unaltered RT and ART regions. Cancer-associated genes with LateN-to-EarlyT replication timing in BRCA are highlighted.
Fig. 6
Fig. 6. The genomic and transcriptomic features of ART regions in BRCA and LUAD.
A Comparison of the mean log2 fold change (log2FC) of LateN-to-EarlyT replicated genes (787 genes in BRCA and 634 genes in LUAD) versus 100,000 times randomly selected (bootstrapped) late replicated genes in normal cells, and the equivalent comparison between EarlyN-to-LateT replicated genes (835 genes in BRCA and 377 genes in LUAD) versus bootstrapped early replicated genes in normal cells. Proportions of differentially expressed genes are displayed as pie charts with the numbers and proportions of genes included in each group annotated accordingly. The observed mean log2FC are presented as diamonds in the plot in the middle while the bootstrapped results are shown as dots with error bars. The error bars represent the 95th percentile of the bootstrapped mean log2FC values. B Comparison of the mean copy number values relative to tumour ploidy of LateN-to-EarlyT replicated genes (806 genes in BRCA and 656 genes in LUAD) in cancer cells versus bootstrapped late replicated genes in normal cells, and equivalently the comparison between EarlyN-to-LateT replicated genes (852 genes in BRCA and 387 genes in LUAD) in cancer cells versus bootstrapped early replicated genes in normal cells. The observed values are presented as diamonds while the bootstrapped results are shown as dots with error bars. The error bars represent the 95th percentile of the bootstrapped mean copy number values relative to tumour ploidy. In A, B, the annotated p-values represent the empirical p-values which were calculated by counting how many bootstrapped mean log2FC values of LateN+T genes were greater than the observed mean values of LateN-to-EarlyT genes divided by the total number of iterations, or equivalently, how many bootstrapped mean log2FC values of EarlyN+T genes were lower than the observed mean values of EarlyN-to-LateT genes divided by the total number of iterations. C Cancer-associated genes identified in altered replication timing (ART) regions in breast carcinoma (BRCA) and lung adenocarcinoma (LUAD).

References

    1. Martincorena I, et al. Universal patterns of selection in cancer and somatic tissues. Cell. 2018;173:1823. doi: 10.1016/j.cell.2018.06.001. - DOI - PMC - PubMed
    1. Rhind N, Gilbert DM. DNA replication timing. Cold Spring Harb. Perspect. Biol. 2013;5:a010132. doi: 10.1101/cshperspect.a010132. - DOI - PMC - PubMed
    1. Ryba T, et al. Evolutionarily conserved replication timing profiles predict long-range chromatin interactions and distinguish closely related cell types. Genome Res. 2010;20:761–770. doi: 10.1101/gr.099655.109. - DOI - PMC - PubMed
    1. Rivera-Mulia JC, et al. Replication timing alterations in leukemia affect clinically relevant chromosome domains. Blood Adv. 2019;3:3201–3213. doi: 10.1182/bloodadvances.2019000641. - DOI - PMC - PubMed
    1. Kenigsberg E, et al. The mutation spectrum in genomic late replication domains shapes mammalian GC content. Nucleic Acids Res. 2016;44:4222–4232. doi: 10.1093/nar/gkw268. - DOI - PMC - PubMed

LinkOut - more resources