. 2024 Jul 17;15(1):5543.
doi: 10.1038/s41467-024-49805-w.

Host-derived protein profiles of human neonatal meconium across gestational ages

Affiliations

Host-derived protein profiles of human neonatal meconium across gestational ages

Yoshihiko Shitara et al. Nat Commun. .

Erratum in

Abstract

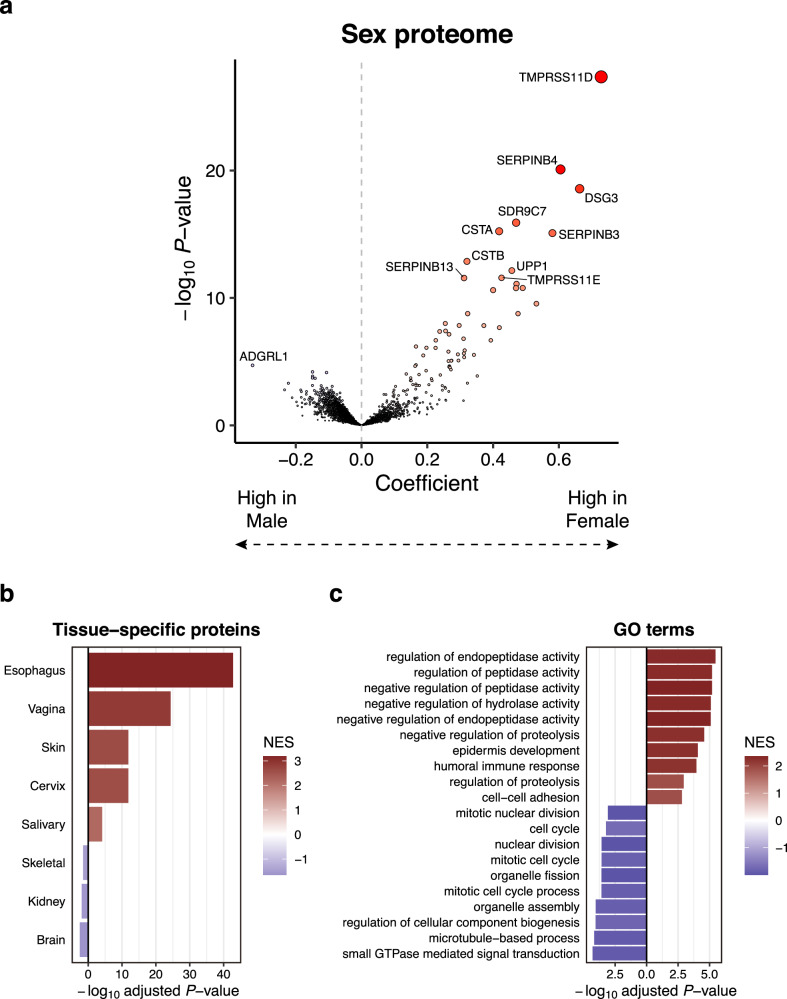
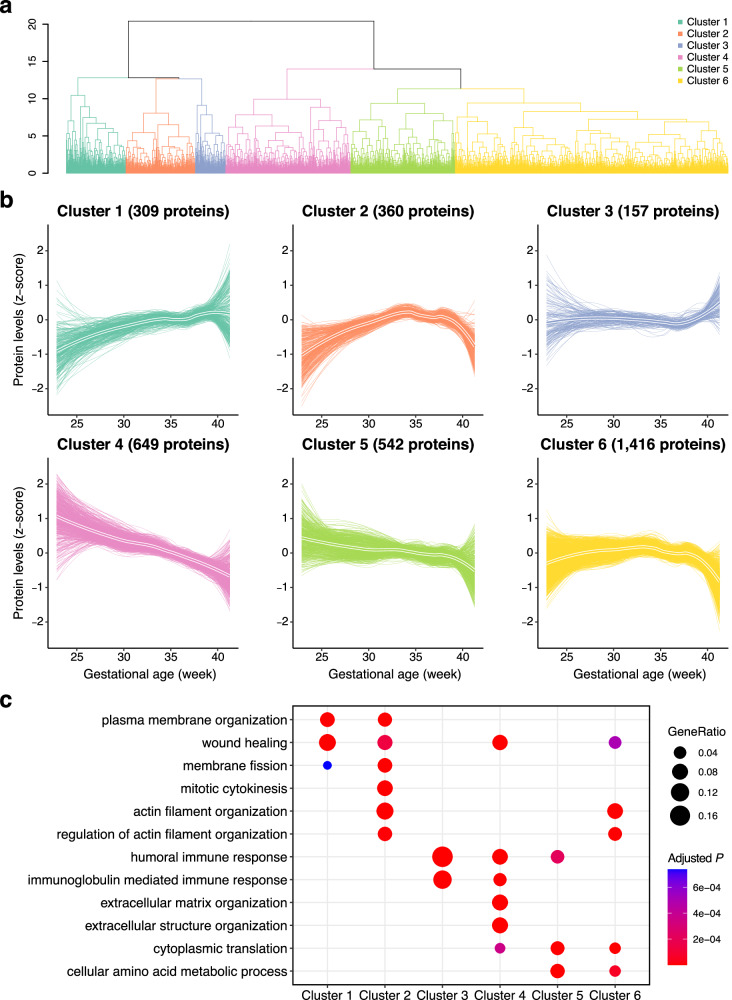
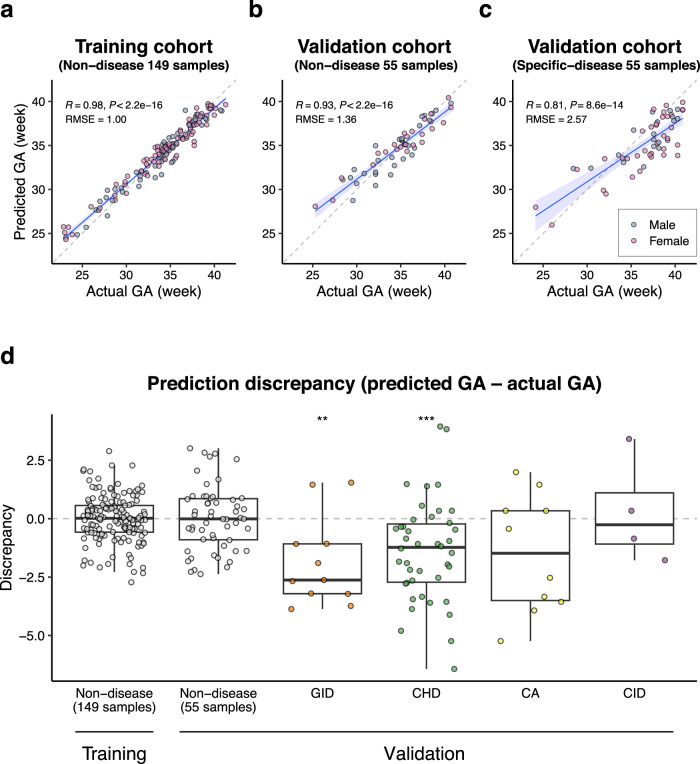
Meconium, a non-invasive biomaterial reflecting prenatal substance accumulation, could provide valuable insights into neonatal health. However, the comprehensive protein profile of meconium across gestational ages remains unclear. Here, we conducted an extensive proteomic analysis of first meconium from 259 newborns across varied gestational ages to delineate protein composition and elucidate its relevance to neonatal diseases. The first meconium samples were collected, with the majority obtained before feeding, and the mean time for the first meconium passage from the anus was 11.9 ± 9.47 h. Our analysis revealed 5370 host-derived meconium proteins, which varied depending on sex and gestational age. Specifically, meconium from preterm infants exhibited elevated concentrations of proteins associated with the extracellular matrix. Additionally, the protein profiles of meconium also exhibited unique variations depending on both specific diseases, including gastrointestinal diseases, congenital heart diseases, and maternal conditions. Furthermore, we developed a machine learning model to predict gestational ages using meconium proteins. Our model suggests that newborns with gastrointestinal diseases and congenital heart diseases may have immature gastrointestinal systems. These findings highlight the intricate relationship between clinical parameters and meconium protein composition, offering potential for a novel approach to assess neonatal gastrointestinal health.


Conflict of interest statement

The authors declare no competing interests.

Figures

Fig. 1
Fig. 1. Data-independent acquisition proteome analysis of the first meconium.
a Schematic overview of the analytical process used for the comprehensive analysis of the meconium proteome. W weeks. b Flowchart of the newborn baby selection process. NICU neonatal intensive care unit. c Detection of human-derived meconium proteins using proteomic analysis. The x-axis represents the number of samples in which the number of proteins shown on the y-axis was detected. d Verification of the origin of the identified 3433 proteins using the Human Protein Atlas (HPA). The bar plot displays the number of tissue-specific proteins, while the line graph shows the proportion of proteins identified in each tissue. Tissues are sorted based on the proportion of proteins. e Gene ontology (GO) term over-representation analysis of the identified 3433 proteins. The bar plot displays the number of proteins associated with each category. Colours represent the significance of enrichment. The top 20 significantly enriched GO terms are shown. P-values were calculated using a one-sided hypergeometric test with Benjamini–Hochberg correction.
Fig. 2
Fig. 2. Differential composition of host-derived meconium proteins between males and females.
a Volcano plot showing the changes in the meconium proteome between males and females. The x-axis represents the effect size, indicated by the coefficient, while the y-axis displays the statistical significance, represented by -log10(P-value). Positive coefficients indicate higher abundance in females, while negative coefficients indicate higher abundance in males. P-values for each coefficient were calculated using a two-sided t-test without adjustment for multiple testing. b Bar plots showing the significant enrichment (adjusted P < 0.05) of tissues specifically expressing proteins that are abundant in females (red) and males (blue). P-values were calculated using a permutation test with Benjamini–Hochberg correction, based on the GSEA algorithm as implemented in the R package fgsea. c Bar plots showing the top 10 significantly enriched Gene ontology (GO) terms of proteins that are abundant in females (red) and males (blue). NES normalised enrichment score. P-values were calculated using a permutation test with Benjamini–Hochberg correction, based on the GSEA algorithm as implemented in the R package fgsea.
Fig. 3
Fig. 3. Clustering of host-derived meconium protein trajectories during gestational ageing.
a Unsupervised hierarchical clustering of 3,433 meconium proteins with similar trajectories. b Protein trajectories of the six identified clusters. Thicker lines represent the average trajectory for each cluster. c Gene ontology (GO) term enrichment analysis of the proteins in each cluster. P-values were calculated using a one-sided hypergeometric test with Benjamini–Hochberg correction.
Fig. 4
Fig. 4. Exploring meconium protein profiles for antenatal diseases.
Volcano plots showing the changes in the meconium proteome with GID (a), CHD (b), CA (c), and CID (d). The x-axis represents the effect size, indicated by the coefficient, while the y-axis displays the statistical significance, represented by -log10(P-value). Positive coefficients indicate higher abundance in the disease samples, while negative coefficients indicate lower abundance. P-values for each coefficient were calculated using a two-sided t-test without adjustment for multiple testing. Bar plots showing the top 10 significantly enriched Gene ontology (GO) terms of proteins that are more abundant in the disease samples (red; GID (e), CHD (f), CA (g), and CID (h)) and less abundant in the disease samples (blue). P-values were calculated using a permutation test with Benjamini–Hochberg correction, based on the GSEA algorithm as implemented in the R package fgsea. NES normalised enrichment scores.
Fig. 5
Fig. 5. Potential for prediction of gestational age by meconium proteomic analysis.
a Gestational age (GA) prediction in the training cohort (excluding specific diseases, 149 samples). RMSE root-mean-square error. Shaded areas around regression lines represent the 95% confidence interval. b GA prediction in the validation cohort (excluding specific diseases, 55 samples). RMSE root-mean-square error. Shaded areas around regression lines represent the 95% confidence interval. c GA prediction in the validation cohort (specific diseases, 55 samples). The blue and red dots represent males and females, respectively. Pearson correlation coefficients and two-sided P-values between the actual GA and predicted GA are shown. RMSE: root-mean-square error. Shaded areas around regression lines represent the 95% confidence interval. d Comparison of the difference between the actual GA and predicted GA among the cohorts: Training Non-disease (149 samples) vs. Validation Non-disease (55 samples) vs. Specific diseases (GID: 11 samples, CHD: 42 samples, CA: 10 samples, CI: 4 samples). GID gastrointestinal disease, CHD congenital heart disease, CA chromosomal abnormality, CID congenital infection disease. Statistical analyses compared with the Validation Non-disease cohort were performed using the Wilcoxon rank-sum test; **P = 0.002, ***P = 0.0002. Centrelines within box plots represent medians. Box limits indicate 25th and 75th percentiles, and the whiskers extend to 1.5 times IQR of 25th and 75th percentiles.

References

    1. Glass, H. C. et al. Outcomes for extremely premature infants. Anesth. Analg.120, 1337–1351 (2015). - PMC - PubMed
    1. Patel, R. M. et al. Causes and timing of death in extremely premature infants from 2000 through 2011. N. Engl. J. Med.372, 331–340 (2015). - PMC - PubMed
    1. Helenius, K. et al. Survival in very preterm infants: an international comparison of 10 national neonatal networks. Pediatrics140, e20171264 (2017). - PubMed
    1. AlFaleh, K. & Anabrees, J. Probiotics for prevention of necrotizing enterocolitis in preterm infants. Evid. Based Child Health9, 584–671 (2014). - PubMed
    1. Yamoto, M. et al. Risk factors and prevention for surgical intestinal disorders in extremely low birth weight infants. Pediatr. Surg. Int.32, 887–893 (2016). - PubMed

LinkOut - more resources