. 2024 Jul 17;15(1):6025.
doi: 10.1038/s41467-024-50384-z.

Selective pressures of platinum compounds shape the evolution of therapy-related myeloid neoplasms

Affiliations

Selective pressures of platinum compounds shape the evolution of therapy-related myeloid neoplasms

Eline J M Bertrums et al. Nat Commun. .

Abstract

Therapy-related myeloid neoplasms (t-MN) arise as a complication of chemo- and/or radiotherapy. Although t-MN can occur both in adult and childhood cancer survivors, the mechanisms driving therapy-related leukemogenesis likely vary across different ages. Chemotherapy is thought to induce driver mutations in children, whereas in adults pre-existing mutant clones are selected by the exposure. However, selective pressures induced by chemotherapy early in life are less well studied. Here, we use single-cell whole genome sequencing and phylogenetic inference to show that the founding cell of t-MN in children starts expanding after cessation of platinum exposure. In patients with Li-Fraumeni syndrome, characterized by a germline TP53 mutation, we find that the t-MN already expands during treatment, suggesting that platinum-induced growth inhibition is TP53-dependent. Our results demonstrate that germline aberrations can interact with treatment exposures in inducing t-MN, which is important for the development of more targeted, patient-specific treatment regimens and follow-up.


Conflict of interest statement

The authors declare no competing interests.

Figures
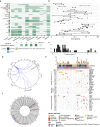
Fig. 1
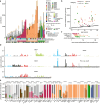
Fig. 1. Pediatric t-MN (n = 44) is mainly driven by KMT2A fusions.
a A table depicting the different first diagnoses of t-MN patients and the treatment categories that each patient received. ALL: acute lymphoblastic leukemia; AML: acute myeloid leukemia; bT: beta-thalassemia; FA: Fanconi anemia; MDS: myelodysplastic syndrome; NB: neuroblastoma; NGB: neuroganglioblastoma; OS: osteosarcoma; SCT: allogenic stem cell transplantation; TLBL: T-cell lymphoblastic lymphoma; TOPi: topoisomerase inhibitors. The country in which the sample was collected is indicated in the left side of the table. b Per-patient timelines depicting the latency time between the first diagnosis and the t-MN diagnosis. Rows per patient match with (a). c Distribution of latency times in years. d Circos plot of the structural variants (n = 72) in t-MN patients that involved at least one cancer gene. e Oncoprint depicting the clonal driver events that were present in t-MN samples. The bar plots on top represent the number of driving events present in each sample. Small drivers are only included if they occurred in more than one patient. CN-LOH: copy neutral loss of heterozygosity. f Circos plot depicting the copy number profiles of all t-MN samples. Source data are provided as a Source Data file.
Fig. 2
Fig. 2. Mutational processes underlying the increased mutation load in pediatric t-MN (n = 44).
a The contribution of each single base substitution signature to t-MN blasts of each patient, obtained after bootstrapped (n = 100) refitting of signatures that were extracted by non-negative matrix factorization. The first bar below the plot represents the first diagnosis (abbreviations conform Fig. 1a), the second bar notes if a pathogenic germline mutation was found, the third bar represents the treatment category (>150 mutations of that treatment type, or otherwise “clock-like”) and the last bar indicates the country in which the sample was collected. b Mutation accumulation of t-MN (colored dots) compared to the baseline of healthy blood cells (black dots). The color is similar to the grouping in (a). c The ratio of the number of observed versus expected single base substitutions in all t-MN samples within a specific signature-category (as in (b)). N = 44. Here and in all other figures, the box plots depict the median (center line), 25th and 75th percentiles (box), and the largest values, no more than 1.5 * the interquartile range (whiskers). d The 96-trinucleotide single base substitution profiles of SBSD-G and the profile of the previously defined signature sbs25 (Pich et al.). e The probability that different driver mutations (n = 59) were caused by treatment-related or clock-like signatures. Colors are similar to signatures in (a). Source data are provided as a Source Data file.
Fig. 3
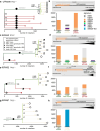
Fig. 3. Clonal evolution of t-MN under platinum treatment in patients without germline TP53 aberrations.
a Phylogenetic tree of clonally expanded HSPCs and bulk t-MN blasts of patient UPN008 (TP53 wild-type). Pie charts indicate the contribution of SBS31 after strict refitting (max_delta < 0.01). The colors of the branches correspond to the type of mutation, clonal, subclonal, or private, which is annotated in the same color text. Small black numbers at splits in the trees indicate in what number of CellPhy bootstraps the split was found, out of 100. b Signature contribution of the mutations in the corresponding branches in the lineage tree on the left. The private HSPC mutations were subsampled to 2000 mutations for visual purposes. Top: schematic overview of the timeline of the different diagnoses and treatment, including the timing of t-MN development. c Similar to (a), but for patient IBFM42 (TP53 wild-type). Also single-cell sequenced HSPCs (black squares) and t-MN blasts (black triangles) are included. SBS31 contribution to the clonal branch was supported by 100/100 bootstraps. In the private branch, SBS31 was found in 40/100 bootstraps. d Similar to (b), but for patient IBFM42. e similar to (a), but for patient IBFM32 (TP53 wild-type). f Similar to (b), but for patient IBFM32. g Similar to (a), but for patient IBFM67 (TP53 wild-type). Single-cell t-MN blasts and single HSPCs were sequenced. All sequenced HSPCs shared the KMT2A rearrangement with the t-MN blasts. h Similar to (b), but for patient IBFM67. Source data are provided as a Source Data file.
Fig. 4
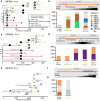
Fig. 4. Clonal evolution of t-MN under platinum treatment in patients with germline TP53 aberrations.
a Phylogenetic tree of single HSPCs (black squares) and bulk and single (black triangles) t-MN blasts of patient IBFM22 who had LFS and a TP53-/- t-MN. Pie charts indicate the contribution of SBSD after strict refitting (max_delta < 0.01). Small black numbers at splits in the trees indicate in what number of CellPhy bootstraps the split was found, out of 100. UPD: uniparental disomy b Signature contribution of the mutations in the corresponding branches in the lineage tree on the left. Top: schematic overview of the timeline of the different diagnoses and treatment, including the timing of t-MN development. c Similar to (a), but for patient UPN034 who had LFS. Clonally expanded HSPCs (white squares) were sequenced. Pie charts indicate the contribution of SBS31 after strict refitting (max_delta < 0.01) (d) Similar to (b), but for patient UPN034. The HSPC private mutations were subsampled to 2000 mutations for visual purposes. CH: clonal hematopoiesis, FU: follow-up. In the schematic, the evolution of the t-MN, not the CH, is drawn. 0% blasts were detected in the FU sample by diagnostic MRD measurements. e Similar to (a), but for patient IBFM14 who had a TP53+/- t-MN. Pie charts indicate the contribution of SBS31 after strict refitting (max_delta < 0.01) f Similar to (b), but for patient IBFM14. Source data are provided as a Source Data file.
Fig. 5
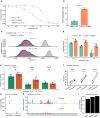
Fig. 5. TP53 deficiency enables increased proliferation under platinum treatment.
a Dose-response curves of MV4-11WT (circles) and MV4-11R248W, based on the DAPI-negative fraction of single cells (gating strategy in Supplementary Fig. 9b), n = 3 biological replicates per cell line (average of three clones). The complete dose-response model was tested against the null model, lacking genotype information (ANOVA). b The IC50 values of carboplatin treatment per genotype (average of three cells), extracted from the dose-response models depicted in (a). The comparison of the IC50 values is based on a z-test and error-bars represent the standard error (p = 1.58 * 10−27). c CellTrace™ signal per treatment condition, normalized to unit area, for MV4-11WT cells (top) and MV4-11R428W cells (bottom). Representative measurements for a single clone per genotype are shown. d Proliferation Score per treatment condition for MV4-11WT and MV4-11R248W. The scores of each cell line were compared within treatment conditions using a Holm’s corrected one-sided T-test (p = 0.0428, 0.00936, and 0.0366 for 0.37, 1.1, and 3.3 μM carboplatin, respectively). Error bars represent standard deviation of the mean of three independent experiments. e Normalized viability of CD34+ umbilical cord blood cells after 4, 8, and 12 days of carboplatin treatment (22.5 μM), based on the live cell count per condition. The viability was normalized to each matched untreated condition and compared using a Holm’s corrected one-sided T-test. Error bars represent the standard error of the mean of n = 3 biological donors, each examined in an independent experiment. f The KO score of the TP53 KO conditions based on ICE analysis (Synthego) with and without carboplatin treatment (22.5 μM). The KO score was compared using a one-sided paired T-test (p = 0.036, 0.012, and 0.036 for D4, D8, and D12, respectively) and each data point represents a biological replicate (n = 3 independent experiments, one unique biological donor per experiment). g The number of single base substitutions detected in WGS data of untreated and carboplatin-treated clonally expanded umbilical cord blood cells. h The 96-trinucleotide mutational profiles of the data shown in (g). i The cosine similarity between the mutational profile of carboplatin-treated umbilical cord blood cells and the mutational profile of in vivo platinum-based drug exposure (SBS31, SBS35, SBSD). NS not significant, ****p < 0.0001, **p < 0.01, *p < 0.05. Source data are provided as a Source Data file.

References

    1. Hurley LH. DNA and its associated processes as targets for cancer therapy. Nat. Rev. Cancer. 2002;2:188–200. doi: 10.1038/nrc749. - DOI - PubMed
    1. Voso MT, Falconi G, Fabiani E. What’s new in the pathogenesis and treatment of therapy-related myeloid neoplasms. Blood. 2021;138:749–757. doi: 10.1182/blood.2021010764. - DOI - PubMed
    1. McNerney ME, Godley LA, Le Beau MM. Therapy-related myeloid neoplasms: when genetics and environment collide. Nat. Rev. Cancer. 2017;17:513–527. doi: 10.1038/nrc.2017.60. - DOI - PMC - PubMed
    1. Teepen JC, et al. Long-term risk of subsequent malignant neoplasms after treatment of childhood cancer in the DCOG LATER study cohort: role of chemotherapy. J. Clin. Oncol. 2017;35:2288–2298. doi: 10.1200/JCO.2016.71.6902. - DOI - PubMed
    1. Aguilera DG, et al. Pediatric therapy-related myelodysplastic syndrome/acute myeloid leukemia: the MD Anderson cancer center experience. J. Pediatr. Hematol. Oncol. 2009;31:803–811. doi: 10.1097/MPH.0b013e3181ba43dc. - DOI - PubMed

LinkOut - more resources