

Identifying subtypes and developing prognostic models based on N6-methyladenosine and immune microenvironment related genes in breast cancer
- PMID: 39020010
- PMCID: PMC11255230
- DOI: 10.1038/s41598-024-67477-w
Identifying subtypes and developing prognostic models based on N6-methyladenosine and immune microenvironment related genes in breast cancer
Abstract
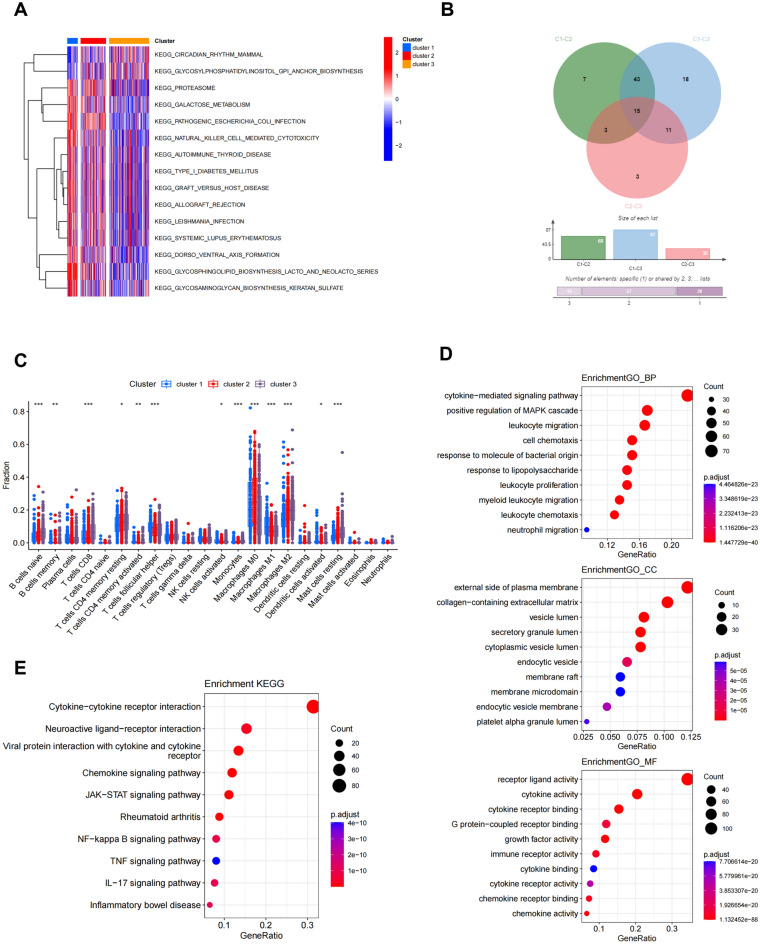
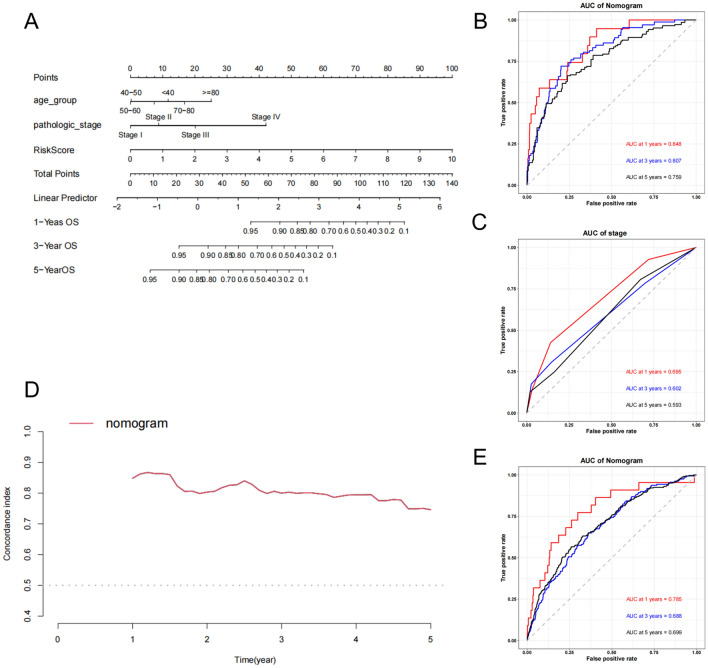
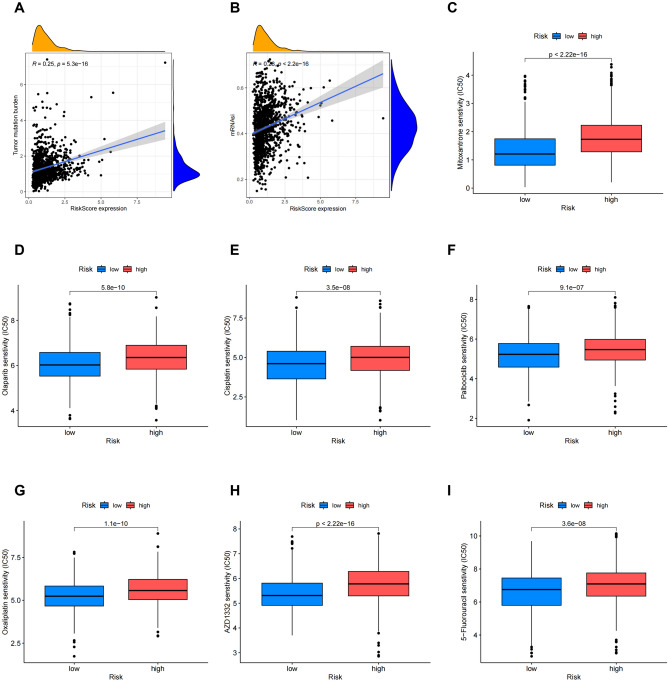
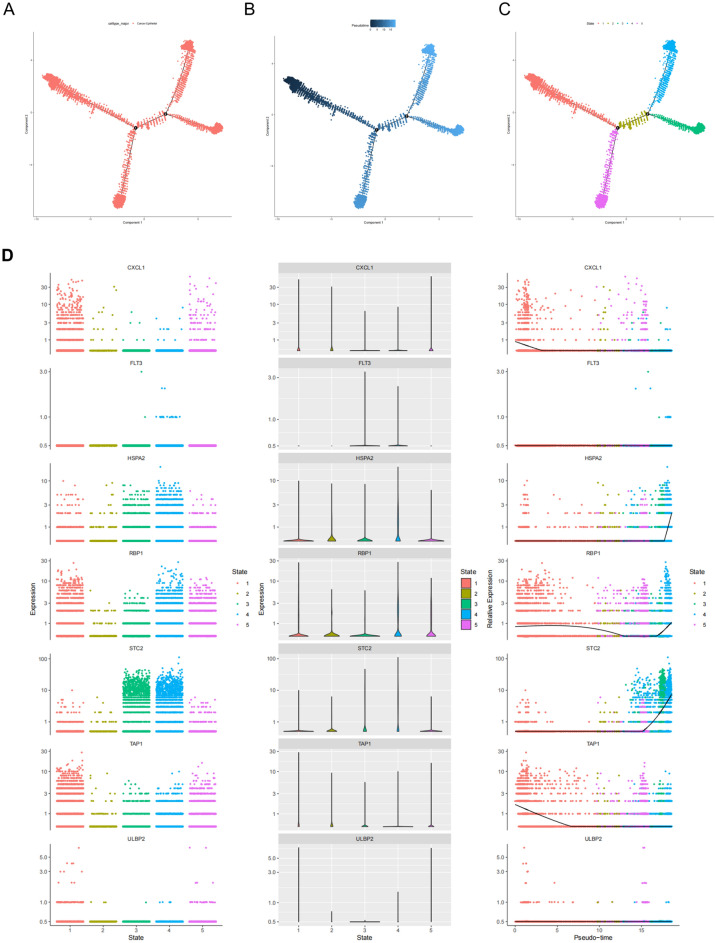
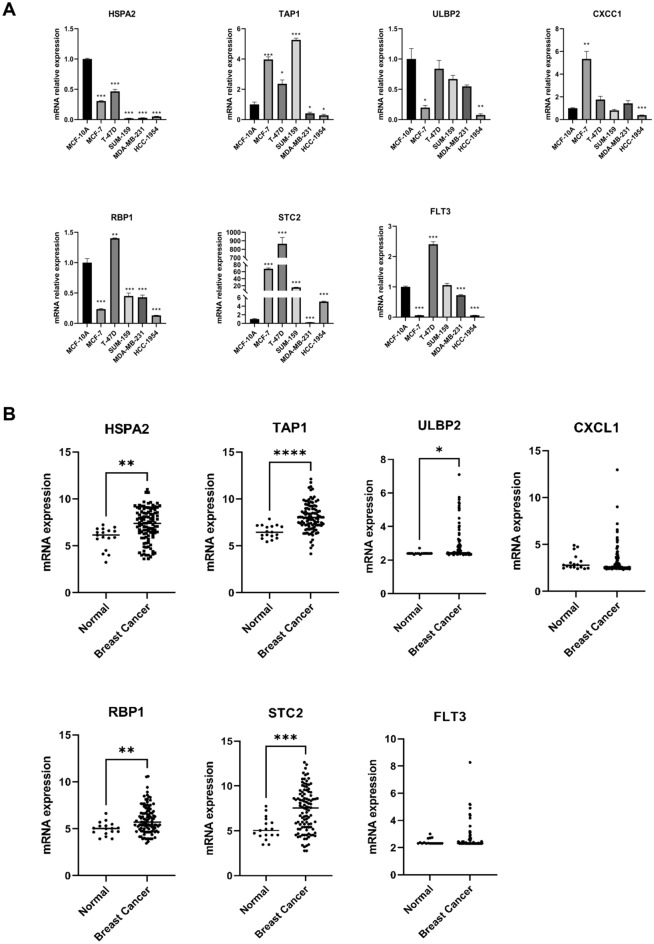
Breast cancer (BC) is the most prevalent cancer in women globally. The tumor microenvironment (TME), comprising epithelial tumor cells and stromal elements, is vital for breast tumor development. N6-methyladenosine (m6A) modification plays a key role in RNA metabolism, influencing its various aspects such as stability and translation. There is a notable link between m6A methylation and immune cells in the TME, although this relationship is complex and not fully deciphered. In this research, BC expression and clinicopathological data from TCGA were scrutinized to assess expression profiles, mutations, and CNVs of 31 m6A genes and immune microenvironment-related genes, examining their correlations, functions, and prognostic impacts. Lasso and Cox regression identified prognostic genes for constructing a nomogram. Single-cell analyses mapped the distribution and patterns of these genes in BC cell development. We investigated associations between gene-derived risk scores and factors like immune infiltration, TME, checkpoints, TMB, CSC indices, and drug response. As a complement to computational analyses, in vitro experiments were conducted to confirm these expression patterns. We included 31 m6A regulatory genes and discovered a correlation between these genes and the extent of immune cell infiltration. Subsequently, a 7-gene risk score was generated, encompassing HSPA2, TAP1, ULBP2, CXCL1, RBP1, STC2, and FLT3. It was observed that the low-risk group exhibited better overall survival (OS) in BC, with higher immune scores but lower tumor mutational burden (TMB) and cancer stem cell (CSC) indices, as well as lower IC50 values for commonly used drugs. To enhance clinical applicability, age and stage were incorporated into the risk score, and a more comprehensive nomogram was constructed to predict OS. This nomogram was validated and demonstrated good predictive performance, with area under the curve (AUC) values for 1-year, 3-year, and 5-year OS being 0.848, 0.807, and 0.759, respectively. Our findings highlight the profound impact of prognostic-related genes on BC immune response and prognostic outcomes, suggesting that modulation of the m6A-immune pathway could offer new avenues for personalized BC treatment and potentially improve clinical outcomes.
Keywords: Breast cancer; Gene signature; Immune microenvironment; N6-methyladenosine; Prognosis.
© 2024. The Author(s).
Conflict of interest statement
The authors declare no competing interests.
Figures


Similar articles
-
Exploring the role of mitophagy-related genes in breast cancer: subtype classification and prognosis prediction.Int J Med Sci. 2024 Oct 14;21(14):2664-2682. doi: 10.7150/ijms.100785. eCollection 2024. Int J Med Sci. 2024. PMID: 39512680 Free PMC article.
-
m6A related metabolic genes in breast cancer and their relationship with prognosis.Int Immunopharmacol. 2025 Feb 20;148:114121. doi: 10.1016/j.intimp.2025.114121. Epub 2025 Jan 30. Int Immunopharmacol. 2025. PMID: 39889412
-
The N6-methyladenosine methylation landscape stratifies breast cancer into two subtypes with distinct immunological characteristics.Clin Exp Pharmacol Physiol. 2024 Jul;51(7):e13875. doi: 10.1111/1440-1681.13875. Clin Exp Pharmacol Physiol. 2024. PMID: 38797522
-
The Mechanisms, Research Status, and Future Prospects of m6A Modification in Breast Cancer.J Gene Med. 2025 Feb;27(2):e70014. doi: 10.1002/jgm.70014. J Gene Med. 2025. PMID: 39972939 Free PMC article. Review.
-
m6A modification of RNA in cervical cancer: role and clinical perspectives.RNA Biol. 2024 Jan;21(1):49-61. doi: 10.1080/15476286.2024.2408707. Epub 2024 Sep 30. RNA Biol. 2024. PMID: 39344658 Free PMC article. Review.
Cited by
-
Identification of a Potential PGK1 Inhibitor with the Suppression of Breast Cancer Cells Using Virtual Screening and Molecular Docking.Pharmaceuticals (Basel). 2024 Dec 5;17(12):1636. doi: 10.3390/ph17121636. Pharmaceuticals (Basel). 2024. PMID: 39770478 Free PMC article.
-
Unraveling the Role of N6-Methylation Modification: From Bone Biology to Osteoporosis.Int J Med Sci. 2025 May 8;22(11):2545-2559. doi: 10.7150/ijms.108763. eCollection 2025. Int J Med Sci. 2025. PMID: 40520903 Free PMC article. Review.
References
-
- DeSantis CE, Bray F, Ferlay J, Lortet-Tieulent J, Anderson BO, Jemal A. International variation in female breast cancer incidence and mortality rates. Cancer Epidemiol. Biomarker. Prev. 2015;24:1495–1506. - PubMed
-
- Siegel RL, Miller KD, Fuchs HE, Jemal A. Cancer statistics, 2022. CA Cancer J. Clin. 2022;72:7–33. - PubMed
-
- Anastasiadi Z, Lianos GD, Ignatiadou E, Harissis HV, Mitsis M. Breast cancer in young women: An overview. Updates Surg. 2017;69:313–317. - PubMed
-
- Rizzo A, Cusmai A, Acquafredda S, Rinaldi L, Palmiotti G. Ladiratuzumab vedotin for metastatic triple negative cancer: Preliminary results, key challenges, and clinical potential. Expert Opin. Investig. Drugs. 2022;31:495–498. - PubMed
MeSH terms
Substances
Grants and funding
LinkOut - more resources
Full Text Sources
Medical
Research Materials
Miscellaneous
