. 2024 Aug;27(8):1475-1488.
doi: 10.1038/s41593-024-01714-3. Epub 2024 Jul 17.

Astrocytes require perineuronal nets to maintain synaptic homeostasis in mice

Affiliations

Astrocytes require perineuronal nets to maintain synaptic homeostasis in mice

Bhanu P Tewari et al. Nat Neurosci. 2024 Aug.

Abstract

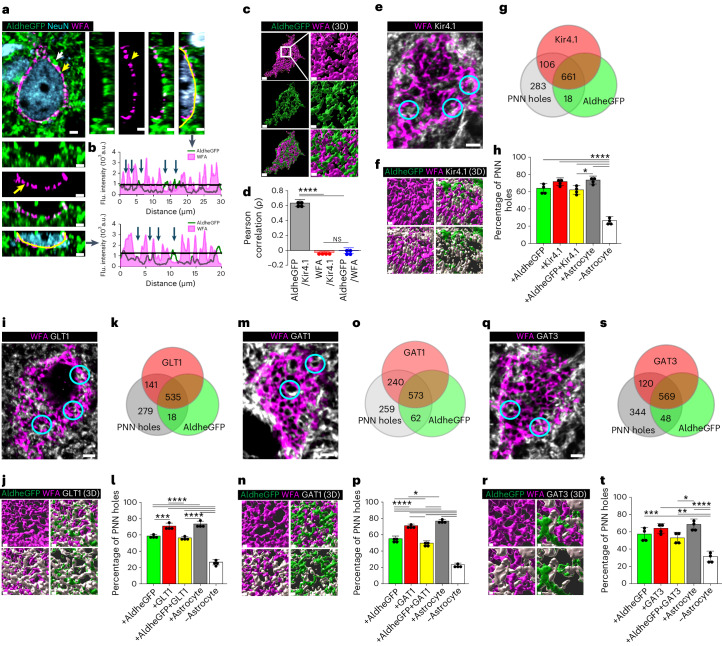
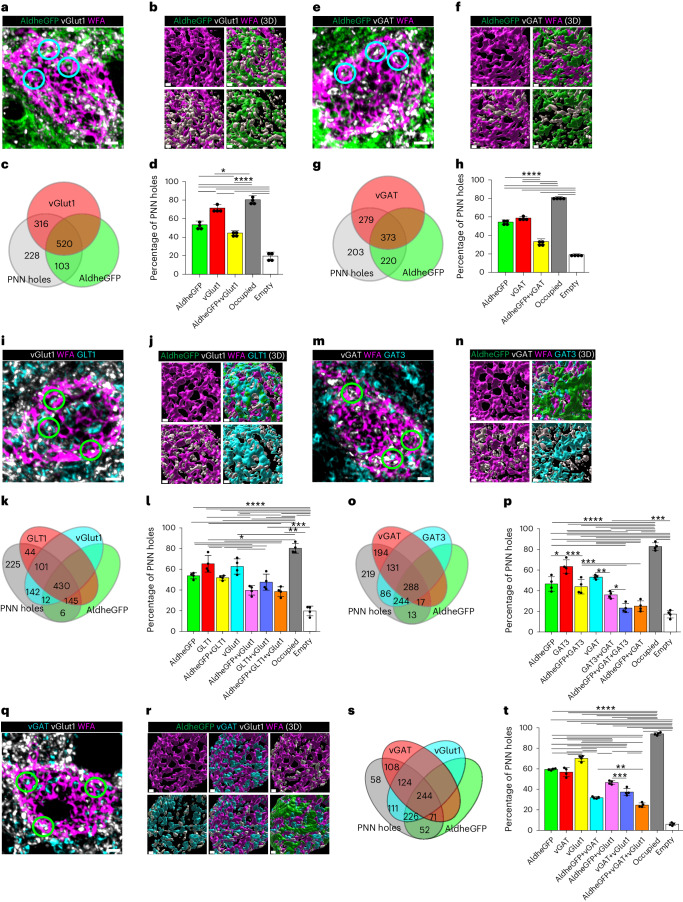
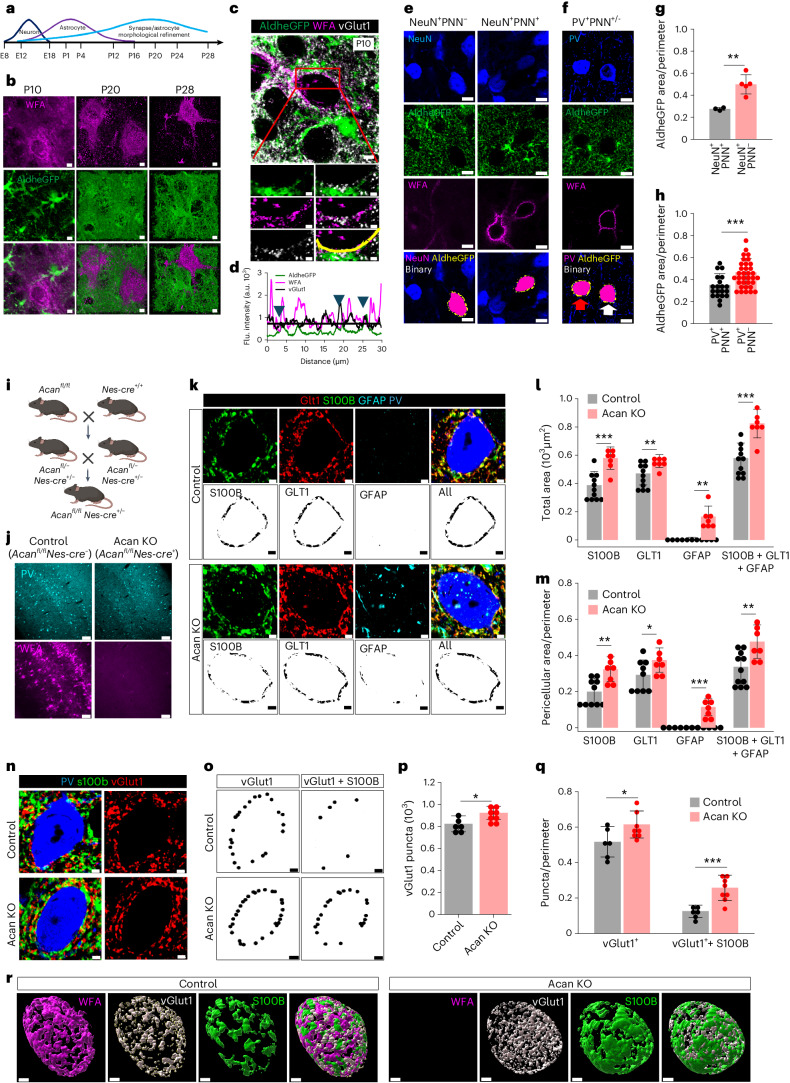
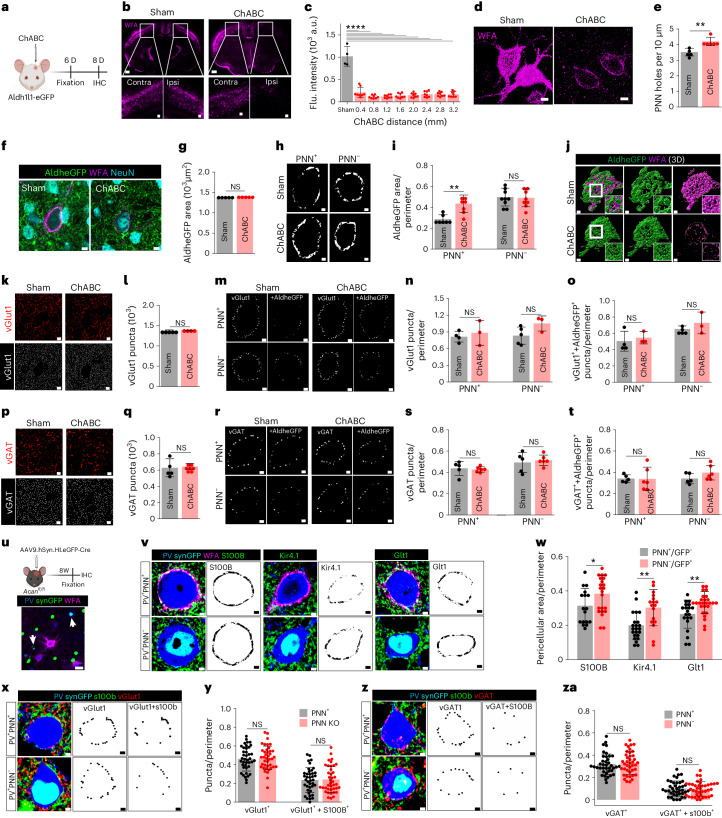
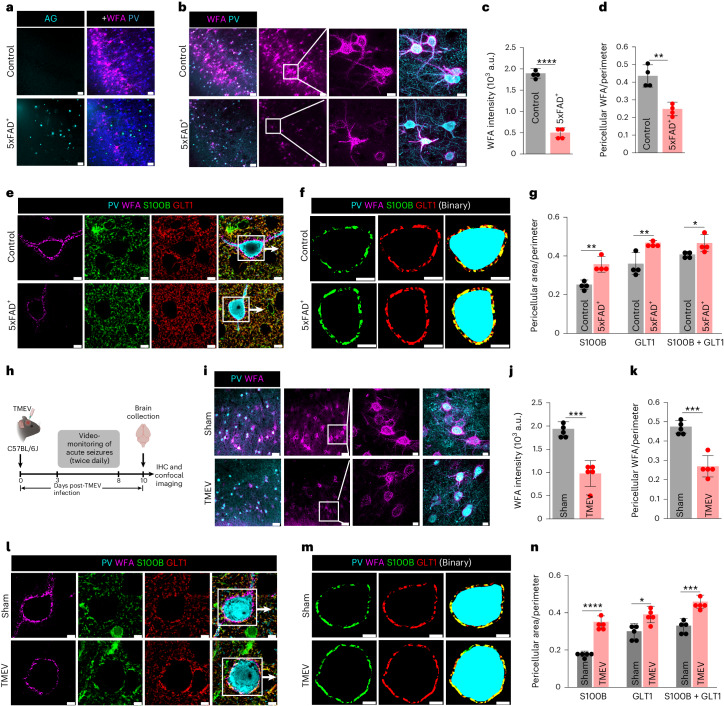
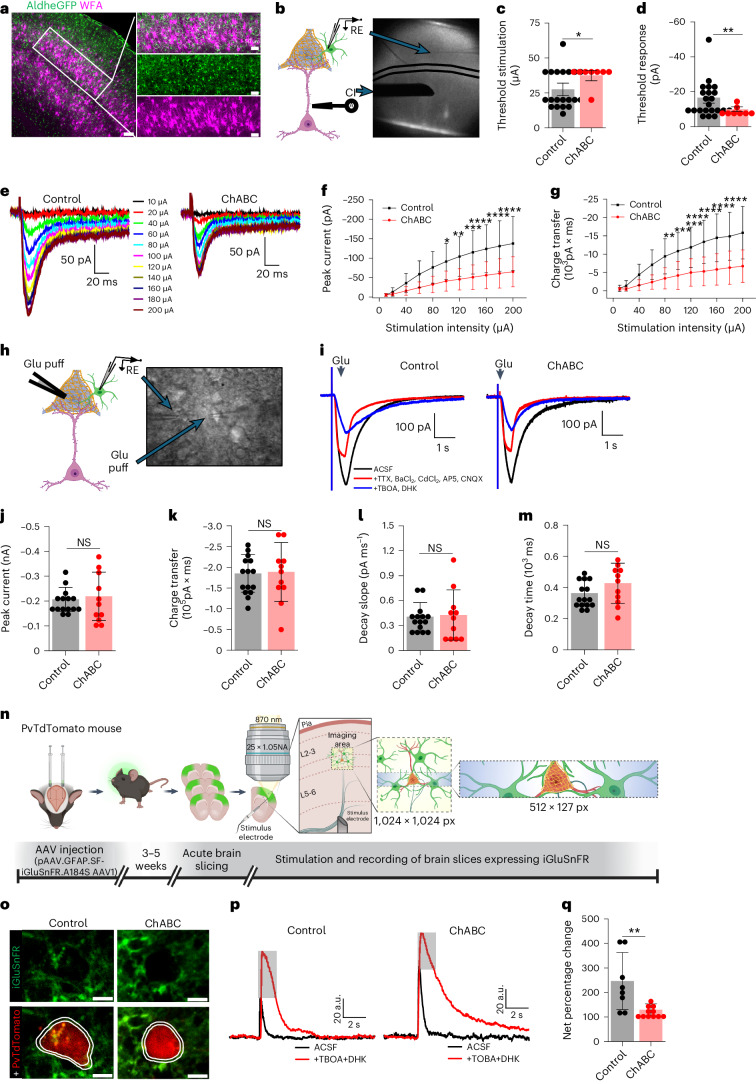
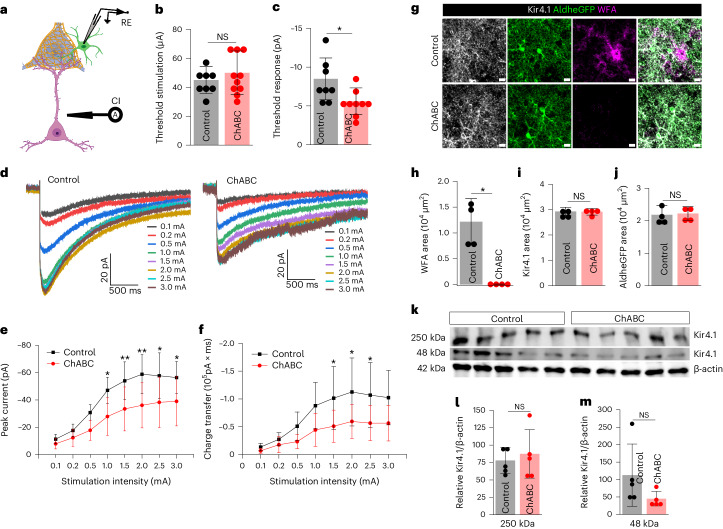
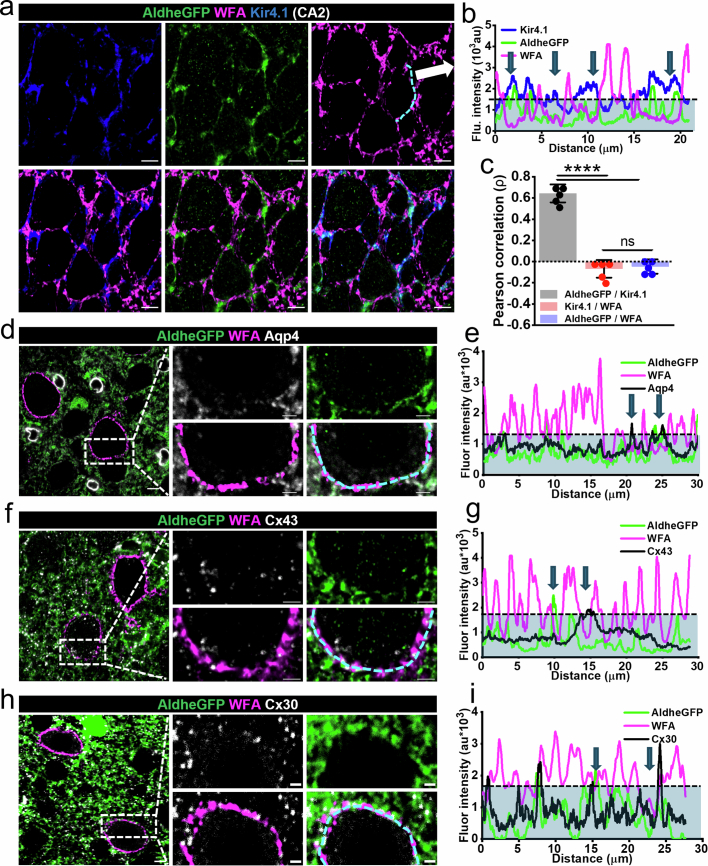
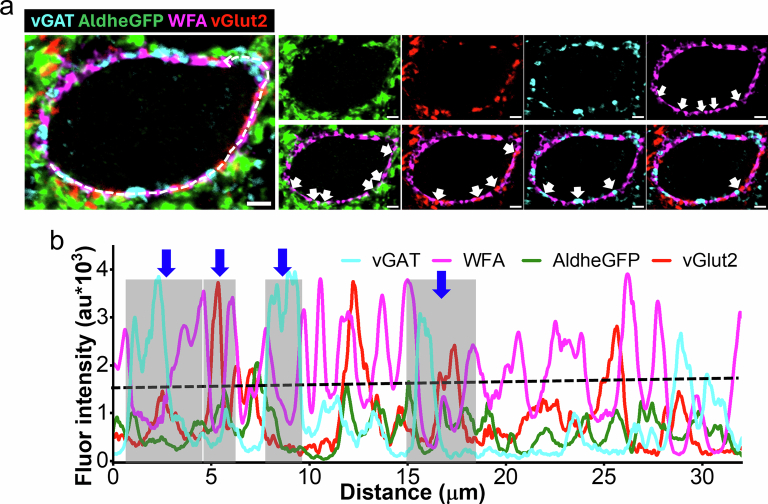
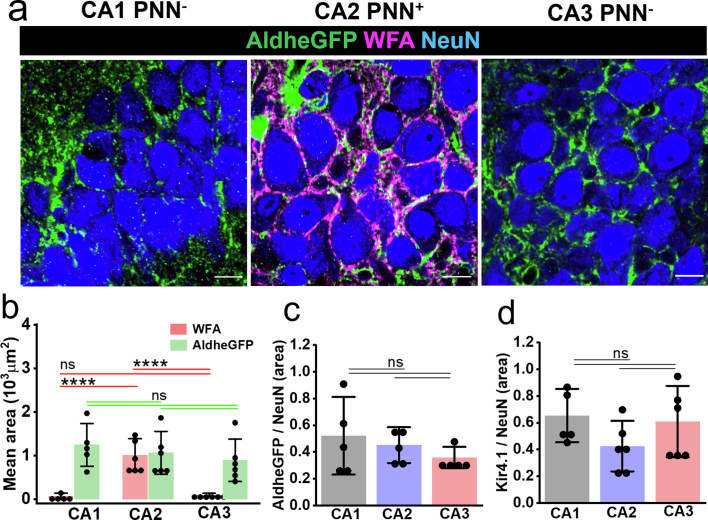
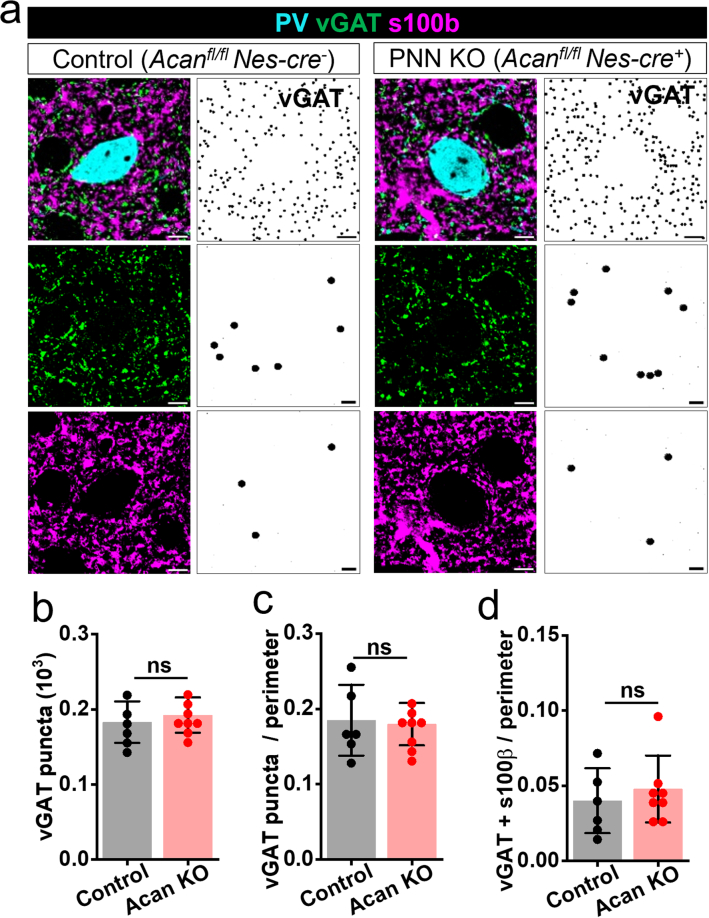
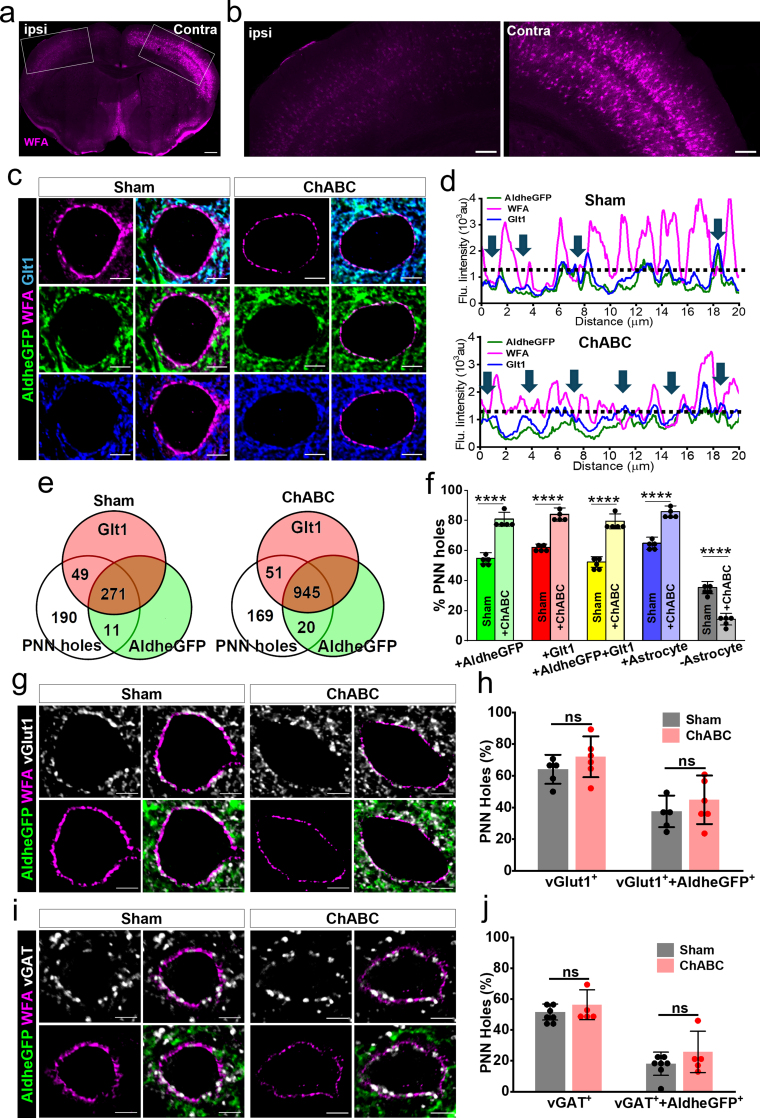
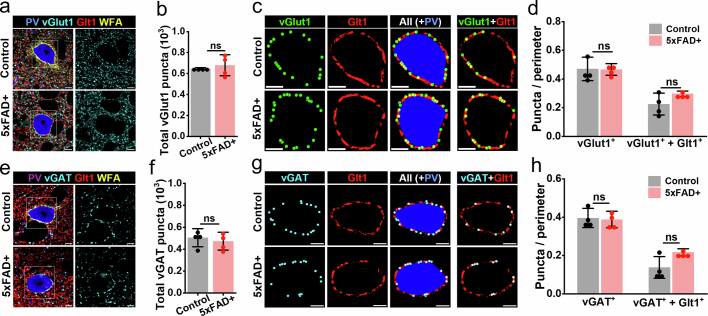
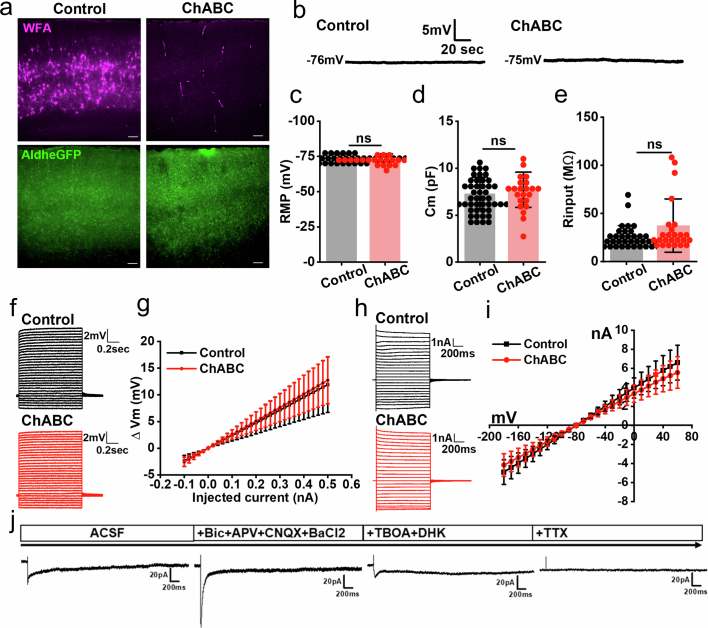
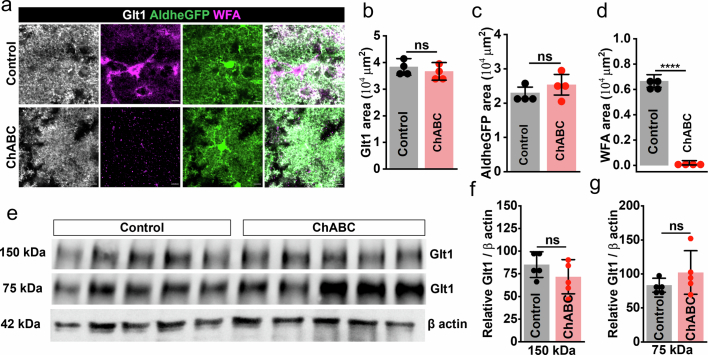
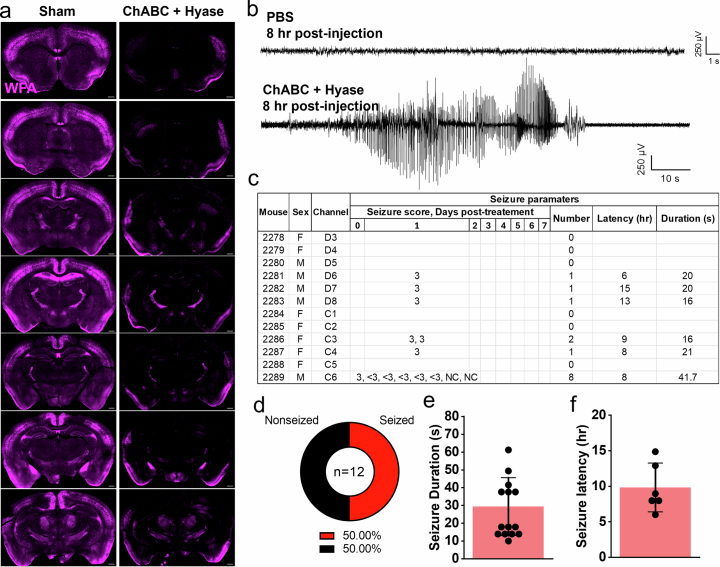
Perineuronal nets (PNNs) are densely packed extracellular matrices that cover the cell body of fast-spiking inhibitory neurons. PNNs stabilize synapses inhibiting synaptic plasticity. Here we show that synaptic terminals of fast-spiking interneurons localize to holes in the PNNs in the adult mouse somatosensory cortex. Approximately 95% of holes in the PNNs contain synapses and astrocytic processes expressing Kir4.1, glutamate and GABA transporters. Hence, holes in the PNNs contain tripartite synapses. In the adult mouse brain, PNN degradation causes an expanded astrocytic coverage of the neuronal somata without altering the axon terminals. The loss of PNNs impairs astrocytic transmitter and potassium uptake, resulting in the spillage of glutamate into the extrasynaptic space. Our data show that PNNs and astrocytes cooperate to contain synaptically released signals in physiological conditions. Their combined action is altered in mouse models of Alzheimer's disease and epilepsy where PNNs are disrupted.


Conflict of interest statement

The authors declare no competing interests.

Figures

Fig. 1
Fig. 1. Astrocytic processes express homeostatic proteins in PNN holes in adult mice.
a,b, Confocal micrograph (a) showing PNN (WFA) and astrocytic processes (AldheGFP). White and yellow arrows show astrocytic processes on and within PNN holes, respectively. Side and bottom panels show orthogonal planes and line intensity profiles (b) of WFA and AldheGFP showing astrocytic processes in PNN holes (blue arrows). Black line shows the WFA threshold. c, 3D reconstruction of PNN (WFA) and astrocytic processes (AldheGFP) showing a non-overlapping interdigitating interface on the neuronal surface. Scale bars, 2 µm (left), 1 µm (right). d, Positive Pearson correlation between astrocytic markers (AldheGFP and Kir4.1) that show lack of correlation with PNN (WFA). n = 4 mice per group. e,f, IHC (e) and 3D reconstruction (f) of astrocytic processes (AldheGFP) expressing Kir4.1 in PNN (WFA) holes. Representative holes are encircled. g,h, Proportional occupancy (g), and percentage of PNN holes (h) containing AldheGFP, Kir4.1, both, any astrocytic marker and empty. n = 40 PNNs/4 mice per group. i,j, Confocal micrograph (i) and 3D reconstruction (j) of astrocytic processes (AldheGFP) expressing GLT1 in PNN (WFA) holes. Representative holes are encircled. k,l, Proportional occupancy (k) and percentage of PNN holes (l) containing AldheGFP, GLT1, both, occupied by any astrocytic marker and empty. n = 40 PNNs/4 mice per group. m,n, IHC (m) and 3D reconstruction (n) of astrocytic processes (AldheGFP) expressing GAT1 in PNN (WFA) holes. Representative holes are encircled. o,p, Proportional occupancy (o) and percentage of PNN holes (p) containing astrocytic processes expressing AldheGFP, GAT1, both, any astrocytic marker and empty. n = 40 PNNs/4 mice per group. q,r, IHC (q) and 3D reconstructions (r) of astrocytic processes (AldheGFP) expressing GAT3 in PNN (WFA) holes. Representative holes are encircled. s,t, Proportional occupancy (s) and percentage of PNN holes (t) containing astrocytic processes (AldheGFP), GAT3, both, any astrocytic marker and empty. n = 40 PNNs/4 mice per group. Bar data show mean ± s.d. Dots represent data points. ****P < 0.0001; ***P < 0.001, **P < 0.01, *P < 0.05, NS, not significant (P > 0.05). One-way analysis of variance (ANOVA) and Tukey’s post hoc test (d,h,l,p,t). Scale bars, 2 µm (a,e,i,m,q) and 1 µm (c,f,j,n,r). Both male and female mice were used. Flu., fluorescence. a.u., arbitrary unit. Source data
Fig. 2
Fig. 2. Cortical PNN holes contain synapses and astrocytic processes that express neurotransmitter transporters in adult mice.
a,b, IHC (a) and 3D reconstruction (b) of astrocytic processes (AldheGFP) and excitatory presynaptic terminals (vGlut1). Representative holes containing both are encircled. c,d, Proportional occupancy (c), and percentage of PNN holes (d) containing astrocytic processes (AldheGFP), excitatory synapses (vGlut1), both and none. n = 40 PNNs/4 mice per group. e,f, IHC (e) and 3D reconstruction (f) of astrocytic processes (AldheGFP) and inhibitory presynaptic terminals (vGAT) in PNN holes. Representative holes containing both are encircled. g,h, Proportional occupancy (g) and percentage of PNN holes (h) containing astrocytic processes (AldheGFP), inhibitory synapses (vGAT), both and none. n = 40 PNNs/4 mice per group. i,j, IHC (i) and 3D reconstruction (j) of astrocytic processes (AldheGFP) expressing glutamate transporter (GLT1), excitatory presynaptic terminals (vGlut1), both and none in PNN holes. Representative holes containing all are encircled. k,l, Proportional occupancy (k), and percentage of PNN holes (l) containing astrocytic processes (AldheGFP), glutamate transporters (GLT1), excitatory synapses (vGlut1) and various combinations in PNN holes. n = 40 PNNs/4 mice per group. m,n, IHC (m), and 3D reconstruction (n) of PNN (WFA) holes containing astrocytic processes (AldheGFP) expressing GABA transporter (GAT3), and inhibitory synapses (vGAT). Representative holes containing all are encircled. o,p, Proportional occupancy (o), and percentage of PNN holes (p) containing astrocytic processes (AldheGFP) expressing GABA transporter (GAT3), inhibitory synapses (vGAT), and various combinations. n = 40 PNNs/4 mice per group. q,r, IHC (q), and 3D reconstruction (r) of PNN (WFA) holes containing inhibitory (vGAT) and excitatory (vGlut1) synapses and astrocytic processes (AldheGFP). Representative PNN holes containing vGlut1 and vGAT are encircled. s,t, Proportional occupancy (s) and percentage of PNN holes (t) containing astrocytic processes (AldheGFP), inhibitory (vGAT) and excitatory (vGlut1) synapses in various combinations. n = 40 PNNs/4 mice per group. Bar data represent mean ± s.d. ****P < 0.0001; ***P < 0.001, **P < 0.01, *P < 0.05. One-way ANOVA, Tukey’s post hoc test (d,h,l,p,t). Scale bars, 2 µm (a,e,i,m,q) and 1 µm (b,f,j,n,r). Both male and female mice were used. Source data
Fig. 3
Fig. 3. Developmental PNN maturation restricts astrocytic coverage and tripartite synapses.
a, Developmental timeline in mouse brain. b, IHC of cortical PNN (WFA) and astrocytes (AldheGFP) on postnatal days 10, 20 and 28 showing concurrent PNN and astrocyte maturation. Scale bars, 2 µm. c, IHC of cortical PNN (WFA), astrocytic processes (AldheGFP) and synapses (vGlut1) in P10 mice. Scale bars, 5 µm (top) and 2 µm (bottom). d, Line intensity profile of PNN (line in c) showing vGlut1 and AldheGFP peaks in PNN holes (arrows). Black line represents WFA threshold. e,f, IHC and binary (bottom) images showing cortical neurons (e) and PV neurons (f) with or without PNN (WFA) and their astrocytic coverage (AldheGFP). White and red arrows in f point to PNN-expressing and non-expressing PV neurons, respectively. Scale bars, 5 µm. g, Lower astrocytic (AldheGFP) coverage in cortical NeuN+PNN+ neurons (n = 23 cells/3 mice) than NeuN+PNN neurons (n = 27 cells/5 mice). **P = 0.0038. h, Lower astrocytic (AldheGFP) coverage of cortical PV+PNN+ neurons (n = 20 cells/4 mice) than PV+PNN neurons (n = 34 cells/7 mice). ***P = 0.0006. i,j, Generation of Acan-knockout (KO; Acanfl/flNes-cre+) mice (i) and validation of PNN knockout by IHC of PNN (WFA) and PV (j). Scale bars, 100 µm. Illustration in i created using BioRender. k, IHC (top) and binary (bottom) images of astrocytic coverage with S100B, GLT1 and GFAP on cortical PV neurons in control and Acan-knockout mice. Scale bars, 2 µm. l, Higher total astrocytic area in Acan-knockout mice with astrocytic markers S100B (***P = 0.0003), GLT1 (**P = 0.0097), GFAP (**P = 0.0013) and combined (S100B + GLT1 + GFAP) (***P = 0.0002) (n = 11 mice (control), 7 mice (KO)). m, Higher pericellular astrocytic coverage of PV neurons in Acan-knockout mice with astrocytic markers S100B (**P = 0.0029), GLT1 (*P = 0.039, n = 10 m (control), 7 m (KO); GFAP (***P = 0.0007) and combined (S100B + GLT1 + GFAP) of all (**P = 0.0082) (n = 11 mice (control), 7 mice (KO)) in S100B, GFAP and combined groups. n, IHC of cortical PV neuron, glutamatergic synapses (vGlut1) and astrocytes (S100B) in Acan-knockout mice. Scale bars, 2 µm. o, Binary images showing total pericellular synaptic puncta (vGlut1) and puncta with astrocytic processes (vGlut1 + S100B) in control and Acan-knockout mice. p, Higher total vGlut1 puncta in Acan-knockout cortex (*P = 0.0207). n = 6 mice (control), 8 mice (KO). q, Altered pericellular vGlut1 puncta (*P = 0.0497) and puncta with S100B processes (vGlut1 + S100B) (***P = 0.0008) on PV neurons in Acan-knockout mice (n = 6 mice (control), 8 mice (KO). r, 3D reconstruction of PNN (WFA), pericellular astrocytic coverage (S100B) and excitatory synapses (vGlut1) in control and Acan-knockout cortex. Scale bars, 2 µm. Bar data represent mean ± s.d. Dots represent data points. Unpaired two-tailed t-test (g,h,l,m,p,q). We used adult male and female mice, unless age is specified, as in bd. Source data
Fig. 4
Fig. 4. PNN disruption increases pericellular astrocytic coverage without altering tripartite synapses in adult mice.
a, Experimental outline. b, IHC showing cortical PNN disruption on ChABC injection. Scale bars, 1 mm top, 100 µm bottom. c, Reduced WFA intensity in ChABC-injected mice cortex (****P < 0.0001, sham versus ChABC), n = 4 mice (sham), 8 mice (ChABC). d, IHC showing disrupted cortical PNN (WFA) on ChABC injection. Scale bars, 5 µm. e, Increased PNN holes on cortical PNN degradation (**P = 0.0019, n = 6 mice per group). f, IHC showing AldheGFP, NeuN and WFA fluorescence in cortex from sham and ChABC-injected mice. Scale bars, 5 µm. g, Unchanged total cortical AldheGFP area on ChABC injection (P = 0.9574, n = 5 mice per group). h, Binary images showing pericellular astrocytic coverage of AldheGFP in cortex. i, Increased pericellular AldheGFP coverage of cortical PNN+ neurons on ChABC injection (*P = 0.0025, n = 7 mice per group), however, remained unaltered in PNN neurons (P = 0.8510, n = 9 mice (control), 8 mice (ChABC). j, 3D reconstruction showing increased astrocytic coverage on PNN digestion. k, IHC (top) and binary puncta (bottom) of vGlut1 synapses in sham and ChABC-injected mice cortex. Scale bars, 5 µm. l, Unaltered vGlut1 puncta in ChABC-injected cortex (P = 0.6357, n = 4 mice (sham), 5 mice (ChABC). m, Binary puncta of pericellular vGlut1 and vGlut1 with astrocyte (+AldheGFP) in PNN+ and PNN cortical neurons in sham and ChABC-treated mice. n, Unaltered pericellular vGlut1 puncta in ChABC-treated mice around PNN+ (P = 0.6546, n = 4 mice (sham), 3 mice (ChABC)) and PNN (P = 0.0930, n = 5 mice (sham), 3 mice (ChABC)) neurons. o, Unaltered pericellular synaptic puncta with astrocytic contact (vGlut1 + AldheGFP) in ChABC-treated mice around PNN+ (P = 0.6242, n = 4 mice (sham), 3 mice (ChABC)) and PNN (P = 0.4345, n = 5 mice (sham), 3 mice (ChABC)) neurons. p, IHC (top) and binary puncta (bottom) of vGAT fluorescence in sham and ChABC-injected mice cortex. Scale bars, 5 µm. q, Unaltered vGAT puncta in ChABC-injected mice (P = 0.7763, n = 5 mice (sham), 7 mice (ChABC)_. r, Binary puncta of pericellular vGAT and vGAT with astrocyte (+AldheGFP) around PNN+ and PNN cortical neurons in sham and ChABC-treated mice. s, Unaltered pericellular vGAT puncta in ChABC-treated mice around PNN+ (P = 0.7378) and PNN neurons (P = 0.6734). n = 5 mice (sham), 6 mice (ChABC)) in both. t, Unaltered pericellular synaptic puncta with astrocytic contact (vGAT+ + AldheGFP+) in ChABC-treated mice around PNN+ (P = 0.9640) and PNN (P = 0.1464) neurons. n = 5 mice (sham), 6 mice (ChABC) in both. u, AAV9-mediated Acan KO and IHC confirmation of PNN deletion on PV neurons (arrows). Scale bars, 20 µm. v, IHC (left) and binary (right) images showing astrocytic coverage (S100B, Kir4.1, GLT1) of PV+PNN+ and PV+PNN neurons in SynCreGFP-injected Acanfl/fl mice. w, Increased pericellular coverage of astrocytic markers S100B (*P = 0.0442, n = 17 cells/3 mice (PNN+), 22 cells/3 mice (PNN), Kir4.1 (**P = 0.0047, n = 23 cells/3 mice (PNN+), 17 cells/3 mice (PNN) and GLT1 (**P = 0.0021, n = 20 cells/3 mice (PNN+), 26 cells/3 mice (PNN), on PV neurons with PNN knockout. x, IHC (left) and binary images of pericellular vGlut1 puncta (middle) and vGlut1 puncta with astrocytic processes (vGlut1 + S100B) (right) in PV+PNN+ and PV+PNN cortical PV neurons. y, Unaltered pericellular vGlut1 puncta (P = 0.6902) and pericellular vGlut1 puncta with astrocytic processes (vGlut1 + S100B) (P = 0.8284) on PV neurons with PNN knockout using AAVSynCreGFP (n = 40 cells/4 mice per group). z, IHC (left) and binary images of pericellular vGAT puncta (middle), and vGlut1 puncta with astrocytic processes (vGAT + S100B) (right) in PV+PNN+ and PV+PNN cortical PV neurons. za, Unaltered pericellular vGAT puncta (P = 0.6400) and pericellular vGAT puncta with astrocytic processes (vGAT + S100B) (P = 0.7599) on PV neurons with PNN knockout using AAVSynCreGFP (n = 40 cells/4 mice per group). Bar represents mean ± s.d. Dots represent data points. One-way ANOVA, Tukey’s post hoc test (c) and unpaired two-tailed t-test (e,g,i,l,n,o,q,s,t,w,y,za). Scale bars, 2 µm (h,j,m,r,v,w,x,z). Both male and female mice were used. Illustrations in a,u created with BioRender. Source data
Fig. 5
Fig. 5. Disrupted PNN and increased astrocytic coverage in Alzheimer’s disease (5xFAD) and epilepsy (TMEV) mice models.
a, IHC showing PNN loss (WFA) and amyloid plaques (Amylo-Glo, AG) in 5xFAD+ mice cortex. Scale bars, 50 µm. b, IHC showing altered abundance and 3D architecture of cortical PNN (WFA) in 12-month-old 5xFAD+ mice. Scale bars, 50 µm, magnified images 10 µm. c,d, Reduced cortical PNN (WFA) intensity (c) (****P < 0.0001) and PNN (WFA) coverage (d) (**P = 0.0039) in 5xFAD+ mice cortex. n = 4 mice per group in c,d. e,f, IHC (e) and binary images (f) of PNN (WFA) and astrocytic markers (S100B and GLT1) showing increased pericellular astrocytic coverage in 5xFAD+ mice cortex. Scale bars, 5 µm. g, Increased pericellular astrocytic coverage by astrocytic markers S100B (**P = 0.0043), GLT1 (**P = 0.0095) and combining both (S100B + GLT1) (*P = 0.0431) in 5xFAD+ mice cortex. n = 4 mice per group. h, Generation in TMEV model of acute seizures in mice. Illustration created using BioRender. i, IHC showing altered abundance and 3D architecture of cortical PNN (WFA) 10 days post-TMEV-induced seizure. Scale bars, 50 µm, magnified images 10 µm. j,k, Reduced cortical PNN (WFA) intensity (j) (***P = 0.0004), and PNN (WFA) coverage (k) (***P = 0.0002) in TMEV model of acute seizure. n = 5 mice per group. l,m, IHC (l), and binary images (m) of cortical PNN (WFA) and astrocytic markers (S100B and GLT1) showing increased pericellular astrocytic coverage in TMEV model of acute seizure. Scale bars, 5 µm. n, Increased pericellular astrocytic coverage by astrocytic markers S100B (****P < 0.0001), GLT1 (*P = 0.0107) and combining both (S100B + GLT1) (***P = 0.0005) in TMEV model of acute seizure. n = 5 mice per group. Bar represents mean ± s.d.; dots represent data points. NS, not significant, P > 0.05; unpaired two-tailed Student’s t-test (c,d,g,j,k,n). We used adult male and female mice. Source data
Fig. 6
Fig. 6. Acute cortical PNN depletion disrupts Glu uptake by astrocytes.
a, IHC of cortical PNN (WFA) and astrocytes (AldheGFP) in L3–4 of SSC showing an average 50-µm diameter territory of individual astrocytes (circles in magnified image) encompasses one or more PNNs. Scale bars, 50 µm. b, Schematics and brightfield image showing current injector (CI) causing synaptic Glu release and subsequent recording of Glu uptake current by astrocytic processes in PNN holes. RE, recording electrode. c,d, Higher threshold stimulation (c) (*P = 0.0177, n = 20 cells/10 mice (control), 8 cells/5 mice (ChABC)) and lower uptake threshold response (d) (**P = 0.0082, n = 22 cells/10 mice (control), 8 cells/5 mice (ChABC)) of cortical astrocytes in ChABC-treated slices. e, Glu uptake current traces from cortical astrocytes in response to increasing stimulation intensity in control and ChABC-treated slices. f,g, Lower peak Glu uptake currents (f), and lower charge transfer (g) in cortical astrocytes in ChABC-treated slices. n = 24 cells/10 mice (control), 16 cells/6 mice (ChABC) in both f and g. ****P < 0.0001, ***P < 0.001, **P < 0.01, *P < 0.05 in f and g. h, Schematics and brightfield image showing Glu puff induced astrocytic Glu uptake current recording in cortical slice. i, Astrocytic Glu uptake currents on puffing 200 µM Glu in control and ChABC-treated cortical slice. jm, Unchanged peak Glu current (P = 0.7071) (j), total charge transfer (P = 0.8837) (k), decay slope (P = 0.8405) (l) and current decay time (P = 0.1649) (m) of astrocytes in ChABC-treated slices. n = 15 cells/8 mice (control), 11cells/5 mice (ChABC) in jm. n, Experimental schematics. o, Two-photon images of PV neuron (PvTdTomato) and pericellular astrocytic processes expressing iGluSnFR (iGluSnFR) in control and ChABC-treated cortical slice. Scale bars, 5 µm. p, iGluSnFR fluorescence traces from astrocytic processes (areas within lines (o)) on synaptic Glu release, before (ACSF) and after (+TBOA + DHK) blocking Glu transport in control and ChABC-treated cortical slices. Gray bar represents net fluorescence change, thereby net astrocytic uptake. q, Reduced net astrocytic Glu uptake in ChABC-treated cortical slices. **P = 0.0044, n = 8 recordings/7 mice (control), 11 recordings/7 mice (ChABC), unpaired two-tailed Student’s t-test (c,d,jm,q) and two-way ANOVA, Tukey’s post hoc test (f,g). Bar data represent mean ± s.d. Dots represent data points. We used adult male and female mice. Illustrations in b,h,n were created using BioRender. Source data
Fig. 7
Fig. 7. Acute cortical PNN digestion disrupts astrocytic K+ uptake.
a, Schematics of synaptically evoked astrocytic K+ uptake current. b,c, Cortical astrocytes show unaltered threshold stimulation (b) (P = 0.3636, n = 8 cells/3 mice (control), 10 cells/5 mice (ChABC) and lower threshold K+ current response (c) (*P = 0.0248, n = 8 cells/3 mice (control), 9 cells/5 mice (ChABC) in ChABC-treated slices. d, K+ uptake current traces from cortical astrocytes in response to a series of increasing stimuli in control and ChABC-treated slices. e,f, Lower peak K+ uptake currents (e) (n = 11 cells/7 mice (control), 15 cells/6 mice (ChABC) and lower charge transfer (f) (n = 11 cells/7 mice (control), 13 cells/6 mice (ChABC)) in cortical astrocytes in ChABC-treated slices. **P < 0.01, *P < 0.05 (e,f). g, IHC of astrocytic proteins Kir4.1, AldheGFP and PNN (WFA) from fixed acute slices after ChABC treatment. Scale bar, 10 µm. hj, IHC area quantification of PNN (WFA) (*P = 0.0123) (h), Kir4.1 (P = 0.8882) (i) and AldheGFP (P = 0.8333) (j) showing PNN disruption without changing astrocytic Kir4.1 expression. n = 4 mice per group. k, Western blot of cortical protein lysates from five control and five ChABC-treated mice brain slices showing Kir4.1 protein expression (∼250 kDa and ~48 kDa) compared to the loading control β-actin (~42 kDa). l,m, Unaltered expression of ∼250 kDa (P = 0.6137) (l) and ∼48 kDa (P = 0.1672) (m) bands of Kir4.1 protein relative to β-actin. n = 5 mice per group in l,m. Unprocessed blots are shown in Supplementary Fig. 3. Unpaired two-tailed Student’s t-test (b,c,hj,l,m) and two-way ANOVA with Tukey’s post hoc test (e,f). Bar data represent mean ± s.d.; dots represent data points. We used adult male and female mice. Source data
Extended Data Fig. 1
Extended Data Fig. 1. PNNs holes contain astrocytic processes in hippocampal CA2 and low-expressing astrocytic homeostatic proteins in PNN holes in cortex.
a, IHC showing hippocampal CA2 PNNs (WFA) and astrocytic processes (AldheGFP, Kir4.1). Scale 5 µm. b Intensity profiles of a line (Fig. a (arrow)), showing fluorescence intensity of PNN and astrocytic markers. Blue arrows point to PNN holes occupied by astrocytic processes expressing Kir4.1. c, Pearson correlation between astrocytic markers AldheGFP and Kir4.1 and negative correlation between PNN marker (WFA) and astrocytic markers Kir4.1 and AldheGFP. N = 5 mice per group. ****P < 0.0001, ns - not significant, P > 0.05. One-way ANOVA with Tukey’s post-hoc test. d, IHC showing aquaporin 4 expression (Aqp4) in astrocytic processes (AldheGFP) in cortical PNN holes (WFA). e, Intensity profiles of the line drawn on PNN (bottom right d) representing PNN holes (blue arrows) occupied with astrocytic processes (AldheGFP) expressing Aqp4. f, IHC showing connexin 43 expression (Cx43) in astrocytic processes (AldheGFP) in cortical PNN holes (WFA). g, Intensity profiles of line drawn on PNN (bottom right f) representing PNN holes (blue arrows) occupied with astrocytic processes (AldheGFP) expressing connexin 43. h, IHC showing connexin 30 expression (Cx30) in astrocytic processes (AldheGFP) in cortical PNN holes (WFA). i, Intensity profiles of line drawn on the PNN (bottom right h) representing PNN holes (blue arrows) occupied with astrocytic processes (AldheGFP) expressing connexin 30. The dotted black line and blue area under it in b, e, g, and i, represent WFA threshold to delineate PNN holes. Scale 5 µm in large images, 2 µm in magnified images in d, f, and h. Source data
Extended Data Fig. 2
Extended Data Fig. 2. PNN holes contain astrocytic processes and vGlut2-expressing thalamocortical synapses.
a, Representative confocal micrographs showing vGlut2-expressing synapses, astrocytic processes (AldheGFP) and inhibitory synapses (vGAT) in cortical PNN holes (WFA). White arrows point to the PNN holes occupied by specific markers. Scale 2 µm. b, Line intensity profiles of various markers generated by drawing a polyline on the PNN (white dotted line drawn in large image in a). The dotted black line represents the WFA threshold. A few represented PNN holes are marked by blue arrows and the area of the holes is marked by gray bars. Line graphs of vGlut2, AldheGFP and vGAT showing a peak within the gray bar area suggest their presence in the PNN holes. Source data
Extended Data Fig. 3
Extended Data Fig. 3. Astrocytic coverage on PNN-expressing CA2 neuron is not different from PNN-lacking CA1 and CA3 neurons.
a, IHC showing NeuN, AldheGFP, and WFA fluorescence in hippocampal CA1, CA2, and CA3 stratum pyramidale. Scale bar 10 µm. b, Bar graph representing the mean total coverage area of AldheGFP and WFA in CA1, CA2, and CA3 areas. Due to PNNs, WFA covered area in CA2 is significantly higher compared to CA1 (****P < 0.0001) and CA3 (****P < 0.0001); however, AldheGFP covered area in CA2 is statistically indifferent from CA1 (P = 0.8154) and CA3 (P = 0.8160). n = 5 mice in CA1, 6 mice in CA2 and CA3 groups. Red and green lines show comparisons between red (WFA) bars and green bars (AldheGFP) respectively. ns – P > 0.05. c, Bar graph showing non-significant total astrocytic area (AldheGFP) normalized to neuronal area (NeuN) in CA1, CA2, and CA3 regions (CA1 vs. CA2 (P = 0.8318), CA1 vs. CA3 (P = 0.3929), CA2 vs. CA3 (P = 0.7253)). n = 5 mice per group. ns – P > 0.05. d, Bar graph showing non-significant total astrocytic area (Kir4.1) normalized to neuronal area (NeuN) in CA1, CA2, and CA3 regions (CA1 vs. CA2 (P = 0.2403), CA1 vs. CA3 (P = 0.9423), CA2 vs. CA3 (P = 0.5301)). n = 5(CA1), and 6 (CA2, CA3) mice, ns – P > 0.05. Bar data represents ± SD; dots represent data points. One-way ANOVA, Tukey’s post-hoc test in b–d. Source data
Extended Data Fig. 4
Extended Data Fig. 4. Inhibitory synapses remain unchanged in Acan KO mice.
a, IHC (left panels) showing PV, vGAT and s100b immunofluorescence in control (Acanfl/fl Nes-cre-) and Acan KO (Acanfl/fl Nes-cre+) mouse cortex. The right panels show total binary puncta of vGAT (top), pericellular vGAT puncta (middle) and pericellular vGAT puncta with astrocytic contacts (bottom) around PV neurons. Scale bar 5 µm. b–d, Bar diagrams showing unaltered (b) total vGAT puncta (P = 0.5155), (c) pericellular density of vGAT puncta (P = 0.8164), and (d) pericellular density of vGAT puncta with astrocytic contacts (P = 0.5220) in acan KO mice with no PNNs. n = 6 mice (control), 8 mice (Acan KO)) in bd, Unpaired two-tailed t-test in bd. Bar data represent mean ± SD; dots represent data points. Source data
Extended Data Fig. 5
Extended Data Fig. 5. Astrocytic processes occupy newly formed PNN holes after ChABC treatment.
a-b, IHC of PNN (WFA) in mouse brain (a) showing ChABC injected (ipsi) and contralateral (contra) hemispheres. Areas in boxes (a) are magnified in (b). Scale bar 500 µm (a), 200 µm (b). c, IHC of cortical PNN (WFA), and astrocytic markers (AldheGFP, Glut1) in sham and ChABC-injected mouse brains. d, Line intensity profiles of cortical PNN from sham and ChABC-injected brain showing high occupancy of PNN perforations with astrocytes (arrows). Dotted line represents WFA threshold. e, Proportional occupancy of cortical PNN holes by astrocytic processes in sham and ChABC-injected brains. f, Percent of total cortical PNN holes in sham and ChABC-injected brains occupied by AldheGFP (****P < 0.0001), Glt1 (****P < 0.0001) and both (****P < 0.0001), any astrocytic marker positive (****P < 0.0001) and any astrocytic marker negative (****P < 0.0001) holes. n = 40 PNNs/5 mice each group. One-way ANOVA, Tukey’s post-hoc test. g, IHC of cortical PNNs (WFA), astrocytes (AldheGFP), and excitatory synapses (vGlut1), in sham and ChABC-injected brains. h, Unaltered total pericellular vGlut1+ synapses (P = 0.2683) and pericellular vGlut1 synapses with astrocytic (vGlut1++AldheGFP+) contacts (P = 0.3675) in cortical PNN holes in the ChABC-injected brains. n = 22PNNs/5 mice (sham), 35PNNs/6 mice (ChABC) per group. i, IHC of cortical PNN (WFA), astrocytes (AldheGFP), and inhibitory synapses (vGAT) from sham and ChABC-injected brains. j, Unaltered total pericellular vGAT synapses (P = 0.3614, n = 40 PNNs/7 mice (sham), 26PNNs/5 mice (ChABC)) and pericellular vGAT synapses with astrocytic contacts (P = 0.2922, n = 22PNNs/7 mice (sham), 35PNNs/5 mice (ChABC)) in cortical PNN holes in the ChABC-injected brains. Scale bar 5 µm in c, g, i. Unpaired two-tailed t-test in h and j. Bar data represent mean ± SD; dots represent data points. Source data
Extended Data Fig. 6
Extended Data Fig. 6. PNN disruption in 5xFAD model of Alzheimer’s disease without altered synaptic contacts.
a, IHC showing cortical PNN (WFA), PV neuron, glutamatergic synapses (vGlut1), and astrocytic processes (Glt1), in control and 12-month old 5xFAD+ mice. b, Unaltered total vGlut1 puncta in 5xFAD+ mice cortex (P = 0.5669, n = 4 mice per group). c, Binary images showing total pericellular vGlut1 synapses, astrocytic coverage (Glt1) around cortical PV neurons in control and 5xFAD+ mice. The rightmost image shows vGlut1 synapses associated with astrocytic Glt1. d, Unaltered total pericellular vGlut1 synapses (P = 0.9376), and pericellular vGlut1 synapses associated with astrocytic Glt1 (P = 0.1537) in 5xFAD+ mice cortex. n = 4 mice per group. e, IHC showing cortical PNN (WFA), PV neuron, GABAergic synapses (vGAT), and astrocytic processes (Glt1), in control and 12-month old 5xFAD+ mice. f, Unaltered total vGAT synapses in 5xFAD+ mice cortex (P = 0.6001, n = 4 mice per group). g, Binary images showing total pericellular vGAT synapses, astrocytic coverage (Glt1) around cortical PV neurons in control and 5xFAD+ mice. Rightmost image shows vGAT synapses associated with astrocytic Glt1. h, Unaltered pericellular total vGAT synapses (P = 0.8158), and pericellular vGAT synapses associated with astrocytic Glt1 (P = 0.0632) in 5xFAD+ cortex. n = 4 mice per group. Unpaired two-tailed t-test in b, d, f, and h. Bar data represent mean ± SD; dots represent data points. Scale bar 5 µm in all. Source data
Extended Data Fig. 7
Extended Data Fig. 7. Biophysical properties of astrocytes remain unchanged on PNN disruption with ChABC.
a, IHC of control and ChABC-treated acute cortical slices fixed and stained after electrophysiological recordings showing astrocytes (AldheGFP) and degraded PNN (WFA). Scale bar 100 µm. b, Membrane voltage traces of astrocytic resting membrane potential from control and ChABC-treated cortical slices. c – e, unchanged (c) resting membrane potential (P = 0.4996, n = 49c/8 m (control), 24c/ 6 m (ChABC)), (d) membrane capacitance (P = 0.3968, n = 46c/17 m (control), 22c/7 m (ChABC)), and (e) input resistance (P = 0.0646, n = 41c/18 m (control), 25c/7 m (ChABC)) of cortical astrocytes in ChABC-treated slices. Unpaired two-tailed student’s t-test in c - e. f – g, Current clamp traces (f) and IV plot (g) showing the current-voltage relationship of astrocytes in control (n = 49c/18 m) and ChABC-treated (n = 28c/9 m) slices. h – i, Representative voltage clamp traces (h), and IV plot (i) showing the current-voltage relationship of astrocytes in control (n = 59c/18 m) and ChABC-treated (n = 38c/8 m) cortical slices. j, Representative voltage clamp traces of synaptically evoked currents in astrocytes in presence of different blockers to isolate astrocytic Glu uptake current. c and m (c/m) represent number of cells and mice respectively. Bar data and error plots g and i represent mean ± SD. ns – not significant. Source data
Extended Data Fig. 8
Extended Data Fig. 8. Unaltered glutamate transporter expression on PNN depletion in acute cortical slices.
a, IHC of control and ChABC-treated acute cortical slices fixed and stained after electrophysiological recordings showing astrocytes (AldheGFP, Glt1) and degraded PNN (WFA). Scale bar 10 µm. bd, Unaltered IHC expression of Glt1 (b) (P = 0.4895), AldheGFP (c) (P = 0.3516), and degradation of PNNs (d) (WFA) (****P < 0.0001) showing PNN disruption without altering astrocytic Glt1 expression. n = 4mice per group. e, Representative Western blot of cortical protein lysates from 5 control and 5 ChABC treated mice cortical slices showing Glt1 protein expression (∼150 kDa and ∼75 kDa) compared to the loading control β actin (∼42 KDa). Unprocessed blots are shown in supplementary material. f-g, Unaltered expression of ∼150 kDa (f) (P = 0.2449) and ∼75 kDa (g) (P = 0.2684) bands of Glt1 protein relative to β actin. n = 5 mice per group. Unpaired two-tailed student t-test in b - g. Bar data represent mean ± SD; dots represent data points. Source data
Extended Data Fig. 9
Extended Data Fig. 9. PNN disruption in-vivo generates seizures in mice.
a, IHC showing PNN (WFA) in coronal brain sections along the rostro-caudal axis from PBS (sham) and ChABC + hyaluronidase (Hyase)-injected mice. Scale bar 500 µm. b, Representative cortical EEG traces showing normal activity in PBS injected mice (upper trace) and electrographic seizure in ChABC + Hyase injected mice (lower trace). c, Seizure score table. d, Pie chart showing seized and non-seized mice after ChABC + Hyase injections. e – f, Bar diagrams showing seizure durations (e) and seizure latency (f) in mice injected with ChABC + Hyase. n = 6 mice per group in both. Bar data shows mean ± SD; dots represent data points. Source data

Update of

References

    1. Watanabe, K. et al. Three-dimensional organization of the perivascular glial limiting membrane and its relationship with the vasculature: a scanning electron microscope study. Okajimas Folia Anat. Jpn.87, 109–121 (2010). - PubMed
    1. Araque, A. et al. Tripartite synapses: glia, the unacknowledged partner. Trends Neurosci.22, 208–215 (1999). - PubMed
    1. Asztely, F., Erdemli, G. & Kullmann, D. M. Extrasynaptic glutamate spillover in the hippocampus: dependence on temperature and the role of active glutamate uptake. Neuron18, 281–293 (1997). - PubMed
    1. Parsons, M. P. & Raymond, L. A. Extrasynaptic NMDA receptor involvement in central nervous system disorders. Neuron82, 279–293 (2014). - PubMed
    1. Chaunsali, L., Tewari, B. P. & Sontheimer, H. Perineuronal net dynamics in the pathophysiology of epilepsy. Epilepsy Curr.21, 273–281 (2021). - PMC - PubMed

LinkOut - more resources