. 2024 Jul;631(8022):891-898.
doi: 10.1038/s41586-024-07662-z. Epub 2024 Jul 17.

Position-dependent function of human sequence-specific transcription factors

Affiliations

Position-dependent function of human sequence-specific transcription factors

Sascha H Duttke et al. Nature. 2024 Jul.

Abstract

Patterns of transcriptional activity are encoded in our genome through regulatory elements such as promoters or enhancers that, paradoxically, contain similar assortments of sequence-specific transcription factor (TF) binding sites1-3. Knowledge of how these sequence motifs encode multiple, often overlapping, gene expression programs is central to understanding gene regulation and how mutations in non-coding DNA manifest in disease4,5. Here, by studying gene regulation from the perspective of individual transcription start sites (TSSs), using natural genetic variation, perturbation of endogenous TF protein levels and massively parallel analysis of natural and synthetic regulatory elements, we show that the effect of TF binding on transcription initiation is position dependent. Analysing TF-binding-site occurrences relative to the TSS, we identified several motifs with highly preferential positioning. We show that these patterns are a combination of a TF's distinct functional profiles-many TFs, including canonical activators such as NRF1, NFY and Sp1, activate or repress transcription initiation depending on their precise position relative to the TSS. As such, TFs and their spacing collectively guide the site and frequency of transcription initiation. More broadly, these findings reveal how similar assortments of TF binding sites can generate distinct gene regulatory outcomes depending on their spatial configuration and how DNA sequence polymorphisms may contribute to transcription variation and disease and underscore a critical role for TSS data in decoding the regulatory information of our genome.


Conflict of interest statement

The authors declare no competing interests.

Figures
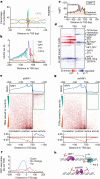
Fig. 1
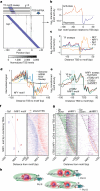
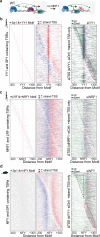
Fig. 1. TF function is position dependent.
a, Nucleotide frequency bias near TSSs of human U2OS cells. b, Many TF binding sites are enriched at specific positions relative to active TSSs genome-wide (TSSs). c, Integrating positional information and nucleotide biases using HOMER2 identifies TF binding site enrichment or depletion relative to the TSS, exemplified by NRF1. Statistical analysis was performed using two-sided Fisher’s exact tests with Benjamini–Hochberg correction. d, Most TF binding sites are enriched in preferred positions. Enrichment or depletion of all 463 known human TF binding sites in the HOMER2 motif database relative to the TSS. A detailed version of this figure is provided in Supplementary Fig. 1. e, NRF1 function is dependent on the location of its binding site relative to the TSS. TSSs are ranked on the basis of their log2-transformed fold change in activity after NRF1 knockdown (from gain to loss of transcription initiation, n = 136,757). TSSs with NRF1 binding sites (heat map, dark red) within their preferred localization pattern (blue graph; top) are repressed, while those with NRF binding sites downstream of the TSS were correlated with activation (or derepression; bottom). Analysis was performed using MEPP (Methods). f, TSSs downregulated after NRF1 knockdown (siNRF1) display TF binding within its preferred upstream region while derepressed TSSs display NRF1 binding downstream, as assessed by anti-NRF1 ChIP–seq. g, NRF1 probably represses upstream TSSs through steric hindrance. Analysis of TSSs (n = 136,344) ranked from gain to loss of transcription initiation activity after overexpression of a transcription activation domain (TAD)-deleted dnNRF1 mutant shows repression when the NRF1 binding site (dark red) is located either upstream or downstream of the TSS, suggesting that TSSs found upstream of NRF1 sites are activated only after removal of the TF from the downstream DNA. h, Model for NRF1 TF function and NRF1-dependent TSS derepression. Source Data
Fig. 2
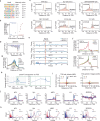
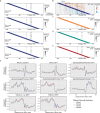
Fig. 2. Natural genetic variation reveals position-dependent function and distinct classes of TFs.
a,b, Natural DNA polymorphisms can have a major impact on gene regulation. Example loci where genetic variants eliminated NF-κB (p65) binding sites in the SPRET mouse strain (versus C57BL/6) and associated with either a reduction in downstream transcription initiation (a) or a derepression of transcription initiation when the mutated binding site was located downstream of the TSSs (b). Transcription initiation was measured in untreated (notx) or KLA-stimulated BMDMs from SPRET and C57BL/6 reference mouse strains (average of n = 2 biological replicates). c, The influence that variants in TF binding sites has on transcription initiation is dependent on their position relative to the TSS. Analysis of the genome-wide significance of the association between mutations in the Sp1 binding site (GC-box) and the change in transcription initiation, calculated for Sp1 sites as a function of their relative distance to the TSS. Positive log[Padj] values indicate that mutations predicted to cause reduced Sp1 binding are more strongly associated with reduced initiation, whereas negative log[Padj] values indicate that the mutated binding sites are more strongly associated with increased initiation (30 bp windows evaluated at 10 bp increments). Statistical analysis was performed using two-sided Mann–Whitney U-tests with Benjamini–Hochberg correction. d, Similar to c, but showing that mutations in the NF-κB (p65) binding sites exhibit stronger positional associations after 1 h of KLA stimulation (dotted versus solid line). e, The functional impact of mutating TF binding sites (TFBSs) generally follows one of three distinct patterns: pure transcriptional activators (PU.1), pure transcriptional repressors (ZEB2) and dual-function TFs (Sp1) that can activate or repress transcription initiation in a position-dependent manner. f, Position-dependent activity was evaluated for mutations impacting 463 known human TF motifs (not all are expressed in BMDMs). A detailed map of this figure is provided in Supplementary Fig. 2. Source Data
Fig. 3
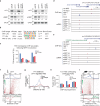
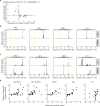
Fig. 3. Capturing the TSSs of thousands of TSR variants confirms the position-dependent function of TFs.
a, Schematic of TSS-MPRA, which accurately captures the TSSs and activity from thousands of plasmid cloned DNA sequences. b, Example of normalized TSS-MPRA transcription initiation data from four inserts designed based on a TSR in EIF2S1 promoter (from −110 bp to +42 bp relative to the primary TSS). Three of the inserts show the impact of placing the NRF1 binding site at different positions relative to the TSS. The in vivo genomic TSS levels, as measured using csRNA-seq analysis in HEK293T cells, is shown at the top. WT, wild type. c, Synthetic TF binding site insertions confirm the position-dependent function of TFs. Summary of TSS-MPRA data for six TF binding sites inserted at three positions relative to the TSS. The impact of inserting the TF binding site was measured as the log ratio of normalized transcript levels versus the wild-type control. n = 13 distinct promoters, enhancers and other TSRs, and each insert was redundantly encoded with 4 different barcode sequences. The box plots show the median (centre line), 25th and 75th percentiles (box limits), and the minimum and maximum values (whiskers) for each position.
Fig. 4
Fig. 4. Spatial interactions between TFs determines TSS position and initiation frequency.
a, Heat map of TSS measurements captured by TSS-MPRA for a 2 bp sweep of Sp1 binding sites (blue) from −100 to +40 across an artificial, motif-depleted promoter. b,c, Position-dependent activity patterns determined using TSS-MPRA TF sweeps resemble each TF’s natural enrichment profile. The average log2-transformed change in initiation activity for all TSSs compared with their mean levels were plotted relative to the Sp1-binding-site (b) or the NFY-, NRF1- or YY1-binding-site (c) distance to each TSS. Average of n = 2 biological replicates. d, Multiple independent experimental approaches show similar spatial–functional profiles for a TF. Natural NFY-binding-site enrichment relative to the active TSS (black), the impact of NFY knockdown (orange), the impact of natural genetic variation in the NFY binding sites (green) and a TSS-MPRA NFY sweep (blue) reveal consistent, position-dependent functional profiles and superhelical preferences for NFY (each profile was minimum/maximum scaled to 1/−1). e, Position-dependent TF activity was altered when NRF1 is swept through the putative TOB2 enhancer (eTOB2) versus the TOB2 enhancer with the endogenous NRF1 binding site mutated (mutNRF1). f, Transcription initiation is affected by the relative spacing between TF binding sites and TSS location. TSRs containing both NRF1 and Sp1 binding sites sorted by the distance between them are shown with csRNA-seq initiation levels on both the positive (red; +) and negative (blue; −) strands. g, Position-dependent TF–TF interactions. TSSs upstream of the NRF1 but downstream of Sp1 (black triangle) are upregulated after NRF1 knockdown while most downregulated TSSs are downstream from NRF1, even if Sp1 is found downstream as well (red circle). Upregulated TSSs are shown in green, and downregulated TSSs are shown in purple. Expression of dnNRF1 generally represses all nearby TSS activity. h, Model of how TF interactions can mediate TSS selection.
Fig. 5
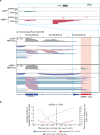
Fig. 5. Position-dependent TF function in human disease.
a, Positional TF binding site enrichment (right) and position-dependent activity of TFs based on the analysis of genetic variants and TSS activity (left) in LCLs across 67 human individuals calculated for 463 human TF motifs (30 bp windows evaluated at 10 bp increments). Statistical analysis was performed using two-sided Mann–Whitney U-tests or Fisher’s exact tests with Benjamini–Hochberg correction. Note that only a subset of TFs with motifs is expressed in LCLs. A detailed map with all TFs annotated is provided in Supplementary Fig. 3. b, Disease-associated variants, identified through GWAS, recapitulate position-dependent TF function. Example of variant rs11122174, for which a C to T mutation disrupts a consensus NRF1 binding site leading to a general increase in upstream TSS activity and decrease in downstream TSS activity. c, Summary of the effect of disease-associated GWAS variants grouped by position relative to the TSSs suggests a role for position-dependent TF function in disease. GWAS variants weakening TF binding sites upstream of TSSs were associated with reduced initiation while those strengthening TF binding sites were associated with increased transcription (txn). Vice versa, weakening TF binding sites increased proximal TSSs, consistent with the reported position-dependent TF blocking function. d, An analysis of 133 human promoters and enhancers using TSS-MPRA showed that the mutation of TF binding sites for ETS1, NFY, NRF1, Sp1 and YY1 within their naturally enriched position is associated with reduced initiation, while mutation of sites in positions at which the TF binding site is naturally depleted were associated with activation (≥20 promoters each). Each point represents an individual TSS. e, Mutation of TF binding sites resulted in changes in TSS selection and alternative 5′ UTRs. The mean shift of all TSS positions between the mutant and control elements is plotted for the mutation of each TF binding site family. Source Data
Extended Data Fig. 1
Extended Data Fig. 1. HOMER2 - A new TF motif and sequence analysis approach that allows controlling for both single-nucleotide positional and fragment-wide sequence biases.
By contrast to most current motif finding methods that normalize across the complete sequence fragment in the analysis, HOMER2 accounts for both fragment-wide and single-nucleotide positional biases of input sequences when it selects background sequences from the genome, such as nucleotide preferences naturally found near TSSs.
Extended Data Fig. 2
Extended Data Fig. 2. TSS-centric analysis reveals a spatial grammar of TFs.
a, De novo motif enrichment analysis of TSRs active in U2OS cells by HOMER2 reveals the TF motifs with the highest enrichment in transcribed regulatory elements. b, Association of TSR-enriched TF binding sites with transcription initiation frequency calculated using MEIRLOP using initiation strength as covariant. c, Examples of TF binding sites with natural preferential positioning in the proximity of human TSSs. Positional enrichment or depletion was calculated using HOMER2, accounting for both positional (i.e. TSS-proximal), and fragment-wide nucleotide content bias. d, Binding sites of the repressor ZBTB7A are depleted near active TSS, especially downstream where the RNA Polymerase II initiation complex is proposed to initially contact the TSR. e, Many TF binding sites including Sp1, NFY, and NRF1, but not all (i.e., CTCF) have preferred 10.5 bp helical positioning relative to active TSS when found between −120 and −40 bp, as shown by Fourier analysis (please see Methods for details). f, Binding sites of cell type-specific activator TFs often show preferential positioning relative to the TSS only in cells that expressed them. TF binding site distribution profiles for HepG2-specific HNF1 and ubiquitous Sp1/GC-box motifs across TSSs identified in K562, U2OS and HepG2 cell lines by csRNA-seq. g, Preferential TF binding site localisation is highly conserved across species and methods. Motif density plot of the NFY binding site relative to TSS identified using csRNA-seq from different human and green monkey (Vero cells) cell lines as well TSS identified using PRO-cap in K562 cells. h, The upstream, rather than the downstream promoter region is more conserved. Aggregate PhyloP scores at single base resolution relative to active TSSs in U2OS cells reveals that upstream regions, especially around −30 bp and −50 bp, relative to the TSS, are preferentially conserved. i, Genomic nucleotide frequency plots relative to TSS containing or lacking a canonical Initiator motif (BBCA + 1BW) at the TSSs. j, Frequency and patterns of position-specific TF binding sites are more eminent relative to TSSs that lack canonical core promoter motifs. Normalized NFY, Sp1, NRF1, YY1 and ZBTB7A motif occurrences are displayed relative to the TSS containing (red) or lacking (blue) a canonical human Initiator motif (BBCABW) at the TSS (grey). k, Helical periodicity of TF binding sites found between −120 to −40 bp relative to the TSS are more prominent in TSS lacking a canonical human Initiator motif (BBCABW). Fourier analysis of TF binding sites NFY, Sp1 NRF1, YY1 and ZBTB7A revealed preferred 10.5 bp helical positioning relative to TSS lacking a human Initiator in position-dependent TF factors.
Extended Data Fig. 3
Extended Data Fig. 3. TF occupancy at differentially positioned binding sites.
a, Quantification of TF knockdown: Western blot 24 h following knockdown of YY1 and NRF1 in replicates using beta-Actin as a control (n = 2, representative experiment shown). For original images please see Supplementary Fig. 4. b, Validation of ChIP-seq data: De novo motif finding of ChIP-seq peaks using HOMER2 identifies the expected motif for each antibody target. FRIP stands for Fraction of Reads In Peaks. c, Overlap between NRF1, YY1, and dnNRF1 binding and TSS reveals enhanced binding of NRF1 to TSSs both up and down regulated by siRNA targeting NRF1 relative to invariant TSS. d,e, Example loci with ChIP and csRNA-seq data. f, Position dependent function of human YY1. Human U2OS TSSs were ranked from gain to loss of transcription initiation activity upon YY1 knockdown and analysed for YY1 motif positional enrichment (dark red). g, TSSs downregulated upon YY1 knockdown have YY1 bound within its preferred region, as assessed by ChIP-seq, while derepressed TSSs have YY1 binding further downstream. h, Overlap between NRF1, YY1, and dnNRF1 binding and TSS reveals enhanced binding of YY1 to TSSs both up and down regulated by siRNA targeting YY1 relative to invariant TSS. i, Position dependent function of mouse NFY. Mouse embryonic fibroblast (MEF) TSSs were ranked from gain to loss of transcription initiation activity upon NFYa knockdown and analysed for NFY motif positional enrichment.
Extended Data Fig. 4
Differential TSS usage can impact gene isoform usage and gene expression. a, Example locus (SDR39U1) where loss of NRF1 by siRNA knockdown led to the induction of several TSSs near to and upstream of a NRF1 binding site motif (top). RNA-seq profiling revealed that cells treated with NRF1 siRNA expressed a novel isoform with unique splice junctions not observed in the control sample (bottom). b, Changes in TSSs levels impact gene expression. Moving average of the number of either upregulated or downregulated TSS overlapping the annotated promoter (within 200 bp) of genes ranked by their change in RNA-seq transcript levels (orange, grey). Also depicted is the average of the total promoter csRNA-seq level change (i.e. integrated across all TSS in the promoter region, blue).
Extended Data Fig. 5
Extended Data Fig. 5. dnNRF and natural genetic variation analysis.
Overexpression of dnNRF1 results in repression of transcription initiation at TSRs in the vicinity of dnNRF1 binding sites. a, Genome browser tracks at an example locus (UTP11) showing the HA-tagged dnNRF1 ChIP-seq read density and normalized csRNA-seq TSS activity levels in eGFP or dnNRF1 expressing U2OS cells. b, TSRs strongly down-regulated by dnNRF1 expression are also bound by dnNRF1, as assessed by ChIP-seq. The average ChIP-seq normalized read density or fraction of TSRs containing the NRF1 binding site from −150 to +50 relative to the TSS are plotted as a function of the log2 ratio of TSS activity between dnNRF1 and GFP expressing U2OS cells as measured by csRNA-seq. c, TSSs downregulated upon overexpression of HA-tagged dominant negative NRF1 (dnNRF1) knockdown have NRF bound within its preferred region upstream of the TSS, as assessed by ChIP-seq. d, Overlap between NRF1, YY1, and dnNRF1 binding and TSS reveals enhanced binding of NRF1/dnNRF1 to TSSs down regulated by dnNRF1 expression relative to invariant TSS. e, Distribution of single nucleotide variants relative to the TSS used in the analysis of mouse (C57Bl/6 and SPRET) bone marrow derived macrophages (BMDMs) comparing different strains and f, human tssQTLs found in LCLs. g, Analysis of the genome-wide significance of the association between mutations in the NFY binding site, or h, NRF1 binding site and the change in transcription initiation in macrophages from each mouse strain, calculated for each TF binding site as a function of their relative distance to the TSS. Positive logP values indicate that mutations predicted to cause reduced TF binding are more strongly associated with reduced initiation, while negative logP values indicate that the mutated TF binding sites are more strongly associated with increased initiation. Distance-dependent profiles were calculated using TF binding sites identified in overlapping windows of 30 bp at 10 bp increments from −150 to +100 bp relative to the TSS. i,j, TF binding sites for TLR4 pathway activated TFs that recruit RNA polymerase II are preferentially positioned relative to TSSs that increase transcription following KLA treatment. Motif distribution profiles relative to TSSs of TSRs that were induced, repressed or did not change upon stimulation of bone marrow derived macrophages with KLA for the binding sites of i, NF-κB (p65) and j, AP1. k, Distribution of the p53 DNA binding site relative to active TSS from U2OS cells.
Extended Data Fig. 6
Extended Data Fig. 6. TSS-MPRA results are highly reproducible.
a, Variation in initiation activity levels among different barcode replicates for the four TSRs displayed in Fig. 3b that shows the impact of differential NRF1 binding site position on TSS activity for a TSR from the EIF2S1 locus (depicted in sense). TSS-MPRA captures the impact of adjusting TF binding site positions on transcription initiation at single-nucleotide resolution. b, Normalized TSS activity profiles on a synthetic DNA insert measuring the impact of adjusting the YY1 binding site position by 2 bp increments, showing waves of increased and reduced transcription initiation and shifting TSS. c, Examples of normalized TSS activity profiles measured by adjusting the position of the NFY binding site every 2 bp, showing the importance of helical positioning for TF potency in recruiting RNAP II.
Extended Data Fig. 7
Extended Data Fig. 7. TSS-MPRA analysis of TF binding site sweeps reveal additional evidence for position-dependent TF function.
a, Summary heat maps of the TSSs and their normalized activity levels captured by TSS-MPRA for a 2 bp incremental sweep of the Sp1 binding site sweep from −100 to +40 across an artificial, TF motif-depleted DNA background with four different barcode sets. The Sp1 binding site position is shown in blue. b, Vertical normalization of the Sp1 binding site sweep TSS-MPRA reports the log2 fold change in TSS activity relative to the average activity of that TSS across all possible Sp1 binding site positions. This normalization highlights TSSs that are activated (red) and repressed (blue) relative to the average level of activity for each binding site position. The Sp1 binding site position is shown in blue. c, Summary heat maps of the TSSs and activity levels captured by TSS-MPRA for a 2 bp sweeps of the YY1 binding site, d, NFY binding site and e, NRF1 binding site, sweep from −100 to +40 across an artificial, TF motif-depleted DNA background. Only BC#1 of 4 is shown. f, Lineplots showing that the position-dependent impact of sweeping TF binding sites in a synthetic sequence is highly reproducible as independently assessed for each of the four barcodes sets. Data reported in the manuscript were obtained by averaging all four barcodes and both biological replicates.
Extended Data Fig. 8
Extended Data Fig. 8. Multiple experimental approaches reveal consistent position-dependent functional profiles that are unique to each TF.
Comparison of patterns from natural preferred TF binding site positional enrichment in the genome relative to active TSSs (black, i.e. Fig. 1d), impact of TF knockdown on transcription of proximate TSSs as a function of distance to the TF binding site (orange, i.e. Fig. 1e, flipped), impact of TF binding site mutations due to natural genetic variation on transcription (pink/yellow, i.e. Figs. 2f, 5a) and a binding site’s ability to impact transcription as captured by TF binding site sweeps with TSS-MPRA (blue, i.e. Fig. 4c) altogether reveal consistent, position-dependent functions and superhelical preferences for a, YY1, b, Sp1, c, NRF1 and d, NFY. Each profile was scaled such that the most extreme value was set to 1/−1. e, Hypothetical model for TF-mediated TSS selection and dispersed initiation. TFs can recruit or block transcription initiation based on their spacing. In most TSRs, this spacing-dependent function of TFs is integrated over several TFs. As TF binding is transient, different sets of TFs can be present at a given moment at homologous TSRs in sister chromosomes or different cells of the same kind or vary at the same TSR over time. f, The transcribed putative TOP2 enhancer region contains an NRF1 binding site. UCSC browser image and HOMER-annotated motifs with the NRF1 binding site mutated in the screen highlighted in red.
Extended Data Fig. 9
Extended Data Fig. 9. Spacing between TFs can coordinately guide transcription initiation. Additional examples of TF-TF interaction.
a, Model for TF-mediated RNA Polymerase II initiation and coordinated TSS selection by activator TFs NRF1 and Sp1 based on their spatial preferences. TSRs containing both b, YY1 and Sp1 binding sites, c, NRF1 and ZBTB7A (LRF) binding sites, and d, NFY and Sp1 binding sites, sorted by the distance between the TF binding sites with csRNA-seq initiation levels shown in forward (red) and reverse (blue) direction. The impact of YY1, NRF1, and NFY siRNA knockdown on activity for + strand TSSs are shown on the right with upregulated TSSs shown in green and downregulated TSSs in purple. TSS patterns and their regulation at YY1 and Sp1 binding sites containing loci reflect the unique preferred initiation profiles associated with the YY1 and Sp1 binding sites (b), while TSS patterns between the ZBTB7A and NRF1 binding sites show little to no interaction (c). d, Analysis of the Sp1 and NFY in mouse fibroblasts suggests conservation of position-dependent collaborative TF function across mammals.
Extended Data Fig. 10
Extended Data Fig. 10. Position-dependent TF function in human health and disease.
a, Disease-associated variant rs11122174, identified through GWAS, is found within an NRF1 binding site and displays position-dependent changes in tssQTL significance relative to nearby TSS. b,c, Massively parallel mutation analysis of human regulatory elements reveals position-dependent TF function. Mutations of preferentially positioned TF binding sites result in loss of transcriptional activity (b), while mutation of TF binding sites in vicinity to TSSs lead to ectopic TSSs (c, derepression), demonstrating the dual, position-dependent function of NFY, Sp1, NRF1, and YY1 in human regulatory elements. Mutation of TSS-proximal TF binding sites was also associated with notable changes in TSS selection and thus alternative 5’UTRs, a hallmark of many diseases. d, Relationship of TF binding site position and impact on TSS selection: Mutation of TF binding sites near TSS or within their naturally enriched positions had the strongest effect on the TSS pattern of regulatory elements while those outside thereof, had less impact.

References

    1. Nguyen, T. A. et al. High-throughput functional comparison of promoter and enhancer activities. Genome Res.26, 1023–1033 (2016). 10.1101/gr.204834.116 - DOI - PMC - PubMed
    1. Tippens, N. D. et al. Transcription imparts architecture, function and logic to enhancer units. Nat. Genet.52, 1067–1075 (2020). 10.1038/s41588-020-0686-2 - DOI - PMC - PubMed
    1. Dao, L. T. M. et al. Genome-wide characterization of mammalian promoters with distal enhancer functions. Nat. Genet.49, 1073–1081 (2017). 10.1038/ng.3884 - DOI - PubMed
    1. Zeitlinger, J. Seven myths of how transcription factors read the cis-regulatory code. Curr. Opin. Syst. Biol.23, 22–31 (2020). 10.1016/j.coisb.2020.08.002 - DOI - PMC - PubMed
    1. Sahu, B. et al. Sequence determinants of human gene regulatory elements. Nat. Genet.54, 283–294 (2022). 10.1038/s41588-021-01009-4 - DOI - PMC - PubMed