. 2024 Aug;632(8024):419-428.
doi: 10.1038/s41586-024-07663-y. Epub 2024 Jul 17.

In vivo single-cell CRISPR uncovers distinct TNF programmes in tumour evolution

Affiliations

In vivo single-cell CRISPR uncovers distinct TNF programmes in tumour evolution

Peter F Renz et al. Nature. 2024 Aug.

Abstract

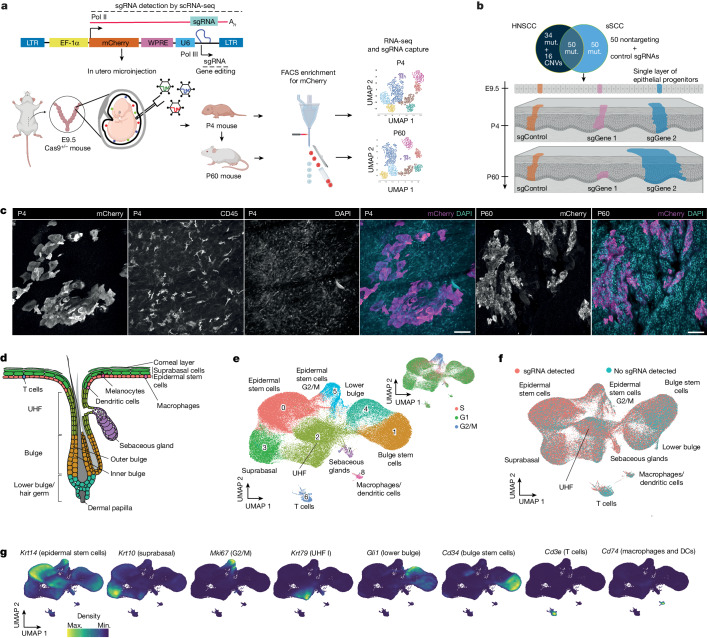
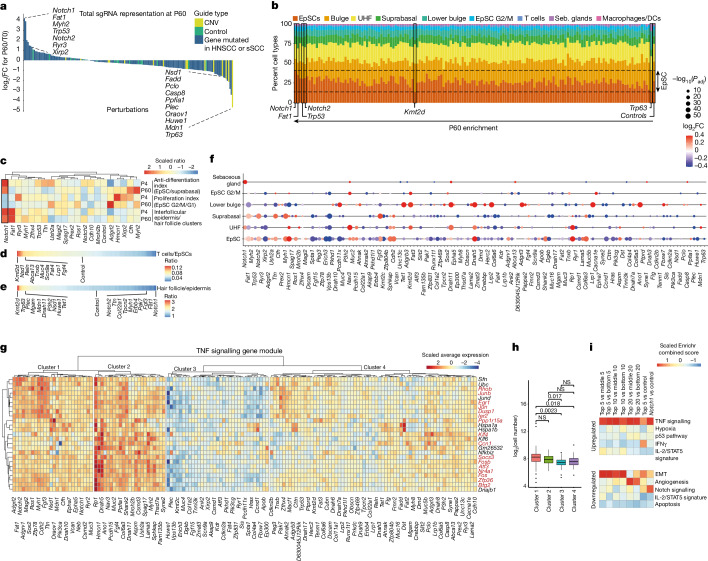
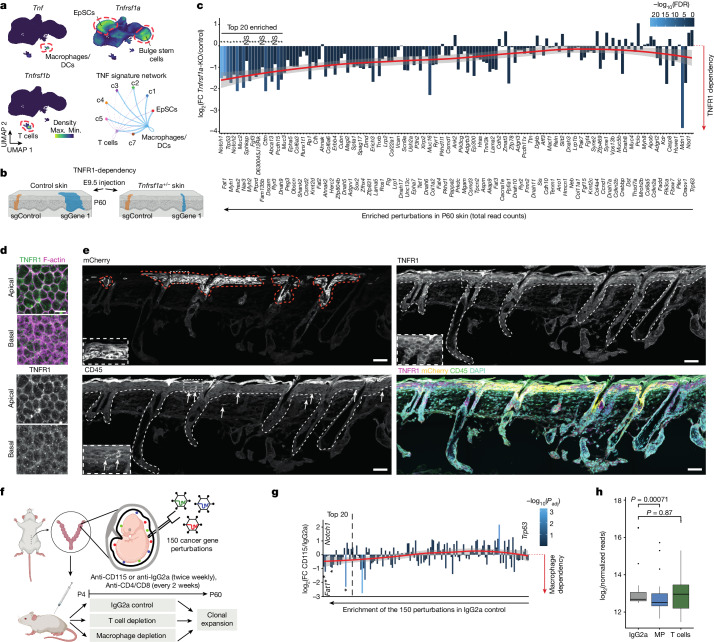
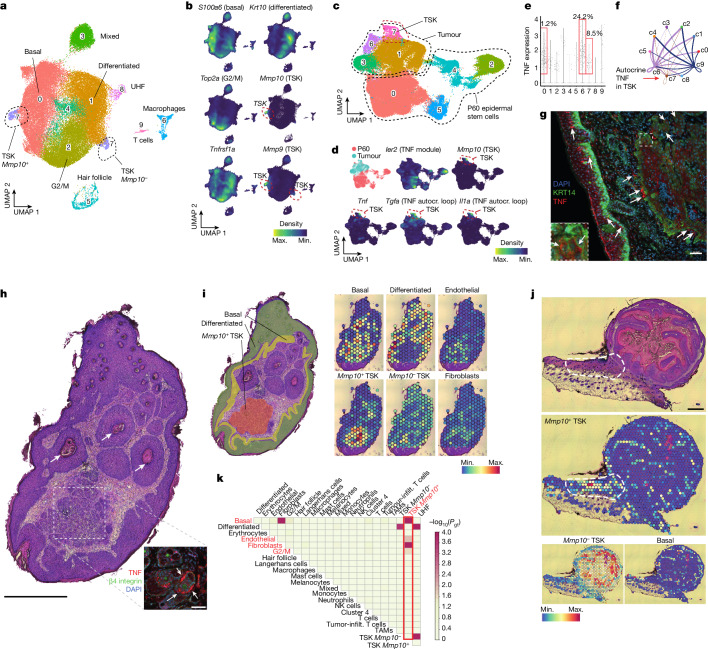
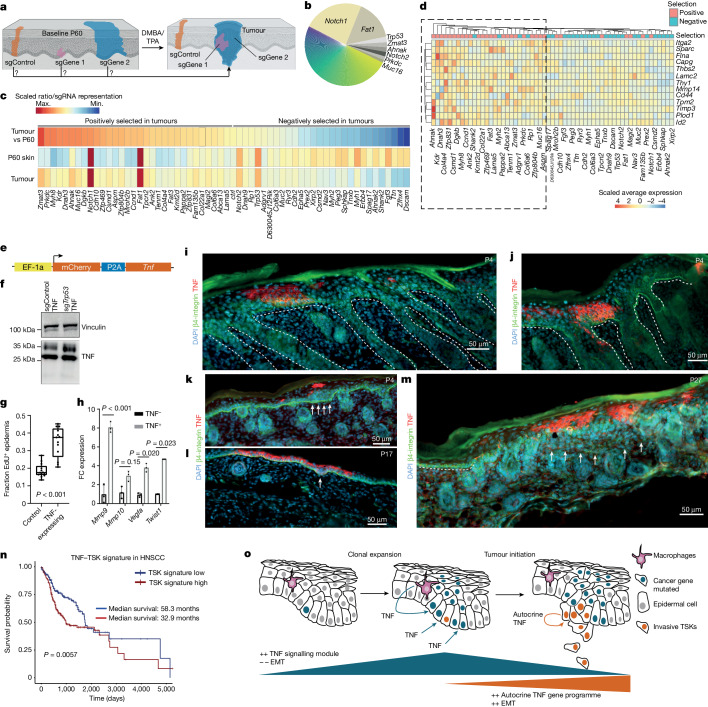
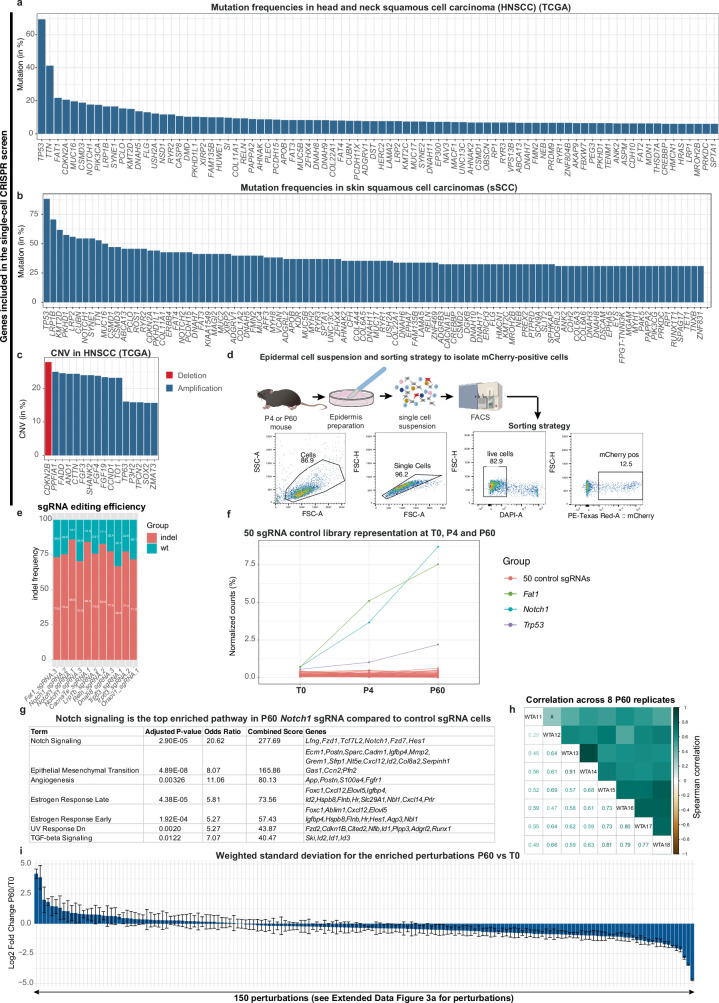
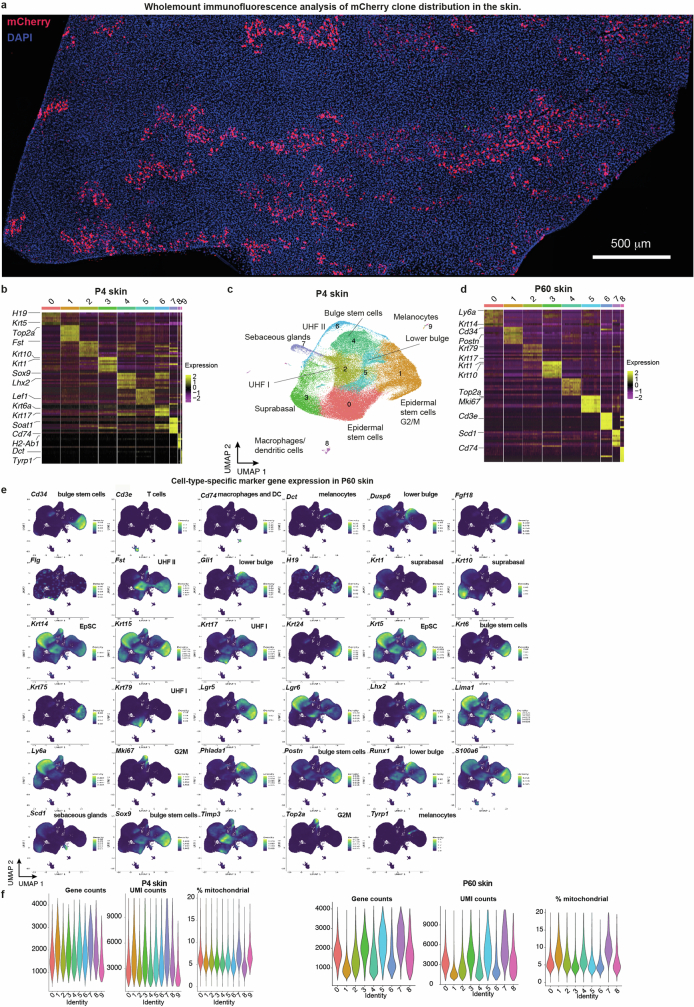
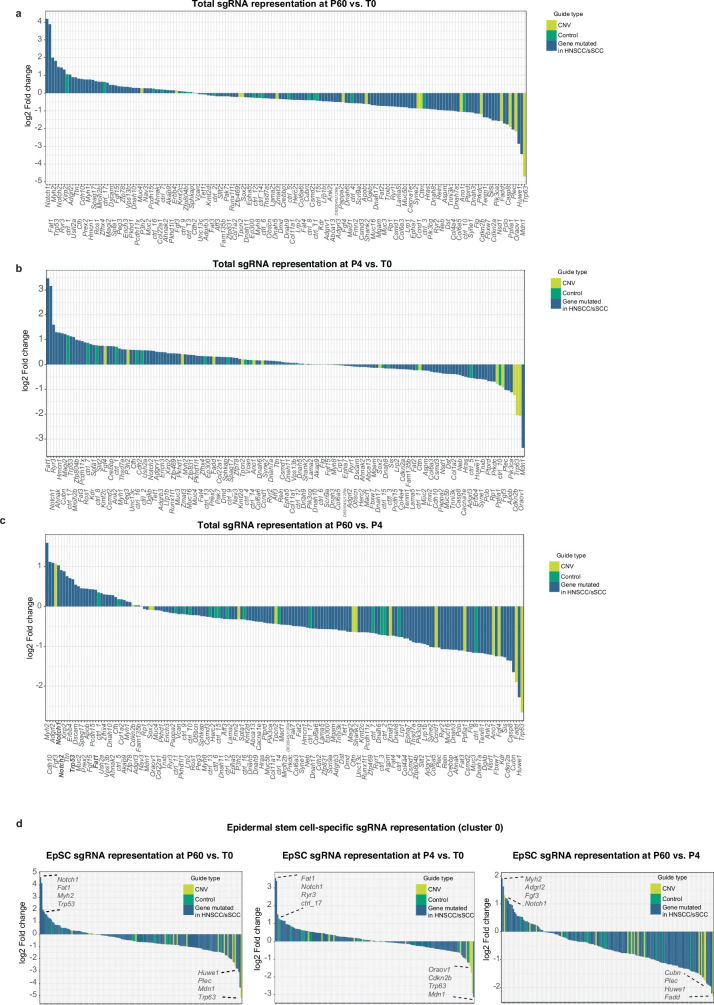
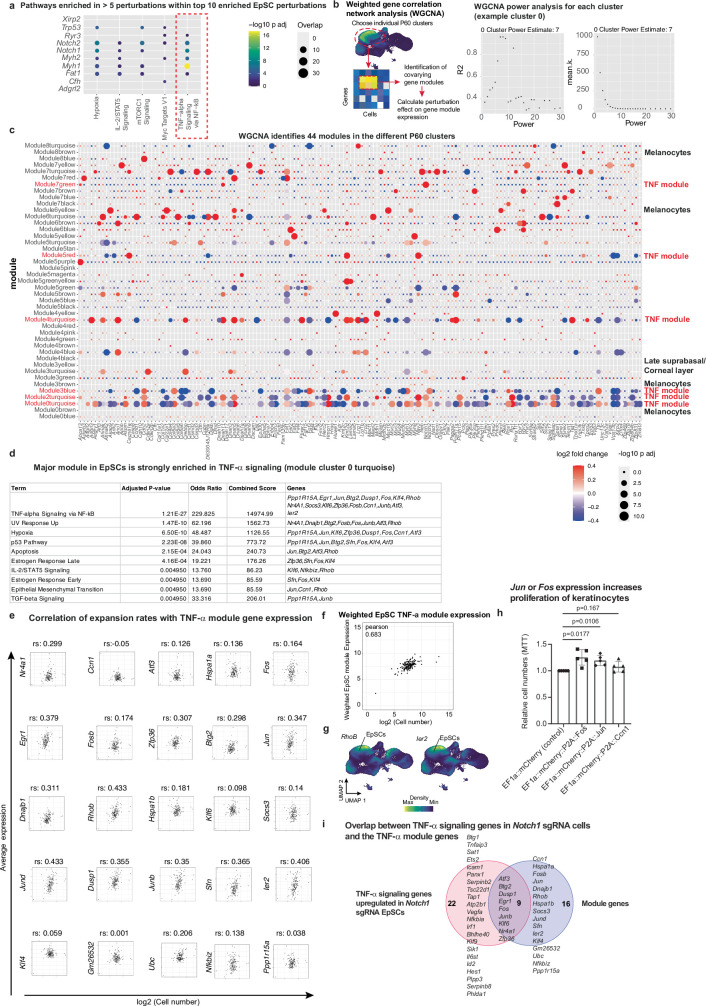
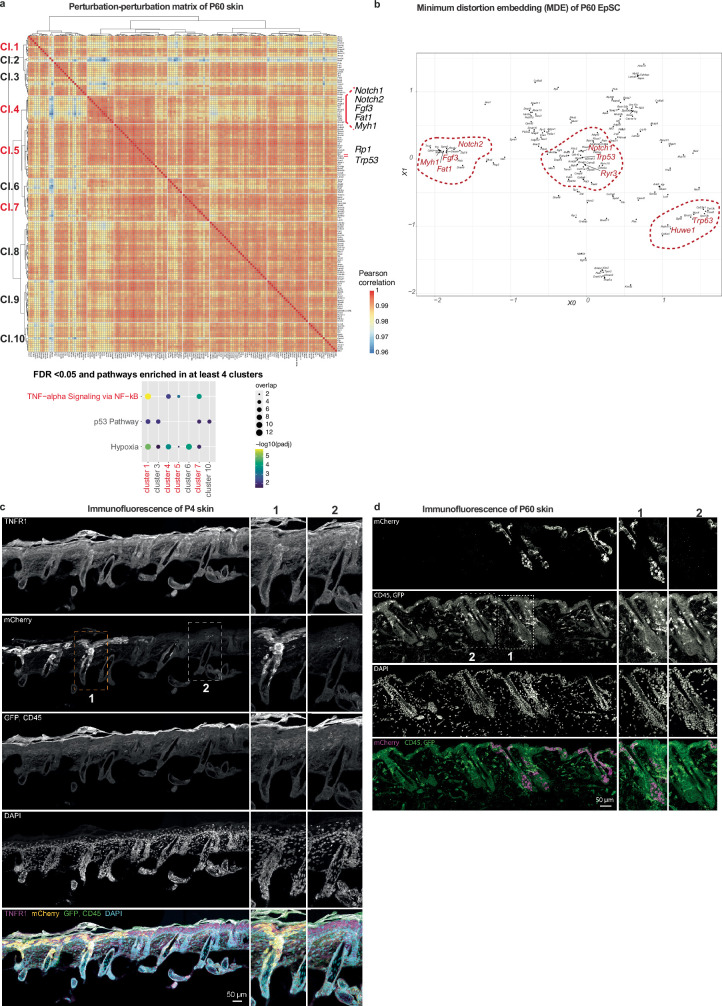
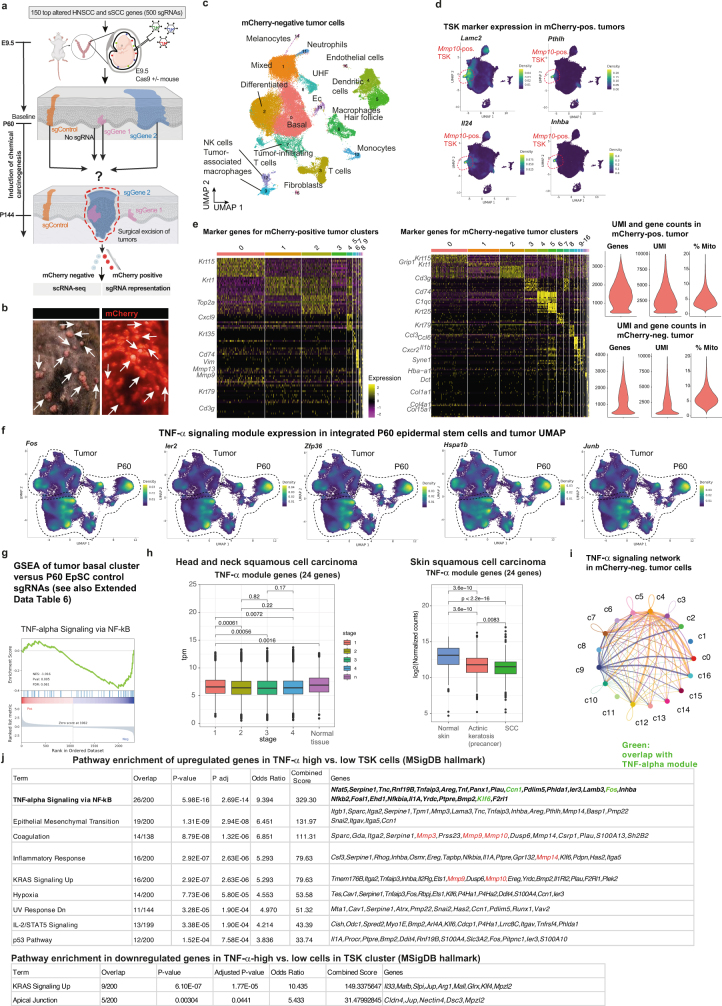
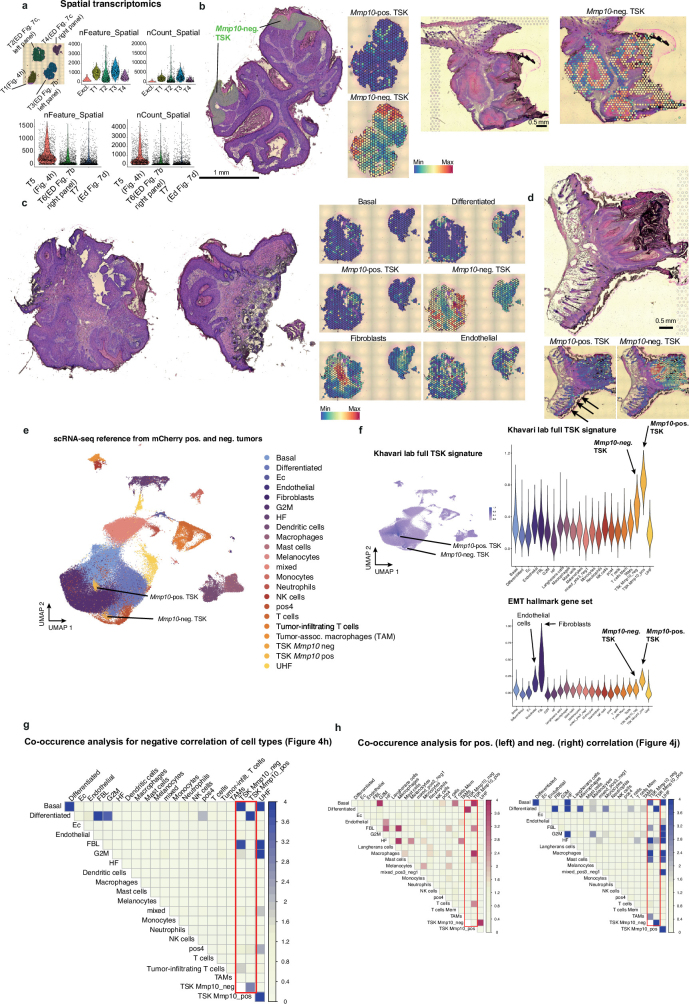
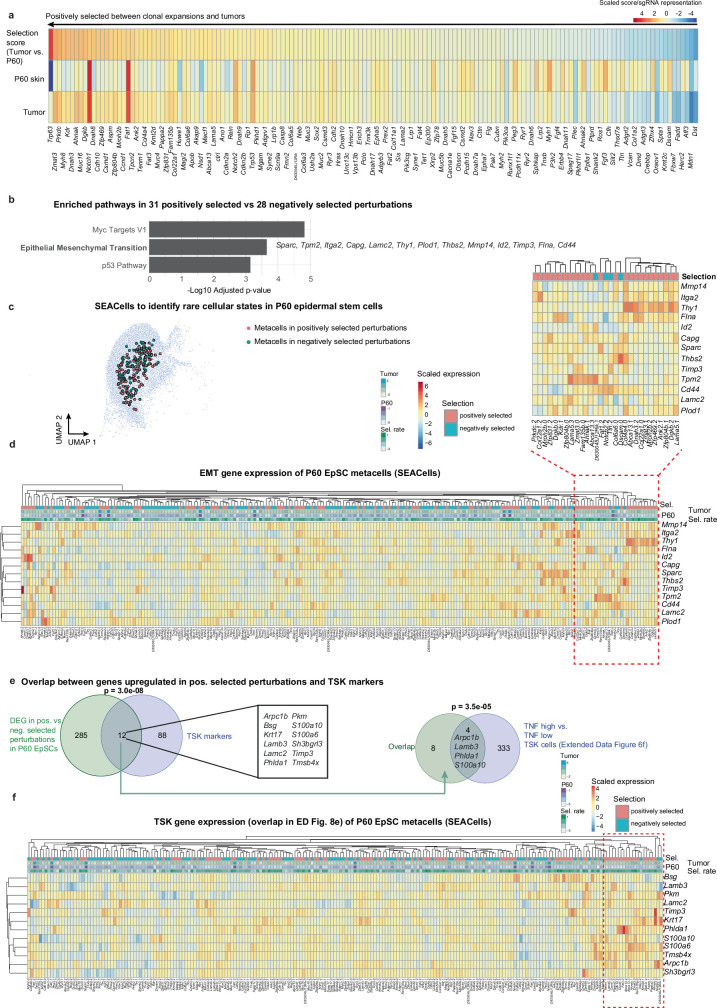
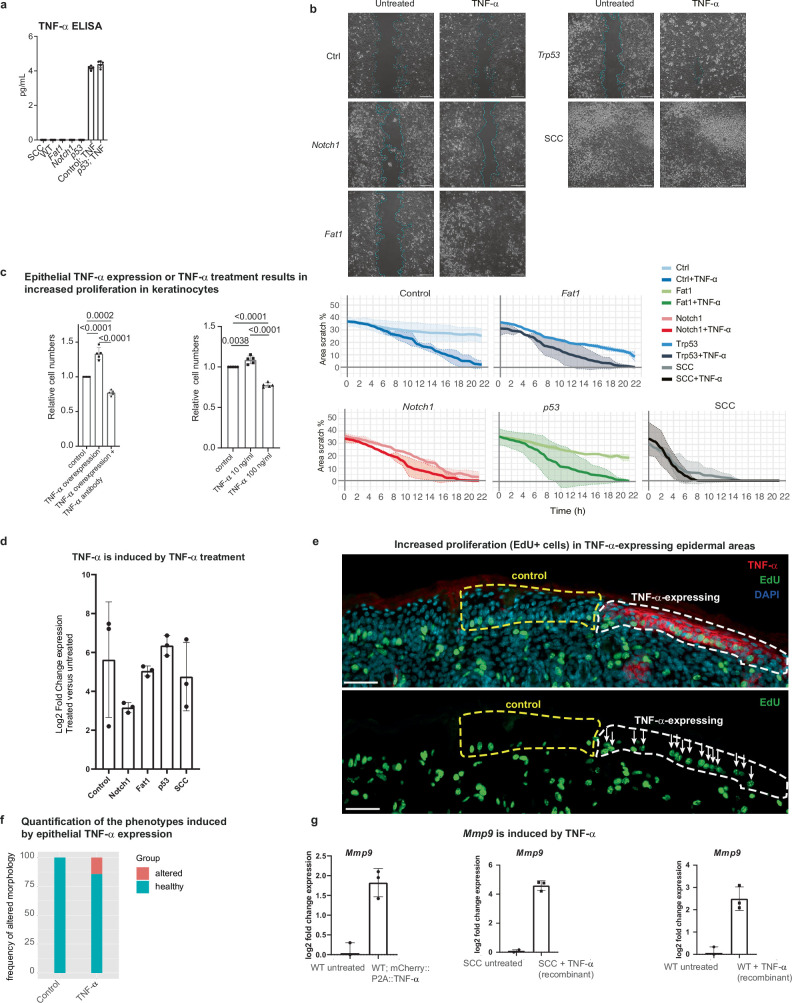
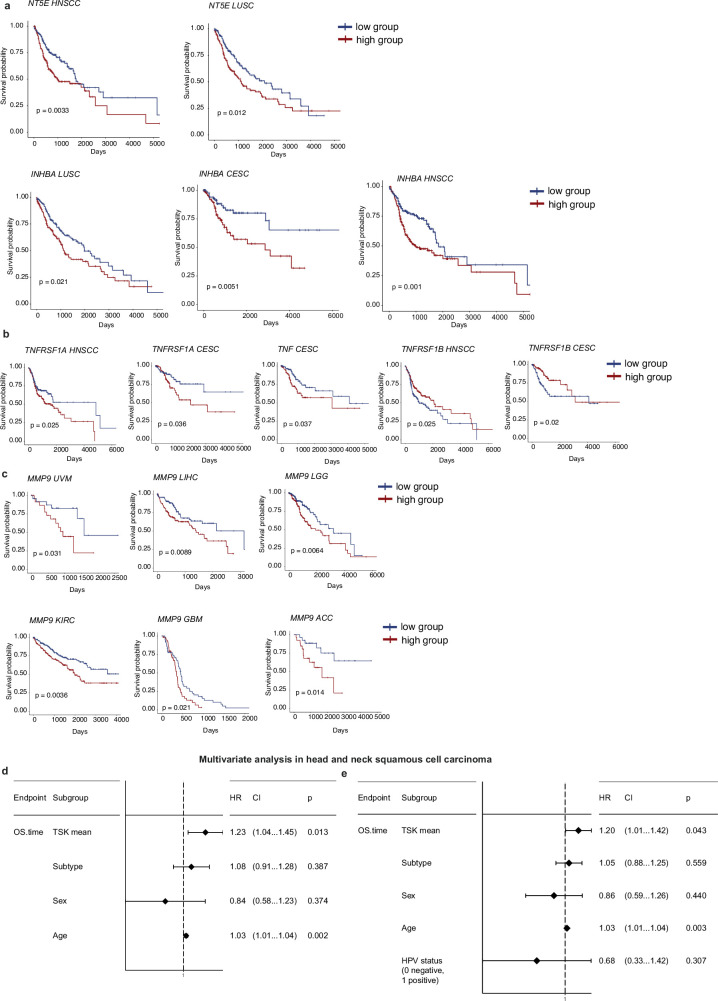
The tumour evolution model posits that malignant transformation is preceded by randomly distributed driver mutations in cancer genes, which cause clonal expansions in phenotypically normal tissues. Although clonal expansions can remodel entire tissues1-3, the mechanisms that result in only a small number of clones transforming into malignant tumours remain unknown. Here we develop an in vivo single-cell CRISPR strategy to systematically investigate tissue-wide clonal dynamics of the 150 most frequently mutated squamous cell carcinoma genes. We couple ultrasound-guided in utero lentiviral microinjections, single-cell RNA sequencing and guide capture to longitudinally monitor clonal expansions and document their underlying gene programmes at single-cell transcriptomic resolution. We uncover a tumour necrosis factor (TNF) signalling module, which is dependent on TNF receptor 1 and involving macrophages, that acts as a generalizable driver of clonal expansions in epithelial tissues. Conversely, during tumorigenesis, the TNF signalling module is downregulated. Instead, we identify a subpopulation of invasive cancer cells that switch to an autocrine TNF gene programme associated with epithelial-mesenchymal transition. Finally, we provide in vivo evidence that the autocrine TNF gene programme is sufficient to mediate invasive properties and show that the TNF signature correlates with shorter overall survival of patients with squamous cell carcinoma. Collectively, our study demonstrates the power of applying in vivo single-cell CRISPR screening to mammalian tissues, unveils distinct TNF programmes in tumour evolution and highlights the importance of understanding the relationship between clonal expansions in epithelia and tumorigenesis.


Conflict of interest statement

The authors declare no competing interests.

Figures

Fig. 1
Fig. 1. In vivo CRISPR screening to monitor clonal expansion in the mouse skin.
a, Schematic of the in vivo CROP-seq strategy to couple pooled CRISPR screening with single-cell transcriptomic readout. LTR, long terminal repeat; U6, U6 RNA polymerase III promoter; UMAP, uniform manifold approximation and projection; WPRE, woodchuck hepatitis virus post-transcriptional regulatory element. b, The sgRNA library targets the 150 most frequently mutated genes (3 sgRNAs per gene and 50 control sgRNAs) in patients with HNSCC or sSCC. sgControl, sgGene1 and sgGene2 refer to non-targeting control sgRNAs or sgRNAs targeting gene 1 and gene 2, respectively. Mut., mutations. c, Whole-mount immunofluorescence staining of mCherry-positive clonal expansions in P4 and P60 mouse skin. Immunofluorescence images provide a planar view across the epidermis. CD45 staining marks haematopoietic cells. Scale bars, 50 μm. d, Schematic representation of the anatomical localization of the different cell populations in the P60 mouse skin. UHF, upper hair follicle. e, UMAP of the 9 cell populations identified by the in vivo single-cell CRISPR strategy for cells in skin from P60 mice (n = 183,084 cells from 10 mice, following filtering and sgRNA annotation). Top right, cell cycle phase superimposed on the UMAP. f, sgRNAs are uniformly detected in all major cell populations. The UMAP shows total mCherry-sorted P60 cells. g, Visualization of cell-type-specific marker gene expression by Nebulosa density plots. DC, dendritic cell (Langerhans cell); max., maximum; min., minimum.
Fig. 2
Fig. 2. Clonal expansion in epithelia converges on TNF signalling.
a, Notch1, Fat1 and Trp53 sgRNAs are the top enriched perturbations in P60 epidermis. Waterfall plot displaying the log2 fold change (FC) in total P60 cell numbers compared to the library T0 representation. Data represent the weighted average of eight P60 replicates from ten mice. b, Cell-type distribution of the 150 P60 skin perturbations, sorted by P60 enrichment. Dashed lines indicate minimum and maximum EpSC percentages. Seb. sebaceous. c, Heat map of the top 20 enriched perturbations in P60 skin, displaying anti-differentiation, proliferation and interfollicular epidermis indices. d,e, Linear heat maps illustrating the cell-type specificity of the perturbations as the ratios of T cells to EpSCs (d) and hair follicle cells/epidermis cells (e). f, Average perturbation effect on the TNF signalling gene module. WGCNA identified a major gene module in six different P60 clusters. Dot plots show the average log2 fold change of module genes. Adjusted P values with Benjamini–Hochberg correction. g, Heat map displaying the average expression of 25 genes in the TNF EpSC module across 150 perturbations. Red text highlights 17 TNF signalling genes (MsigDB Hallmark). h, Clusters 1 and 2, which exhibit increased TNF module expression (g), demonstrate higher expansion rates than cluster 3. P values by Wilcoxon rank-sum test. i, TNF signalling is the top enriched pathway in enriched P60 perturbations. Comparisons of top 5, 10 and 20 versus middle or bottom 5, 10 and 20 gene perturbations by transcriptomic GSEA (Enrichr, MSigDB Hallmark). NS, not significant.
Fig. 3
Fig. 3. Clonal expansion is mediated via TNF signalling.
a, Nebulosa plots showing expression in P60 skin. Bottom right, CellChat ligand–receptor analysis of P60 skin. b, Schematic of the experimental setup to test the role of TNFR1 in clonal expansions. c, Clonal expansion is dependent on TNFR1. The 500 sgRNA library was microinjected into control and Tnfrsf1a-knockout (Tnfrsf1a+/−) E9.5 embryos and sgRNA representation was quantified in P60 mice. Using MAGeCK, perturbations were normalized to the 50 control sgRNAs and TNFR1-dependency was calculated by the ratio of Tnfrsf1a-knockout (KO) and control embryos. The red line is a locally weighted regression curve and the grey area shows the 95% confidence interval. *False discovery rate (FDR) < 0.05. Data represent the average of 8 control (10 mice) and 6 Tnfrsf1a+/− (3 mice) replicates (Methods). d, Whole-mount immunofluorescence across the basal and apical E11.5 epidermis shows cell membrane expression of TNFR1. Scale bar, 10 μm. e, Immunofluorescence of P60 back skin shows mCherry-positive expanded clones and TNFR1 expression in EpSCs alongside CD45-positive immune cells. Scale bars, 50 μm. f, Schematic of the immune-depletion experiment. g, Macrophage depletion reduces clonal expansion of the top enriched cancer gene perturbations. sgRNA representation was assessed at P60, normalized to 50 control sgRNAs and compared to IgG2a control samples using DESeq2. The red line is a locally weighted regression curve. *P < 0.05 within top 20 perturbations. The grey area shows the 95% confidence interval. IgG2a: 14 replicates, 7 mice; CD115: 14 replicates, 7 mice; CD4 and CD8 (CD4/8): 12 replicates, 6 mice. Macrophage and T cell quantification upon depletion is shown in Supplementary Fig. 7c. h, Depletion of macrophages (MP), but not of T cells, reduces clonal expansion of the top 20 enriched cancer gene perturbations. DESeq2 normalized reads of the top 20 enriched perturbations in control (IgG2a)-depleted, macrophage (CD115)-depleted or T cell (CD4/8)-depleted mice. In box plots, the centre line is the median, box edges delineate the first and third quartiles, and whiskers extend to the highest or lowest value no further than 1.5× the inter-quartile range from the box edge. P values by two-sided Wilcoxon rank-sum test.
Fig. 4
Fig. 4. Cancer cells switch to an autocrine TNF gene programme.
a, UMAP representation of single-cell RNA sequencing data from mCherry-positive tumour cells (n = 61,303 cells from 30 tumours, 2 mice). b, Visualization of tumour cell-type-specific marker gene expression by Nebulosa density plots on the mCherry-positive tumour UMAP in a. c, UMAP representation of integrated P60 EpSCs and mCherry-positive tumour clusters 0 and 7 using reciprocal PCA in Seurat. d, Visualization of marker gene expression by Nebulosa density plots on the integrated P60 and tumour UMAP in c. Autocr., autocrine. e, TNF expression and frequency within each cluster of mCherry-positive tumours. Red boxes indicate cells expressing Tnf in the corresponding clusters (>0.5 normalized counts). f, CellChat circle plot showing TNF signalling ligand–receptor interactions across mCherry-positive tumour clusters. g, Immunofluorescence of a squamous cell carcinoma section shows regions with TNF-expressing tumour cells (arrows). KRT14 is used as a basal cell marker. Inset, KRT14-positive TNF-expressing basal tumour cells. Scale bars, 50 μm. h, Haematoxylin and eosin (H&E)-stained section of a tumour used for Visium spatial transcriptomics. Arrows indicate keratin pearls (histological hallmark of SCCs). The outlined region shows the Mmp10-positive TSK cluster. The inset shows an immunofluorescence image of TNF-expressing tumour cells embedded within cells expressing the basal membrane marker β4-integrin. Scale bars: 0.5 mm (main image); 50 μm (inset). i, Right, Visium spatial transcriptomics and spatial maps show tumour cluster localization, deconvoluted from the single-cell reference (Extended Data Fig. 7e,f). Left, spatial distribution of cell types in an H&E-stained tumour section based on the histology and spatial maps. j, H&E-stained sections and spatial maps show Mmp10-positive TSKs at the invasive front (delineated by the white dashed line). Scale bar, 0.5 mm. k, Co-occurrence analysis shows a positive correlation between the localization of Mmp10-positive TSKs, basal tumour cells, endothelia and fibroblasts (marked in red). P(gt) is the probability of the observed co-occurrence being greater than the expected co-occurrence. Infilt., infiltrating; NK cells, natural killer cells; TAM, tumour-associated macrophages.
Fig. 5
Fig. 5. Epithelial TNF induces invasive properties.
a, Schematic representation of the selection rate as a proxy for the predisposition of each perturbation for transformation. b, Pie chart of total sgRNA representation across 168 sequenced tumours. c, Heat map showing selection score between P60 skin and tumours, highlighting positively and negatively selected perturbations. Full list in Extended Data Fig. 8a. d, EMT is induced in positively selected perturbations in the P60 skin, identified through differential gene expression between positively and negatively selected perturbations. e, Schematic of lentiviral vector for microinjection into E9.5 embryos to express TNF in epithelial cells. f, Western blot showing the 26 kDa membrane-bound TNF in keratinocytes transduced with the lentiviral TNF expression construct. P2A, porcine teschovirus-1 2A; sgControl, control sgRNA; sgTrp63, sgRNA targeting Trp63. g, Increased proliferation in TNF-expressing P4 epidermis shown by EdU incorporation 1 h after injection. In box plots, the centre line represents the median, box edges delineate first and third quartiles, and whiskers extend to minimum and maximum values. Twelve independent TNF-expressing and adjacent control areas were quantified (Extended Data Fig. 9e). P value by one-way ANOVA. h, Epithelial TNF expression induces EMT markers. P4 mCherry-positive and mCherry-negative cells were sorted and analysed by reverse transcription–quantitative PCR (RT–qPCR). Data are mean ± s.d. from three technical replicates from two mice. P values by one-sided Welch’s t-test. i,j, Immunofluorescence of P4 back skin sections depicting two different clones of TNF-expressing keratinocytes. Dashed lines indicate basal membrane. km, Immunofluorescence of P4, P17 and P27 epidermal sections reveals regions of epidermal hyperproliferation (k), epithelial invaginations into the ear dermis (l) and breakdown of the basal membrane (m; arrows). n, TSK signature mRNA levels correlate with shorter overall survival in human patients with HNSCC, stratified by upper tertile and bottom tertile TSK signature mRNA expression. P value by standard log-rank test. Multivariate analysis is shown in Extended Data Fig. 10. o, Working model illustrating the distinct TNF programmes in tumour evolution.
Extended Data Fig. 1
Extended Data Fig. 1. Establishing an in vivo single-cell CRISPR screen.
a-b, Perturbations included in the single-cell CRISPR library. Genes were ranked based on their mutation frequency in head and neck squamous cell carcinoma (HNSCC) and skin squamous cell carcinoma patients available from the cBioPortal. c, CNVs included in the single-cell CRISPR library. Genes were ranked by their copy number variation frequency (CNV) in head and neck squamous cell carcinoma (HNSCC). While CDKN2B is deleted in HNSCC, the other 15 CNVs represent amplifications. d, Experimental workflow to prepare single-cell suspensions from back skin followed by fluorescence-assisted cell sorting (FACS) with representative gating strategy. An example preparation with 12.5% mCherry-positive epidermal cells is depicted. Median infection rate at P4, 2.4%. Median infection rate at P60, 16.3%. e, sgRNA editing efficiency represented as the percentage of indel frequency. Cas9-positive keratinocytes were infected with the CROP-seq vector containing single sgRNAs. Indel frequency was measured by the Surveyor nuclease assay and corresponding DNA fragments were quantified using the Bioanalyzer. 11 sgRNAs representing top, middle and bottom enriched guides were assessed. f, Stable propagation of the control library. Non-targeting control sgRNA representation compared to the enriched Notch1, Fat1 and p53 (3 sgRNAs each) across the T0, P4 and P60 time points. The graph displays the percentage of cells containing the sgRNA relative to the total number of cells at each time point. g, Gene set enrichment analysis using Enrichr of P60 Notch1 sgRNA cells compared to control sgRNA cells reveals Notch signaling as the top enriched pathway (combined score), validating the bioinformatics sgRNA identification pipeline. h, P60 sgRNA enrichment and depletion correlate well across the 8 replicates, as shown by the Spearman correlation analysis of the top/bottom 20 perturbations in the P60 skin. WTA11-18 refer to the different replicates and “X” indicates FDR > 0.05. i, The enrichment and depletion patterns and weighted standard deviation of total sgRNAs across the 8 replicates in the mouse P60 skin (related to Fig. 2a). The waterfall plot displays the enrichment and depletion of 150 perturbations at P60, represented as the log2 fold change between total cell numbers at P60 compared to the same ratio in the respective library T0. The standard deviation is calculated as weighted approach, where the weight corresponds to the number of cells in each replicate. The specific perturbation details can be found in Extended Data Fig. 3a.
Extended Data Fig. 2
Extended Data Fig. 2. Marker gene expression in P4 and P60 skin.
a, Whole-mount immunofluorescence staining of mCherry clones in the E16.5 skin, injected with the library of 500 sgRNAs. b, Heatmap displaying the expression profiles of the top marker genes across individual mCherry-positive cells in P4 animals. c, Uniform manifold approximation and projection (UMAP) of the ten major cell populations identified by the in vivo single-cell CRISPR strategy of P4 animals (n = 120,077 cells, from 58 animals, following filtering and sgRNA annotation). UHF, upper hair follicle. d, Heatmap displaying the expression profiles of the top marker genes across individual mCherry-positive cells in P60 animals. e, Visualization of cell-type specific marker gene expressions by Nebulosa density plots, highlighting their specific localization in the P60 UMAP. EpSCs, epidermal stem cells. UHF, upper hair follicle. DC, dendritic cell. f, Characterization of the P4 and P60 single-cell RNA sequencing data sets, displaying gene counts, unique molecular identifier (UMI) counts and % mitochondrial genes as violin plots in each cluster.
Extended Data Fig. 3
Extended Data Fig. 3. Waterfall plots showing enrichment and depletion of the 150 perturbations.
a-c, The waterfall plots display the enrichment and depletion of 150 perturbations at P60 compared to the library T0 (a), P4 compared to the library T0 (b), or P60 compared to P4 (c). Yellow indicates copy number variation genes, green represents control sgRNAs, and blue signifies genes mutated in head and neck (HNSCC) and skin squamous cell carcinoma (sSCC) patients. Data represent the weighted average of seven P4 and eight P60 replicates (7/8 single-cell RNA sequencing runs, 58 P4 animals, 10 P60 animals). d, Epidermal stem cell (EpSC)-specific enrichments. The waterfall plot displays the enrichment and depletion of 150 perturbations, represented as the log2 fold change between EpSC numbers (cluster 0) compared to T0 or P4 representation. Yellow indicates copy number variation genes, green represents control sgRNAs, and blue signifies genes mutated in head and neck (HNSCC) and skin squamous cell carcinoma (sSCC) patients. Data represent the weighted average of seven P4 and eight P60 replicates (7/8 independent single-cell RNA sequencing runs, 58 P4 animals, 10 P60 animals).
Extended Data Fig. 4
Extended Data Fig. 4. WGCNA analysis of the P60 clusters.
a, TNF signaling is the overall most strongly enriched pathway in the top 10 expanded perturbations in P60 epidermal stem cells. Differential gene expression was computed for each of the top 10 enriched perturbations in EpSCs and pathway enrichment was performed for the significantly upregulated genes. The pathway enrichment for upregulated and downregulated genes is shown in Supplementary Table 3. Dot plot shows the pathways that are significantly enriched in at least 5 perturbations. Overlap, total number of genes overlapping with the pathway. b, Left panel, schematic of the weighted gene correlation network analysis (WGCNA) pipeline to identify covarying gene modules in P60 EpSCs. For each cluster’s weighted gene correlation network analysis (WGCNA), a power analysis was performed to find the power for the scale-free topology and then used for all 150 perturbations to unveil gene expression changes that are common to multiple gene perturbations. An example for cluster 0, EpSCs, and its power analysis is displayed. c, Analysis of gene modules in the different cell populations of the P60 skin. The panel depicts 44 gene modules identified within nine distinct cell clusters at P60. Using Weighted Gene Correlation Network Analysis (WGCNA), we explored correlation patterns among genes to identify modules (groups of genes) that co-vary within these clusters. The dot plot visualizes the average log2 fold change for genes within each WGCNA module relative to control sgRNA cells, offering insights into the perturbation effects on different cell types. A notable finding is the identification of a significant TNF gene module, which is consistently present across five different cell clusters in P60 skin, comprising largely the same set of genes. Additionally, the plot highlights modules corresponding to specific cell types, such as melanocytes (characterized by genes like Sox10, Dct, Tyrp1 and Kit) or cells of the stratum corneum within the suprabasal cluster. The color of each dot indicates the log2 fold change, while the size of the dot represents the adjusted p value, calculated using the Benjamini-Hochberg procedure for controlling the false discovery rate. Detailed lists of genes in each module can be found in Supplementary Table 4. The nomenclature for modules follows a module + cluster number in P60 + color format, referencing the specific modules within each cluster. d, The major identified gene module in epidermal stem cells (EpSCs) is strongly enriched in TNF signaling, with 17 out of 25 genes overlapping with the pathway. Gene set enrichment analysis was performed using Enrichr. e, Spearman correlation (rs) of the expression of the 25 epidermal stem cell WGCNA module genes with clonal expansions of the 150 perturbations. P values indicate a two-tailed t-test. f, A linear model predicts clone size with average expression of 25 TNF signaling module genes in EpSCs, explaining a significant proportion of variance (p < 0.001, two-tailed t-test, Methods). g, Nebulosa density plots visualize expression of the two TNF module genes RhoB and Ier2. h, Jun and Fos expression increase proliferation rates in keratinocytes. Keratinocytes were infected with lentiviral constructs expressing a control, Ccn1, Jun or Fos construct. Proliferation was assessed by a MTT assay in 5 independent experiments. Error bars represent standard deviation of the mean. P values indicate a one-sided Welch’s t-test. i, Overlap of TNF signaling genes differentially expressed in P60 Notch1 sgRNA cells compared to the TNF module genes. Besides 9 genes overlapping with the TNF module, an additional 22 genes are differentially expressed in Notch1 sgRNA compared to control sgRNA epidermal stem cells. Pathways, MSigDB Hallmark.
Extended Data Fig. 5
Extended Data Fig. 5. Clustering perturbations to condense expression programs.
a, Clustering of perturbations to condense expression programs and phenotypes in P60 skin. P60 perturbation-perturbation matrix based on gene expression shows clustering of enriched perturbations such as Notch1, Notch2, Fat1 and Myh1. Lower panel shows pathways that are enriched in 4 or more clusters, suggesting that the differentially expressed genes in epidermal stem cells of cluster 1, 4 (including Notch1, Notch2, Fat1 and Myh1 perturbations), 5 and 7 are strongly enriched in TNF signaling. Included in this analysis were differentially expressed genes for each perturbation in the cluster compared to control sgRNA cells (FDR < 0.05) and the pathways enriched (FDR < 0.05) in at least 4 clusters. b, Minimum distortion embedding (MDE) was used for the visualization and dimensionality reduction of the perturbation effect of P60 epidermal stem cells (EpSCs). MDE depicts each perturbation as a dot. Some clusters are highlighted and consist of enriched and depleted perturbations in EpSCs. c-d, Immunofluorescence of mouse P4 and P60 back skin sections exhibit mCherry-positive expanded clones, TNFR1 expression in epidermal stem cells and the presence of CD45-positive immune cells in the epidermis. Insets show higher magnification of select areas. Scale bars, 50 μm.
Extended Data Fig. 6
Extended Data Fig. 6. Single-cell RNA sequencing of mCherry-positive and negative tumors.
a, Schematic outline of the experimental strategy to test the role of clonal expansions in tumor initiation. The high-titer lentiviral library consisting of 500 sgRNAs is introduced into Rosa26-Cas9 +/− E9.5 embryos via ultrasound-guided in utero microinjections. At P60, we induced chemical carcinogenesis by DMBA/TPA for 12 weeks and tumor single-cell suspensions were sorted for mCherry-positive and -negative cells by FACS. Single-cell RNA sequencing was performed on 30 mCherry-positive tumors (from 2 animals), and another 168 tumors (from 14 animals) were collected for sgRNA amplicon sequencing. b, Representative macroscopic image of the mouse back skin after 12 weeks of chemical carcinogenesis by DMBA/TPA treatment show mCherry-positive and mCherry-negative tumors. Left panel, normal light. Right panel, fluorescent light. Arrows indicate individual mCherry-positive tumors. c, UMAP representation of single-cell RNA sequencing data from mCherry-negative tumor cells (n = 79,821 cells, from 30 tumors, 2 animals). d, Visualization of tumor-specific keratinocyte (TSK)-specific marker gene expressions by Nebulosa density plots, highlighting their specific localization in the mCherry-positive tumor UMAP. e, Heatmap displaying the expression profiles of the top marker genes across individual mCherry-positive and negative tumor cells (left two panels). Right panels show the quality control of the tumor single-cell RNA sequencing data sets, displaying gene counts, unique molecular identifier (UMI) counts and % mitochondrial genes as violin plots in both mCherry-positive and mCherry-negative tumor cells. f, TNF signaling module genes are strongly downregulated in tumors. Visualization of select TNF signaling gene expressions by Nebulosa density plots, highlighting their specific localization in the integrated P60 EpSC-tumor UMAP. g, Gene Set Enrichment Analysis (GSEA) comparing tumor cluster 0 cells versus P60 epidermal stem cells reveals enrichment of E2F and G2M-related pathways, with TNF signaling identified as the top downregulated pathway. Right panel, enrichment plot for TNF signaling. h, TNF module gene expression is decreased in human skin and head and neck squamous cell carcinoma patients. The decrease in TNF module gene expression correlates with disease stage in head and neck squamous cell carcinoma patients (also see Supplementary Fig. 8). Box plots indicate the interquartile range with median drawn as line and Tukey-style whiskers. Sample size per stage: stage 1 = 48, stage 2 = 133, stage 3 = 96, stage 4 = 173, normal tissue = 44. P values indicate a two-tailed t-test. i, CellChat circle plot showing ligand-receptor interactions of the TNF signaling pathway across mCherry-negative tumor clusters. j, Gene set enrichment analysis comparing TNF-positive tumor-specific keratinocyte (TSK) versus TNF-negative TSKs (cluster 7, mCherry-positive tumors) uncovers TNF signaling and epithelial-mesenchymal transition (EMT) as top enriched pathways in TNF-expressing TSKs, suggesting an autocrine TNF cascade associated with invasive features in TSKs. Green, only 3 genes overlap with the TNF module, suggesting the presence of a distinct TNF gene program. Red, Mmp genes. Two-tailed Fisher’s exact test was used to examine whether a gene set was significantly enriched.
Extended Data Fig. 7
Extended Data Fig. 7. Spatial transcriptomics of tumors.
a, Characterization of the tumor spatial transcriptomics datasets. Violin plots displaying gene counts (nFeature) and unique molecular identifier (UMI) counts (nCount) of the 7 processed tumor sections. b-d, Hematoxylin and Eosin (H&E) stained images of five additional sections utilized for Visium spatial transcriptomics. A total of seven sections were processed to obtain spatial transcriptomics data. Spatial maps highlight the basal and differentiated tumor areas, as well as Mmp10-positive and negative tumor-specific keratinocytes (TSK), fibroblasts and endothelial cells. While Mmp10-negative TSKs localize to differentiated regions at the surface of the tumor, distant from the invasive front (b, d), Mmp10-positive TSKs reside at the invasive front of the tumor (d, arrows). e, UMAP of the single-cell reference employed for the cell-type deconvolution of the Visium spots (see Methods section). Obtained by merging the scRNAseq datasets of mCherry-positive and mCherry-negative tumors (datasets from Fig. 4c,d). Ec, erythrocytes. HF, hair follicle. Pos4, cluster 4 in mCherry-positive UMAP. UHF, upper hair follicle. f, Mmp10-positive TSKs more closely resemble the human TSKs identified by the Khavari lab and show higher EMT hallmark gene set expression than Mmp10-negative TSKs. The score results for the TSK signature were obtained using Seurat’s AddModuleScore function for the human TSK signature genes (extended marker list). EMT score results were obtained using the hallmark gene set (Molecular Signature Database). g, Co-occurrence analysis demonstrating negative correlations between different cell types within the tumor in Fig. 4h. The probability (P(lt)) indicates the likelihood of the observed co-occurrence being less than the expected co-occurrence. Ec, erythrocytes. HF, hair follicle. Pos4, cluster 4 in mCherry-positive UMAP. FBL, fibroblasts. TAM, tumor-associated macrophages. UHF, upper hair follicle. h, Co-occurrence analysis of the tumor in Fig. 4j shows a positive correlation between the localization of Mmp10-positive TSKs, basal tumor cells, macrophages and fibroblasts, in line with Mmp10-positive TSKs residing in a fibrovascular niche. In contrast, Mmp-10-negative TSKs are positively correlated with differentiated tumor cells. P(gt), the probability of the observed co-occurrence to be greater than the expected co-occurrence. The probability (P(lt)) indicates the likelihood of the observed co-occurrence being less than the expected co-occurrence. HF, hair follicle. Ec, erythrocytes. Cluster 4, cluster 4 in mCherry-positive tumor. UHF, upper hair follicle. TAM, tumor-associated macrophages.
Extended Data Fig. 8
Extended Data Fig. 8. SEACells identifies rare cell states with invasive properties.
a, The heatmap shows the selection score for all 150 perturbations between P60 and tumors, revealing both positively and negatively selected perturbations during tumor initiation. Because of the n = 168 tumors, we focused our main analysis on the top 30 perturbations in P60 EpSCs and the top 30 perturbations in tumors to ensure the robustness and high coverage of the selection score, as presented in Fig. 5c. The selection score (sgRNA tumor/sgRNA P60) is compared to the selection score of the median control sgRNA library. P60 total representation of perturbation in P60 skin (dial-out data). Tumor, representation of sgRNA in tumors, calculated as the sum of the percentage in each of the 168 tumors. b, Pathway enrichment of differentially expressed genes between 31 positively selected perturbations and 28 negatively selected perturbations (as shown in Fig. 5c) uncovers significant enrichments in genes associated with epithelial-mesenchymal transition (EMT), Myc targets and the p53 pathway. Two-tailed Fisher’s exact test was used to examine whether a MsigDB Hallmark gene set was significantly enriched. c, Identification of rare cell states in P60 epidermal stem cells by single-cell aggregation of cell states (SEACells). SEACells algorithm was applied to identify metacells in positively and negatively selected perturbations, upper panel. Positively selected and negatively selected metacells are highlighted as red and green large cells. d, Heatmap shows average gene expression of epithelial-mesenchymal transition (EMT) genes that were differentially expressed between positively and negatively selected perturbations metacells (Extended Data Fig. 8b). The number next to the perturbation refers to the metacell number. Dashed box highlights clusters of metacells expressing high levels of EMT genes, in line with a small subpopulation of P60 epidermal stem cells with invasive features. A closeup of the red dashed region is provided in the upper panel. e, Positively selected perturbations also induce 12 TSK markers. The Venn diagram shows the overlap between the genes induced in the 31 positively selected perturbations and the 100 TSK markers. In contrast, the same comparison with the genes induced in negatively selected perturbations only resulted in an overlap of 2 genes (p = 0.46). Right panel, Venn diagram showing the overlap of 12 TSK markers and the genes upregulated in TNF high vs. low TSKs, suggesting that a subset of these TSK markers is also induced by TNF. P values indicate a hypergeometric test. f, Rare cell states induce TSK marker genes even in P60 clonally expanded epidermal stem cells. Heatmap shows scaled average expression of the TSK genes identified as the overlap of genes induced by the positively selected perturbations and the TSK markers (Extended Data Fig. 8e). Metacells were identified by SEACells as outlined in Extended Data Fig. 8c. The number next to the perturbation refers to the metacell number.
Extended Data Fig. 9
Extended Data Fig. 9. TNF induces motility in keratinocytes.
a, TNF secretion in keratinocytes transduced with the TNF expression construct, as demonstrated by an Enzyme-linked Immunosorbent Assay (ELISA) of the cell culture supernatant. WT, wild type. SCC, squamous cell carcinoma cells. Fat1, Notch1 and p53 indicate sgRNA-infected knockout keratinocytes. Error bars indicate standard deviation of the mean from n = 5 independent experiments. b, In vitro scratch-wound assay shows that TNF can induce cellular motility in keratinocytes. Different perturbations in keratinocytes isolated from Rosa26-Cas9 mice (and infected and selected with Notch1, Fat1 and p53 sgRNAs) and squamous cell carcinoma cells (SCC) were treated with recombinant murine TNF and wound closure was tracked over time in 1 h intervals. Scale bar, 200 μm. Data indicate the average ± s.d. of 3 experiments. c, Epithelial TNF expression or TNF treatment result in increased proliferation. Left panel, Methylthiazolyldiphenyl-tetrazolium bromide (MTT) assay in either control, TNF-expressing keratinocytes or TNF-expressing keratinocytes treated with TNF antibodies. Right panel, MTT assay in keratinocytes either mock-treated or treated with ectopic TNF. As previously reported, high TNF concentration (100 ng/ml) leads to cell death. Error bars indicate standard deviation of the mean from n = 5 independent experiments. P values indicate one-sided Welch’s t-test. d, TNF treatment induces epithelial TNF expression. RT-qPCR was performed for treated and untreated keratinocytes and TNF induction was calculated. Error bars represent standard deviation of the mean from n = 3 individual experiments. e, Increased proliferation in the TNF-expressing epidermal areas. Representative section of a TNF-expressing and control skin area (see quantifications in Fig. 5h). EdU incorporation 1 h post-injection in P4 animals. E9.5 embryos were microinjected with the TNF::P2A::mCherry lentivirus. Scale bars, 50 μm. f, Quantification of the TNF expression phenotype was performed using immunofluorescence staining of P4, P17, and P27 epidermal sections obtained from animals injected with a TNF overexpression construct. Infected regions were identified based on TNF staining, while adjacent negative regions served as controls. Quantified as altered were regions that displayed hyperproliferation of epidermal stem cells, epithelial invaginations or breakdown of the basal membrane. N = 42 TNF-positive regions and n = 42 control regions. g, Epithelial TNF expression or recombinant murine TNF treatment induces epithelial Mmp9 mRNA. RT-qPCR for Mmp9 was performed for treated/infected and untreated keratinocytes. The lentiviral construct for TNF expression is displayed in Fig. 5e. Error bars indicate standard deviation of the mean from n = 3 independent experiments.
Extended Data Fig. 10
Extended Data Fig. 10. TSK mRNA levels correlate with overall survival in human SCC patients.
a, TSK gene mRNA levels (INHBA and NT5E) correlate with shorter overall survival in human squamous cell carcinoma patients. LUSC, lung squamous cell carcinoma. HNSCC, head and neck squamous cell carcinoma. CESC, cervical squamous cell carcinoma. All Kaplan-Meier plots show the overall survival, stratified by upper tertile (high) and bottom tertile (low) mRNA expression. P value indicates a standard log-rank test. b, TNF, TNF receptor 1 and 2 mRNA level correlation with overall survival in human squamous cell carcinoma patients. P value indicates a standard log-rank test. c, Mmp9 mRNA levels correlate with shorter overall survival in a total of 6 different cancer types. UVM, Uveal Melanoma. LIHC, Liver hepatocellular carcinoma. LGG, Brain Lower Grade Glioma. KIRC, Kidney renal clear cell carcinoma. GBM, Glioblastoma multiforme. ACC, Adrenocortical carcinoma. P value indicates a standard log-rank test. d, The TSK signature is an independent prognostic factor for overall survival in head and neck squamous cell carcinoma patients. Multivariate analysis in head and neck squamous cell carcinoma with TSK mean expression of 11 genes, sex, age, subtypes (atypical n = 67, classical n = 87, mesenchymal n = 49 and basal n = 75, as described by the Cancer Genome Atlas Network) as covariates. TSK genes: MMP9, MMP10, PTHLH, FEZ1, IL24, KCNMA1, INHBA, MAGEA4, NT5E, LAMC2 and SLITRK6. HR, hazard ratio. CI, confidence interval. P values indicate a Wald test. e, The TSK signature is an independent prognostic factor for overall survival in head and neck squamous cell carcinoma patients. Multivariate analysis in head and neck squamous cell carcinoma with TSK mean expression of 11 genes, sex, age, subtypes (atypical n = 67, classical n = 87, mesenchymal n = 49 and basal n = 75, as described by the Cancer Genome Atlas Network) and HPV status as covariates. TSK genes: MMP9, MMP10, PTHLH, FEZ1, IL24, KCNMA1, INHBA, MAGEA4, NT5E, LAMC2 and SLITRK6. HR, hazard ratio. CI, confidence interval. P values indicate a Wald test.

Similar articles

Cited by

References

    1. Kakiuchi, N. & Ogawa, S. Clonal expansion in non-cancer tissues. Nat. Rev. Cancer21, 239–256 (2021). 10.1038/s41568-021-00335-3 - DOI - PubMed
    1. Yokoyama, A. et al. Age-related remodelling of oesophageal epithelia by mutated cancer drivers. Nature565, 312–317 (2019). 10.1038/s41586-018-0811-x - DOI - PubMed
    1. Martincorena, I. et al. High burden and pervasive positive selection of somatic mutations in normal human skin. Science348, 880–886 (2015). 10.1126/science.aaa6806 - DOI - PMC - PubMed
    1. Colom, B. et al. Mutant clones in normal epithelium outcompete and eliminate emerging tumours. Nature598, 510–514 (2021). 10.1038/s41586-021-03965-7 - DOI - PMC - PubMed
    1. Datlinger, P. et al. Pooled CRISPR screening with single-cell transcriptome readout. Nat. Methods14, 297–301 (2017). 10.1038/nmeth.4177 - DOI - PMC - PubMed

MeSH terms

Substances