. 2024 Aug;632(8023):157-165.
doi: 10.1038/s41586-024-07701-9. Epub 2024 Jul 17.

Inhibition of IL-11 signalling extends mammalian healthspan and lifespan

Affiliations

Inhibition of IL-11 signalling extends mammalian healthspan and lifespan

Anissa A Widjaja et al. Nature. 2024 Aug.

Abstract

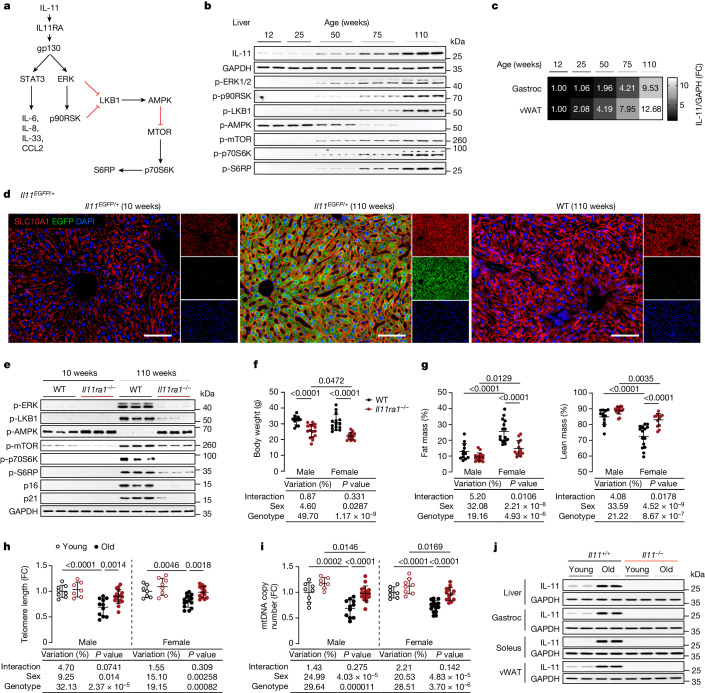
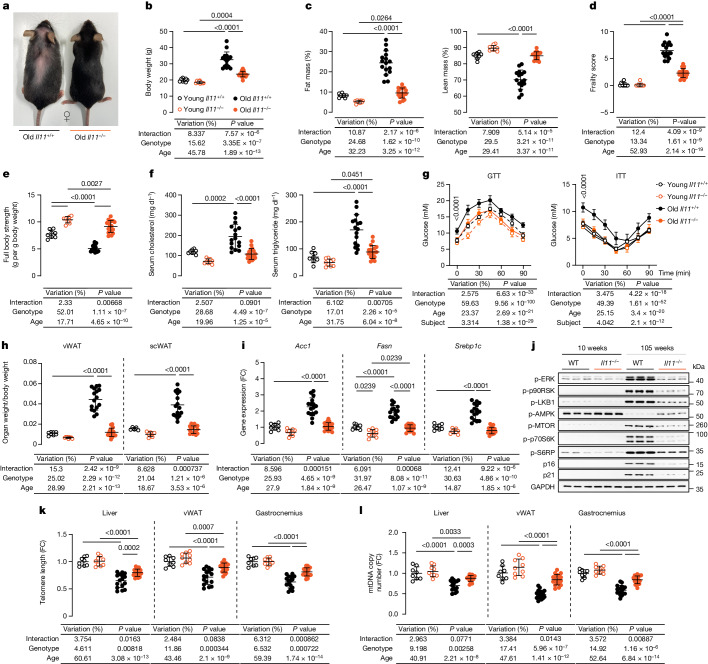
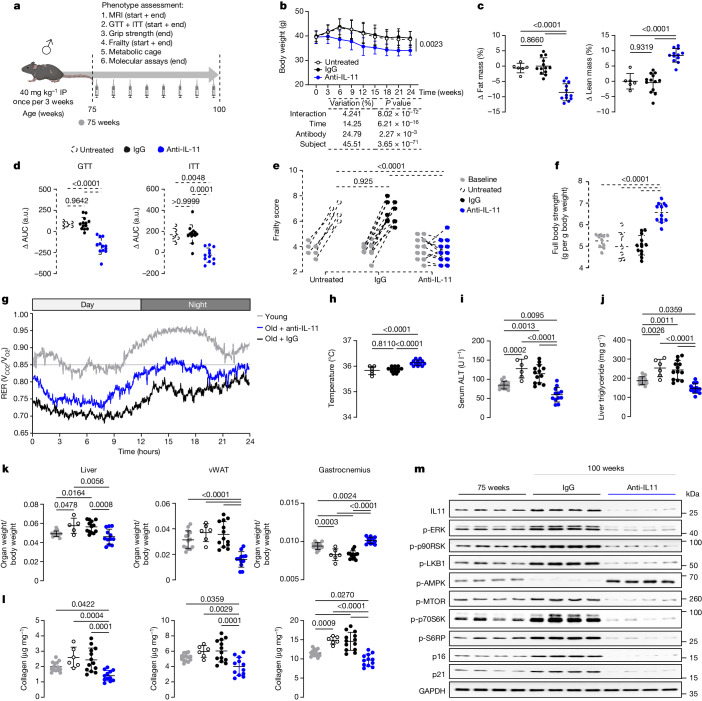
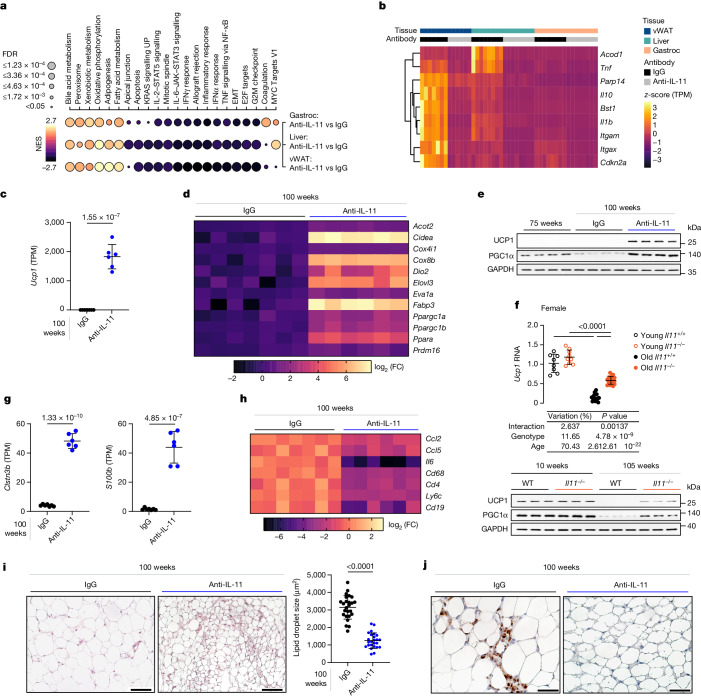
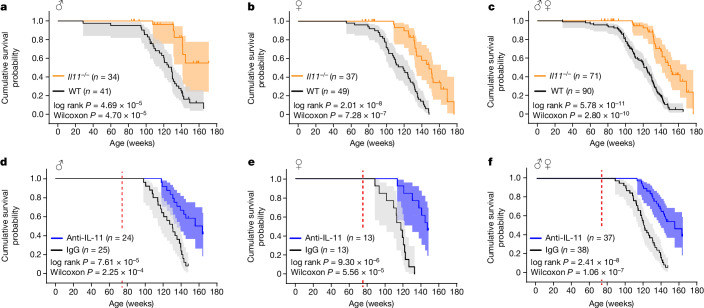
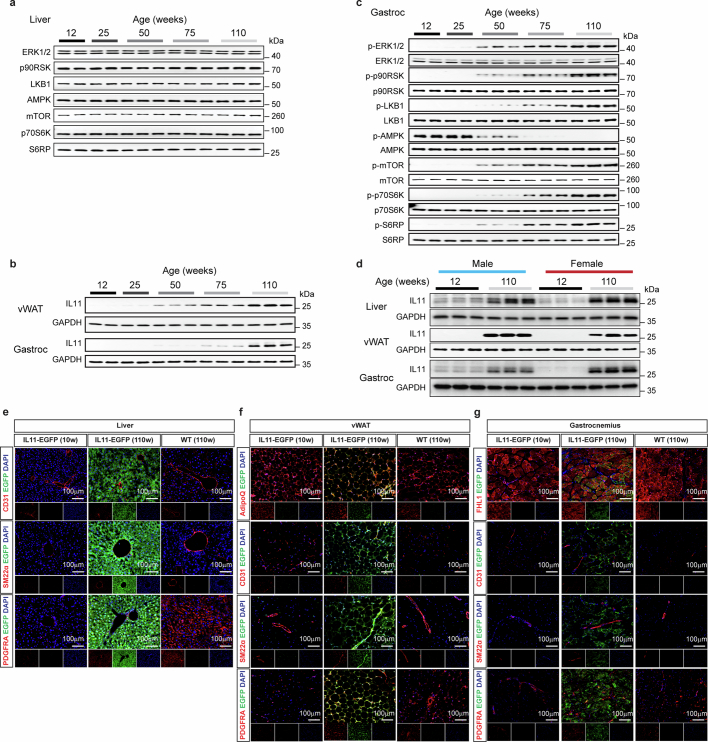
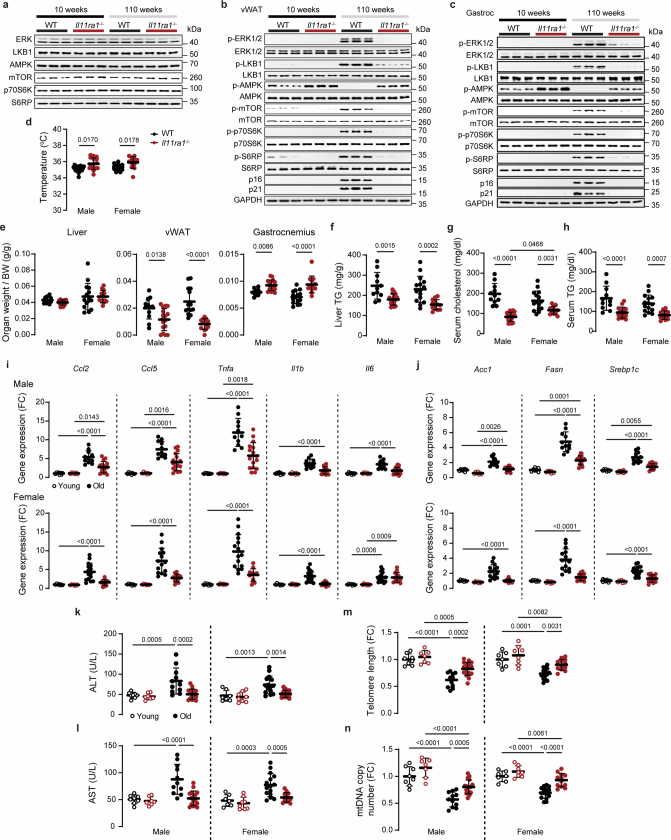
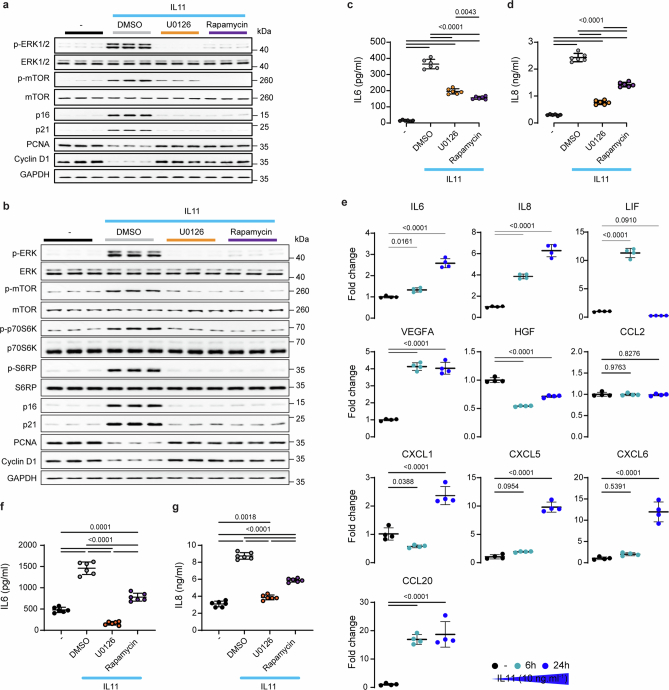
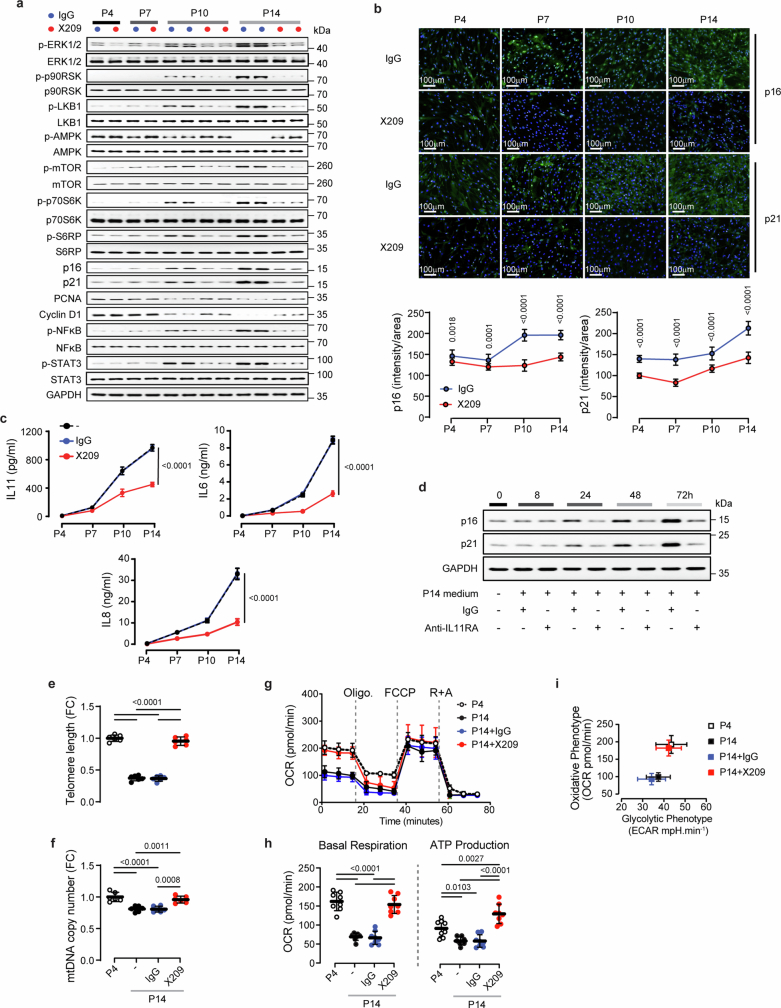
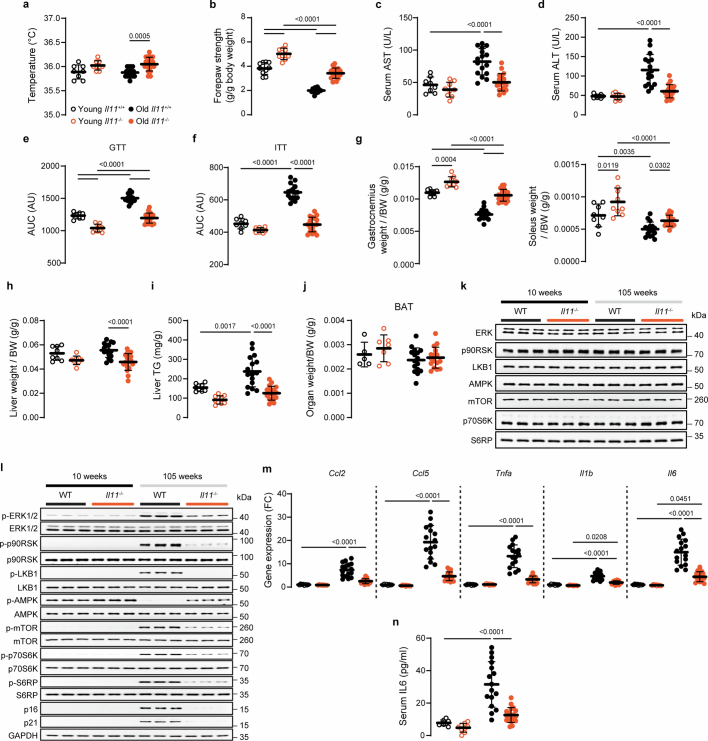
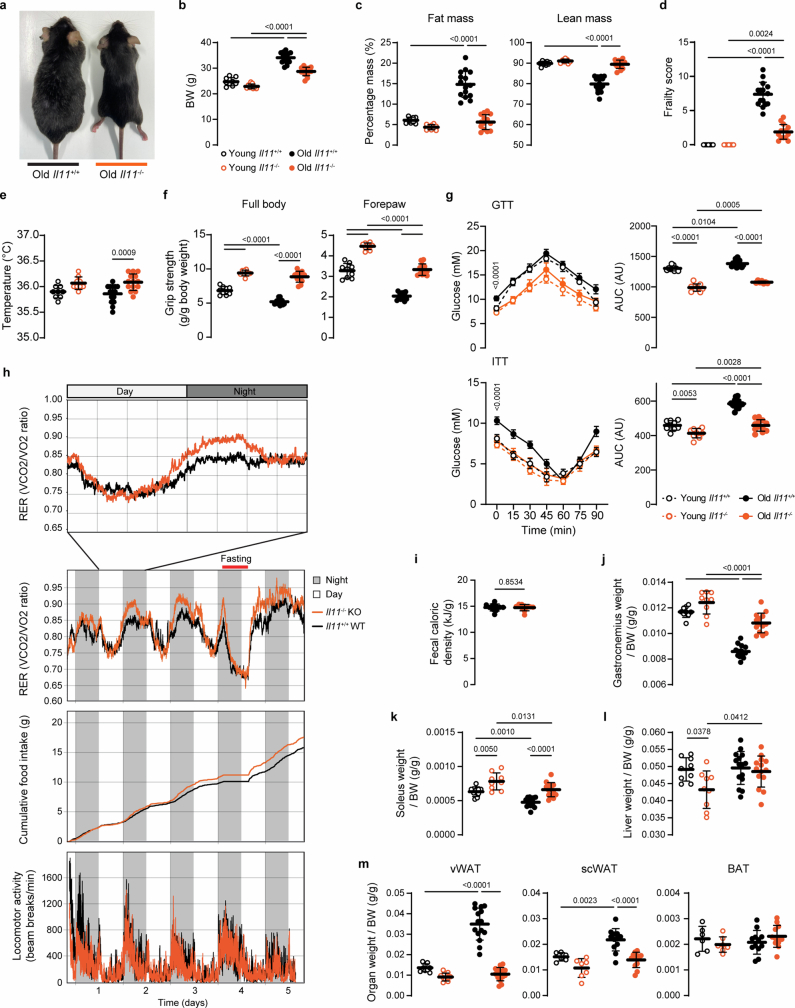
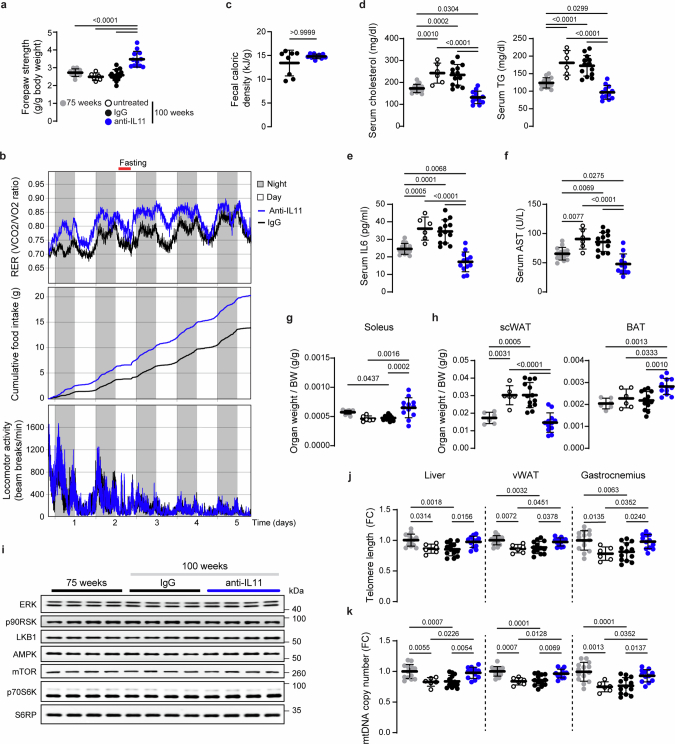
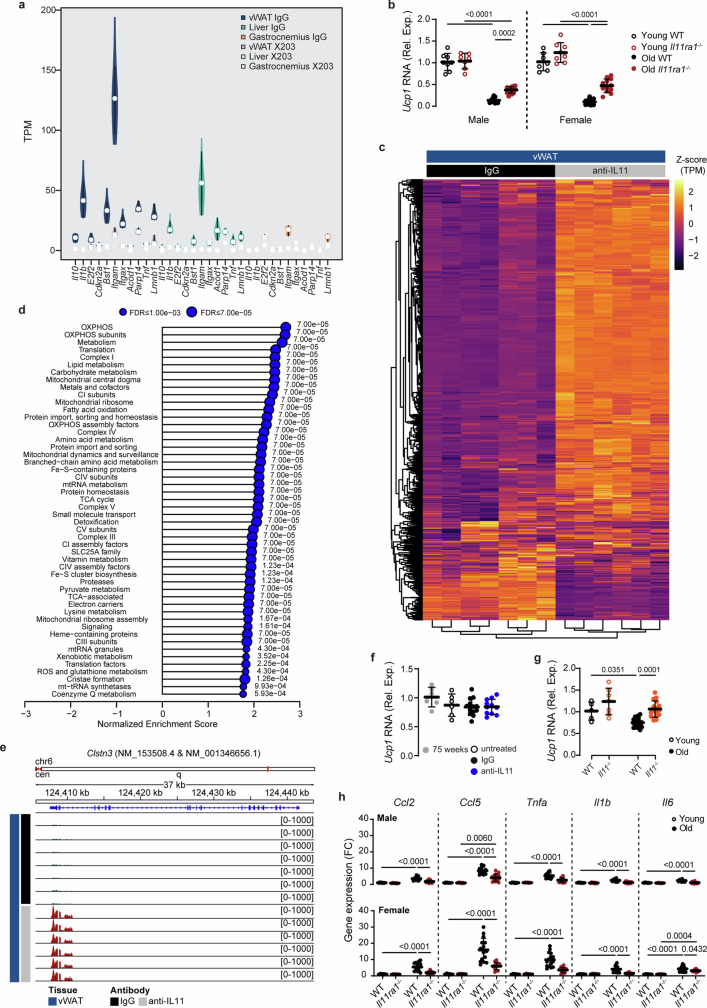
For healthspan and lifespan, ERK, AMPK and mTORC1 represent critical pathways and inflammation is a centrally important hallmark1-7. Here we examined whether IL-11, a pro-inflammatory cytokine of the IL-6 family, has a negative effect on age-associated disease and lifespan. As mice age, IL-11 is upregulated across cell types and tissues to regulate an ERK-AMPK-mTORC1 axis to modulate cellular, tissue- and organismal-level ageing pathologies. Deletion of Il11 or Il11ra1 protects against metabolic decline, multi-morbidity and frailty in old age. Administration of anti-IL-11 to 75-week-old mice for 25 weeks improves metabolism and muscle function, and reduces ageing biomarkers and frailty across sexes. In lifespan studies, genetic deletion of Il11 extended the lives of mice of both sexes, by 24.9% on average. Treatment with anti-IL-11 from 75 weeks of age until death extends the median lifespan of male mice by 22.5% and of female mice by 25%. Together, these results demonstrate a role for the pro-inflammatory factor IL-11 in mammalian healthspan and lifespan. We suggest that anti-IL-11 therapy, which is currently in early-stage clinical trials for fibrotic lung disease, may provide a translational opportunity to determine the effects of IL-11 inhibition on ageing pathologies in older people.


Conflict of interest statement

A.A.W., B.C., B.K.S., S.S. and S.A.C. are co-inventors of a patent family that includes: WO2022090509A (methods to extend healthspan and treat age-related diseases) and WO2018109174 (IL-11 antibodies). S.S. and S.A.C. are co-founders and shareholders of Enleofen Bio Pte Ltd and VVB Bio Pte Ltd. A.A.W. had consulted for VVB Bio on work unrelated to the study presented here. J.G. has acted as a consultant for Unity Biotechnology, Geras Bio, Myricx Pharma and Merck KGaA. Pfizer and Unity Biotechnology have funded research in the J.G. laboratory unrelated to the work presented here. J.G. owns equity in Geras Bio. J.G. is a named inventor in MRC and Imperial College patents related to senolytic therapies (the patents are not related to the work presented here). The other authors declare no competing interests.

Figures

Fig. 1
Fig. 1. The IL-11–ERK–mTORC1 signalling module is upregulated in ageing and associated with senescence and metabolic decline.
a, Signalling pathway by which IL-11 induces canonical STAT3 activation and non-canonical ERK activation, LKB1–AMPK inactivation and mTOR activation. b, Western blots of the indicated liver phosphoproteins from male mice aged 12–110 weeks (n = 5 per group); total (phosphorylated plus unphosphorylated) proteins are shown in Extended Data Fig. 1a. c, Heat map showing densitometry of IL-11 protein expression normalized to GAPDH (immunoblots are shown in Extended Data Fig. 1c) in gastrocnemius (gastroc) and vWAT from 12- to 110-week-old male mice (n = 5 per group). d, Representative immunofluorescence images (scale bars, 100 µm) of liver EGFP and SLC10A1 expression from 10 and 110-week-old Il11-EGFP mice and age-matched wild-type (WT) controls (n = 3 per group). Scale bars, 100 μm. e, Western blot of liver extracts from 10- and 110-week-old male wild-type and Il11ra1−/− mice (n = 5 per group); total proteins are shown in Extended Data Fig. 2a. f,g, Body weight (f) and percentages of fat and lean mass (male wild-type, n = 12; male Il11ra1−/−, n = 16; female wild-type, n = 15; female Il11ra1−/−, n = 13). h,i, Telomere length (h) and mtDNA copy number (i) in liver from young (10-week-old) and old (110-week-old) male and female wild-type and Il11ra1−/− mice (young male wild-type, n = 8; young male Il11ra1−/−, n = 7; old male wild-type, n = 11; old male Il11ra1−/−, n = 17; young female wild-type, n = 7; young female Il11ra1−/−, n = 8; old female wild-type, n = 15; old female Il11ra1−/−, n = 13). FC, fold change. j, IL-11 and GAPDH immunoblots from the indicated organs of 12- and 105-week-old male wild-type and Il11−/− mice (liver and soleus, n = 4 per group; vWAT and gastrocnemius, n = 6 per group). fi, Data are mean ± s.d.; the table below each panel shows summary statistics from two-way ANOVA with Sidak’s correction. For gel source data, see Supplementary Fig. 1. Source Data
Fig. 2
Fig. 2. Female Il11-deleted mice are protected from age-associated obesity, frailty, and metabolic decline.
a, Representative photograph of 105-week-old female wild-type and Il11−/− mice. bg, Body weight (b), percentage of fat and lean mass (normalized to body weight), frailty score (d), full body grip strength (e), serum cholesterol and triglycerides (f), and GTT and ITT (g) of young (12-week-old) and old (105-week-old) female wild-type and Il11−/− mice. hj, Indexed vWAT and scWAT weight (h), relative vWAT mRNA expression level of Acc1, Fasn and Srebp1c (i), and western blot showing activation status of ERK1/2, p90RSK, LKB1, AMPK, mTOR, p70S6K and S6RP and protein expression levels of p16, p21 and GAPDH (j). n = 6 per group. Western blots for the respective total proteins are shown in Extended Data Fig. 5k. k,l, Telomere length and mtDNA copy number (l) in vWAT from young and old female wild-type and Il11−/− mice. bi,kl, Data are mean ± s.d. (young wild-type, n = 8; young Il11−/−, n = 9; old wild-type, n = 16; old Il11−/−, n = 18; except for h (scWAT): young wild-type, n = 5; young Il11−/−, n = 7; old wild-type and Il11−/−, n = 16). Two-way ANOVA with Sidak’s correction (bf,h,i,k,l); two-way repeated measures ANOVA with Sidak’s correction (h). For gel source data, see Supplementary Fig. 1. Source Data
Fig. 3
Fig. 3. Therapeutic inhibition of IL-11 reduces age-associated metabolic dysfunction, pathogenic signalling and sarcopenia in male mice.
a, Schematic of anti-IL-11 (X203) therapeutic dosing experiment in old male mice for experiments shown in bm. Mice were either aged naturally (untreated) or given either X203 or an IgG control antibody (40 mg kg−1, every 3 weeks) starting from 75 weeks of age for a duration of 25 weeks. Created with BioRender.com. b, Body weights across time. c,d, Changes (Δ) in fat and lean mass percentage (c) and area under the curve (AUC) of GTT and ITT (d) (values at endpoint (100-week-old) − values at starting point (75-week-old)). a.u., arbitrary units. e, Frailty scores at start and endpoint. Data are shown as values recorded at starting and endpoint. f, Full body grip strength. g, RER in young (14-week-old) and IgG or X203-treated old (81-week-old) mice, 6 weeks after IgG or X203 administration was started (n = 10 per group). hj, Body temperatures (h), serum ALT (i) and liver triglycerides (j). k,l, Indexed weights of (k) and total collagen content (by hydroxyproline assay) in (l) liver, gastrocnemius and vWAT. m, Western blot showing activation status of ERK1/2, p90RSK, LKB1, AMPK, mTOR, p70S6K, S6RP and protein expression levels of IL-11, p16, p21 and GAPDH in vWAT (n = 6 per group). Western blots of total protein are presented in Extended Data Fig. 7i. bd,f,hl, Data are mean ± s.d. 75-week-old control: n = 10 (f), n = 14 (il); untreated 100-week-old: n = 6 (except for k (liver), n = 5); IgG-treated 100-week-old: n = 13; X203-treated 100-week-old: n = 12. Two-way repeated measures ANOVA with Sidak’s correction (b); one-way ANOVA with Tukey’s correction (c,d (GTT), e,f,hl); one-way ANOVA with Kruskal–Wallis correction (d (ITT)). For gel source data, see Supplementary Fig. 1. Source Data
Fig. 4
Fig. 4. Anti-IL-11 reduces vWAT inflammation and reactivates an age-repressed thermogenic programme.
ae,gj, Data for therapeutic experiments in old male mice as shown in Fig. 3a. a, Bubble map showing hallmark gene set enrichment analysis for differentially expressed genes in the vWAT, liver and gastrocnemius of mice receiving anti-IL-11 therapy compared with IgG. Colour represents normalized enrichment score (NES); black represents negative NES, indicating down-regulation of the gene set; yellow represents positive NES, suggesting up-regulation. Dot size indicates significance (the larger the dot, the smaller the adjusted P value). EMT, epithelial–mesenchymal transition. b, Heat map of row-wise scaled transcripts per million (TPM) values of senescence genes in vWAT, liver, gastrocnemius. c, Abundance of Ucp1 reads in vWAT. d, log2-transformed fold change heat map of beiging genes in vWAT from IgG- or anti-IL-11-treated 100-week-old mice, based on RNA-seq. e, Western blot of UCP1, PGC1α and GAPDH expression in vWAT (n = 6 per group). f, Relative expression levels of Ucp1 mRNA (young wild-type, n = 8; young Il11−/−, n = 9; old wild-type, n = 16; old Il11−/−, n = 18) as well as UCP1 and PGC1α protein expression (n = 6 per group) in vWAT isolated from young and old female wild-type and Il11−/− mice. g,h, Abundance of Clstn3b and S100b reads (g) and log2-transformed fold change heat map of pro-inflammatory markers (from RNA-seq) (h) in vWAT. i, Haematoxylin and eosin-stained vWAT (scale bars, 100 µm) and quantification of lipid droplet size (mean of lipid droplet area, n = 25 (5 fields per mouse from 5 mice per group)). j, Immunohistochemistry staining of CD68 in vWAT (scale bars, 50 µm). ad,fh, Liver and gastrocnemius (n = 8 per group), vWAT IgG, n = 7; vWAT anti-IL-11, n = 6. c,f,g,i, Data are mean ± s.d. Two-tailed Student’s t-test (c,g,i); two-way ANOVA with Sidak’s correction (f). For gel source data, see Supplementary Fig. 1. Scale bars: 100 μm (i), 50 μm (j). Source Data
Fig. 5
Fig. 5. Genetic or pharmacologic inhibition of IL-11 extends life expectancy of male and female mice.
ac, Kaplan–Meier survival curves (shading represents 95% confidence interval) showing the cumulative survival probabilities for male (a), female (b) and sex-pooled (c) wild-type and Il11−/− mice. df, Kaplan–Meier survival curves showing the cumulative survival probabilities for male (d), female (e) and sex-pooled (f) mice, comparing those receiving monthly administration of IgG or X203 (40 mg kg−1, intraperitoneal injection), starting from 75 weeks of age (red dotted line). Statistical significance (two-tailed P value) was assessed by means of the log-rank (Mantel–Cox) and Wilcoxon test for survival curve comparisons. Source Data
Extended Data Fig. 1
Extended Data Fig. 1. Age-dependent expression of IL11 in varied cell types across tissues.
a Western blots (WB) of total ERK1/2, p90RSK, LKB1, AMPK, mTOR, p70S6K, and S6RP in livers from 12, 25, 50, 75, and 110-week-old male mice for the respective phosphoproteins shown in Fig. 1b. b WB of IL11 and GAPDH in visceral gonadal white adipose tissue (vWAT) and gastrocnemius from 12, 25, 50, 75, and 110-week-old male mice (n = 5/group). c WB of p-ERK1/2, p-p90RSK, p-LKB1, p-AMPK, p-mTOR, p-p70S6K, p-S6RP, and their respective total proteins in gastrocnemius from 12, 25, 50, 75, and 110-week-old male mice (n = 5/group). d WB of IL11 and GAPDH in the liver, vWAT and gastrocnemius from 12-week-old and 110-week-old male and female mice (n = 3/group). e-g Representative immunofluorescence images (scale bars, 100 µm) of EGFP expression in the livers, vWAT, and gastrocnemius, colocalized with parenchymal cell markers Adiponectin (AdipoQ) in vWAT and Four and a half LIM domains (FHL1) in gastrocnemius, endothelial cells (CD31), smooth muscle transgelin (SM22α), and pan-fibroblast marker (PDGFRα) of 10 and 110-week old Il11-EGFP mice (representative dataset from n = 3/group). Source Data
Extended Data Fig. 2
Extended Data Fig. 2. Beneficial signalling, metabolic, inflammation and ageing biomarker effects associated with Il11ra1 deletion.
a WB of total proteins in livers for Fig. 1e. WB showing the activation status of ERK1/2, p90RSK, LKB1, AMPK, mTOR, p70S6K, S6RP, and protein expression levels of p16, p21 and GAPDH in b vWAT and c gastrocnemius from 10 and 110-week-old male WT and Il11ra1−/− mice (n = 5/group). d body temperatures, e indexed weights of liver, vWAT and gastrocnemius, and f the levels of liver triglycerides (TG), g serum cholesterol, and h serum triglycerides of 110-week-old male and female WT and Il11ra1−/− mice. Relative gene expression levels of i Ccl2, Ccl5, Tnfα, Il1β, Il6, j Acc, Fasn and Srebp1c in livers, and serum levels of k ALT and l AST in young and old male and female WT and Il11ra1−/− mice. Gastrocnemius m telomere length and n mitochondria DNA (mtDNA) copy number from young and old male and female WT and Il11ra1−/− mice. d-l Data are shown as mean ± SD. d-n young male WT, n = 8 (i-n, except for i (Acc and Fasn), n = 7); young male Il11ra1−/−, n = 7 (i-n, except for i (Acc and Fasn), n = 8); old male WT, n = 11 (e (liver), f-n), n = 12 (d, e (vWAT and gastrocnemius); old male Il11ra1−/−, n = 15 (e (liver)), n = 16 (d, f-l), n = 17 (e (vWAT and gastrocnemius), i (Ccl5), m-n); young female WT, n = 7; young female Il11ra1−/−, n = 8; old female WT, n = 14 (e (liver and vWAT)), n = 15 (d, e (gastrocnemius), f-n); old female Il11ra1−/−, n = 12 (m-n), n = 13 (d-l); two-way ANOVA with Sidak’s correction. For gel source data, see Supplementary Fig. 1. BW: body weight; FC: fold change. Source Data
Extended Data Fig. 3
Extended Data Fig. 3. IL11 causes ERK and mTORC1-dependent senescence and senescence-associated secretory phenotypes.
a-d, f,g Data for IL11 (24 h)-stimulated primary human cells in the presence of either DMSO, U0126, or rapamycin (n = 6/group). a-b WB showing the activation status of ERK1/2, mTOR, p16, p21, Cyclin D1, and PCNA protein expression by WB from IL11-stimulated a primary human cardiac fibroblasts (HCFs) and b hepatocytes. Levels of secreted c IL6 and d IL8 by ELISA from HCF supernatant. e Relative levels of IL6, IL8, LIF, VEGFA, HGF, CCL2, CXCL1, CXCL5, CXCL6, and CCL20 in the supernatant of IL11-stimulated primary human hepatocytes (6 and 24 h) as measured by Olink proximity extension assay (n = 4/group). Concentrations of f IL6 and g IL8 in the hepatocyte supernatant (as measured by ELISA). a-d, f-g IL11 (5 ng/ml for HCF, 10 ng/ml for hepatocytes), U0126 (10 µM), rapamycin (10 nM). c-g Data are shown as mean ± SD. c, d, f, g One-way ANOVA with Tukey’s correction; e one-way ANOVA with Dunnett’s correction. For gel source data, see Supplementary Fig. 1. Source Data
Extended Data Fig. 4
Extended Data Fig. 4. Inhibition of IL11 signalling reduces replicative senescence, inflammation, ageing biomarkers, and metabolic decline in human cardiac fibroblasts.
a-c Data for HCF at passage 4 (P4), 7, 10, and 14 that had been passaged in the presence of either IgG or anti-IL11RA (X209; 2 µg/ml) from P2. a WB of total and p-ERK1/2, p-p90RSK, p-LKB1, p-AMPK, p-mTOR, p-p70S6K, p-S6RP, p-NFκB, p-STAT3, p16, p21, PCNA, Cyclin D, and GAPDH (n = 6/group). b Immunofluorescence images (scale bars, 100 μm; representative datasets from n = 7/group) and quantification of intensity/area (n = 14/group) for p16 and p21 staining. c IL11, IL6 and IL8 levels in the supernatant based on ELISA (n = 6/group). d WB showing the expression levels of p16, p21, and GAPDH from HCFs P4 that were stimulated for 8, 24, 48, and 72 h with media collected from HCFs P14 that had been grown and passaged in the presence of either IgG or anti-IL11RA (X209; 2 µg/ml) from P2 (n = 4/group). e Telomere length (n = 6/group) and f mtDNA copy number (n = 6/group) and seahorse assay (n = 8/group) showing g mitochondrial oxygen consumption rate (OCR), h changes in OCR during basal respiration and ATP production states, and i oxidative and glycolytic energy phenotypes at baseline in HCFs P4 and P14 either untreated or in the presence of either IgG or anti-IL11RA (X209; 2 µg/ml). b, c, e-i Data are shown as mean ± SD. b, c Two-way ANOVA with Sidak’s correction, e, f, h one-way ANOVA with Tukey’s correction. For gel source data, see Supplementary Fig. 1. Source Data
Extended Data Fig. 5
Extended Data Fig. 5. Female Il11−/− mice are protected from age-associated frailty and inflammation and have advantageous metabolic profiles.
a Body temperatures, b front paw grip strength, serum levels of c ALT, d AST, area under the curves (AUC) of e glucose tolerance tests (GTT) and f insulin tolerance tests (ITT), weights of g skeletal muscle (gastrocnemius and soleus) and h liver (normalised/indexed to BW), i liver triglyceride (TG) levels, j indexed brown adipose tissues (BAT) weight, k WB of total proteins for the respective phospho proteins in vWAT as shown in Fig. 2j,l WB showing ERK1/2, mTOR, p70S6K, and S6RP activation and p16, p21, and GAPDH protein expression levels (n = 6/group) in gastrocnemius, m relative pro-inflammatory gene expression (Ccl2, Ccl5, Tnfα, Il1β and Il6) levels in vWAT, and n serum IL6 levels from young (12-week-old) and old (105-week-old) female WT and Il11−/− mice. a-j, m-n Data are shown as mean ± SD, two-way ANOVA with Sidak’s correction (young WT, n = 5 (j), n = 8 (a, c-i, m-n), n = 10 (b); young Il11−/−, n = 7 (j), n = 9 (a-i, m-n); old WT, n = 16; old Il11−/−, n = 16 (j), n = 18 (a-i, m-n). For gel source data, see Supplementary Fig. 1. AU: arbitrary units; BW: body weight; FC: fold change. Source Data
Extended Data Fig. 6
Extended Data Fig. 6. Old male Il11−/−mice are protected from age-associated metabolic decline.
a Representative image of 108-week-old WT and Il11−/− male mice. b Body weights, c percentages of fat and lean mass (normalised to BW), d frailty scores, e body temperatures, f full body and forepaw grip strength measurements, g glucose and insulin tolerance tests (GTT and ITT) from young (12-week-old) and old (105-week-old) male WT and Il11−/− mice. h Respiratory exchange ratio (RER) measurement at day 2 (top; 24 h) and assessment of RER (second panel), cumulative food intake, and locomotive activities using the phenomaster system over a 5-day period in 68–70-week-old male WT and Il11−/− mice (n = 10/group). i Faecal caloric density as measured by bomb calorimetry in 95–105-week-old male WT and Il11−/− mice (n = 10/group). Indexed weight of j gastrocnemius k, soleus, l liver, m vWAT, subcutaneous WAT (scWAT), and BAT. b-g, i-m Data are shown as mean ± SD. b-g, j-m Two-way ANOVA with Sidak’s correction (young WT and Il11−/−, n = 6 (m (scWAT and BAT)), n = 9 (b-g, j-l, m (vWAT)); old WT, n = 12 (m (scWAT and BAT)), n = 15 (b-g, j-l, m (vWAT)); old Il11−/−, n = 12 (f-g, m (scWAT and BAT)), n = 14 (b-e,j-l, m (vWAT)); i two-tailed Mann Whitney test. AU: arbitrary units; BW: body weight; FC: fold change. Source Data
Extended Data Fig. 7
Extended Data Fig. 7. Anti-IL11 therapy improves muscle strength and metabolic health in old male mice.
a-k Data for anti-IL11 therapeutic dosing experiment as shown in Schematic Fig. 3a in which IgG or X203 were administered to male mice starting from the age of 75 weeks. a Forepaw grip strength, b RER measurements, cumulative food intake, and locomotive activities as measured by phenomaster for 5 days on IgG/X203-treated old (81-week-old) male mice − 6 weeks after IgG/X203 administration was started (n = 10/group). c Faecal caloric density as measured by bomb calorimetry in IgG and X203-treated 115-week-old male mice (IgG, n = 8; X203, n = 10). Serum levels of d cholesterol, TG, e IL6, and f AST, indexed weight of g soleus, h scWAT and BAT, and i WB of total proteins for the respective phospho-proteins in vWAT shown in Fig. 3m (n = 6/group). j telomere length and k mtDNA copy number. a, c-h, j-k Data are shown as mean ± SD. a, d-h, j-k One-way ANOVA with Tukey’s correction (75-week-old control, n = 6 (h), n = 10 (a), n = 14 (d-g, j-k); untreated 100-week-old, n = 6; IgG 100-week-old, n = 13; X203 100-week-old, n = 12); c two-tailed Mann Whitney test; j two-tailed Student’s t-test. For gel source data, see Supplementary Fig. 1. BW: body weight; FC: fold change. Source Data
Extended Data Fig. 8
Extended Data Fig. 8. Therapeutic inhibition of IL11 reduces age-associated metabolic dysfunction, frailty and sarcopenia in female mice.
a Schematic of anti-IL11 (X203) therapeutic dosing experiment in old female mice for experiments shown in (b-h; IgG, n = 10 (g), n = 11 (b-f, h); X203, n = 13). Mice were given either X203 or an IgG control antibody (40 mg/kg, every 3 weeks) starting from 75 weeks of age for a duration of 25 weeks. Created with BioRender.com. b Body weights across time. c-d Changes (Δ; values at end-point (100-week-old) - values at starting point (75-week-old)) in c fat and lean mass percentage, and d area under the curve (AUC) of GTT and ITT. e Frailty scores at starting (75-week-old) and end-point (100-week-old). f-g Full body and front paw grip strength at end-point (100-week-old) and changes in full body and front paw grip strength over 25 weeks of treatment (values at end-point (100-week-old) - values at starting point (75-week-old)). h Body temperatures. b-d, f-h Data are shown as mean ± SD. b Two-way ANOVA, c-h two-tailed Student’s t-test except for d Δ AUC GTT, which was analysed by two-tailed Mann Whitney test. AU: arbitrary units; BW: body weight. Source Data
Extended Data Fig. 9
Extended Data Fig. 9. Beneficial effects of anti-IL11 in aged white adipose tissue.
a. Violin plot of Transcripts per million (TPM) values of senescence genes (based on Tabula Muris Senis consortium) in vWAT, liver, gastrocnemius samples from mice receiving either IgG or anti-IL11 as shown in schematic Fig. 3a. b. Relative Ucp1 mRNA from 10-week-old and 110-week-old male and female WT and Il11ra1−/− mice (vWAT). c. Heatmap showing row-wise scaled TPM values for the gene-list in Mitocarta 3.0. (no. of genes = 1,019 with TPM > = 5 in at least one condition). d. A lollipop plot for top 50 significant Mitocarta 3.0 pathways (p-adj<0.05) in enrichment analysis using fgsea R package. No negative NES was found to be significant. e. Distribution of RNA-seq reads at the Clstn3 locus from IgG or anti-IL11-treated vWAT. Relative Ucp1 mRNA expression levels in BAT from f therapeutic dosing group (75-week-old, n = 6; untreated 100-week-old, n = 6; IgG-treated 100-week-old n = 13; X203-treated 100-week-old, n = 12) and g female WT and Il11−/− mice (young WT, n = 5; young Il11−/−, n = 7; old WT and Il11−/−, n = 16/group). h Relative vWAT mRNA expression of pro-inflammatory markers (Ccl2, Ccl5, Tnfα, Il1β, Il6) in young (10-week-old) and old (110-week-old) male and female WT and Il11ra1−/− mice. a, c, d, e Liver and gastrocnemius (n = 8/group), vWAT IgG, n = 7; vWAT anti-IL11, n = 6; b, h young male WT, n = 8; young male Il11ra1−/−, n = 7; old male WT, n = 11; old male Il11ra1−/−, n = 14; young female WT, n = 7; young female Il11ra1−/−, n = 8; old female WT, n = 15; old female Il11ra1−/−, n = 12. a Data are shown as violin plots with median ± min-max; b, f-h data are shown as mean ± SD. b, g, h Two-way ANOVA with Sidak’s correction; e one-way ANOVA with Tukey’s correction. Source Data
Extended Data Fig. 10
Extended Data Fig. 10. Gross appearance of mice receiving anti-IL11 versus IgG in lifespan studies.
Representative images of 130-week-old male (top) and female (bottom) mice from the lifespan therapeutic dosing study where mice received either IgG (mice on the left) or anti-IL11 (X203; mice on the right) from 75 weeks of age until death.

Comment in

References

    1. López-Otín, C., Blasco, M. A., Partridge, L., Serrano, M. & Kroemer, G. Hallmarks of aging: an expanding universe. Cell186, 243–278 (2022).10.1016/j.cell.2022.11.001 - DOI - PubMed
    1. Fabian, D. K., Fuentealba, M., Dönertaş, H. M., Partridge, L. & Thornton, J. M. Functional conservation in genes and pathways linking ageing and immunity. Immun. Ageing18, 23 (2021). 10.1186/s12979-021-00232-1 - DOI - PMC - PubMed
    1. Selman, C. et al. Ribosomal protein S6 kinase 1 signaling regulates mammalian life span. Science326, 140–144 (2009). 10.1126/science.1177221 - DOI - PMC - PubMed
    1. Salminen, A. & Kaarniranta, K. AMP-activated protein kinase (AMPK) controls the aging process via an integrated signaling network. Ageing Res. Rev.11, 230–241 (2012). 10.1016/j.arr.2011.12.005 - DOI - PubMed
    1. Slack, C. et al. The Ras–Erk–ETS-signaling pathway is a drug target for longevity. Cell162, 72–83 (2015). 10.1016/j.cell.2015.06.023 - DOI - PMC - PubMed

MeSH terms

Substances