. 2024 Aug;632(8023):166-173.
doi: 10.1038/s41586-024-07707-3. Epub 2024 Jul 17.

Identification of plant transcriptional activation domains

Affiliations

Identification of plant transcriptional activation domains

Nicholas Morffy et al. Nature. 2024 Aug.

Abstract

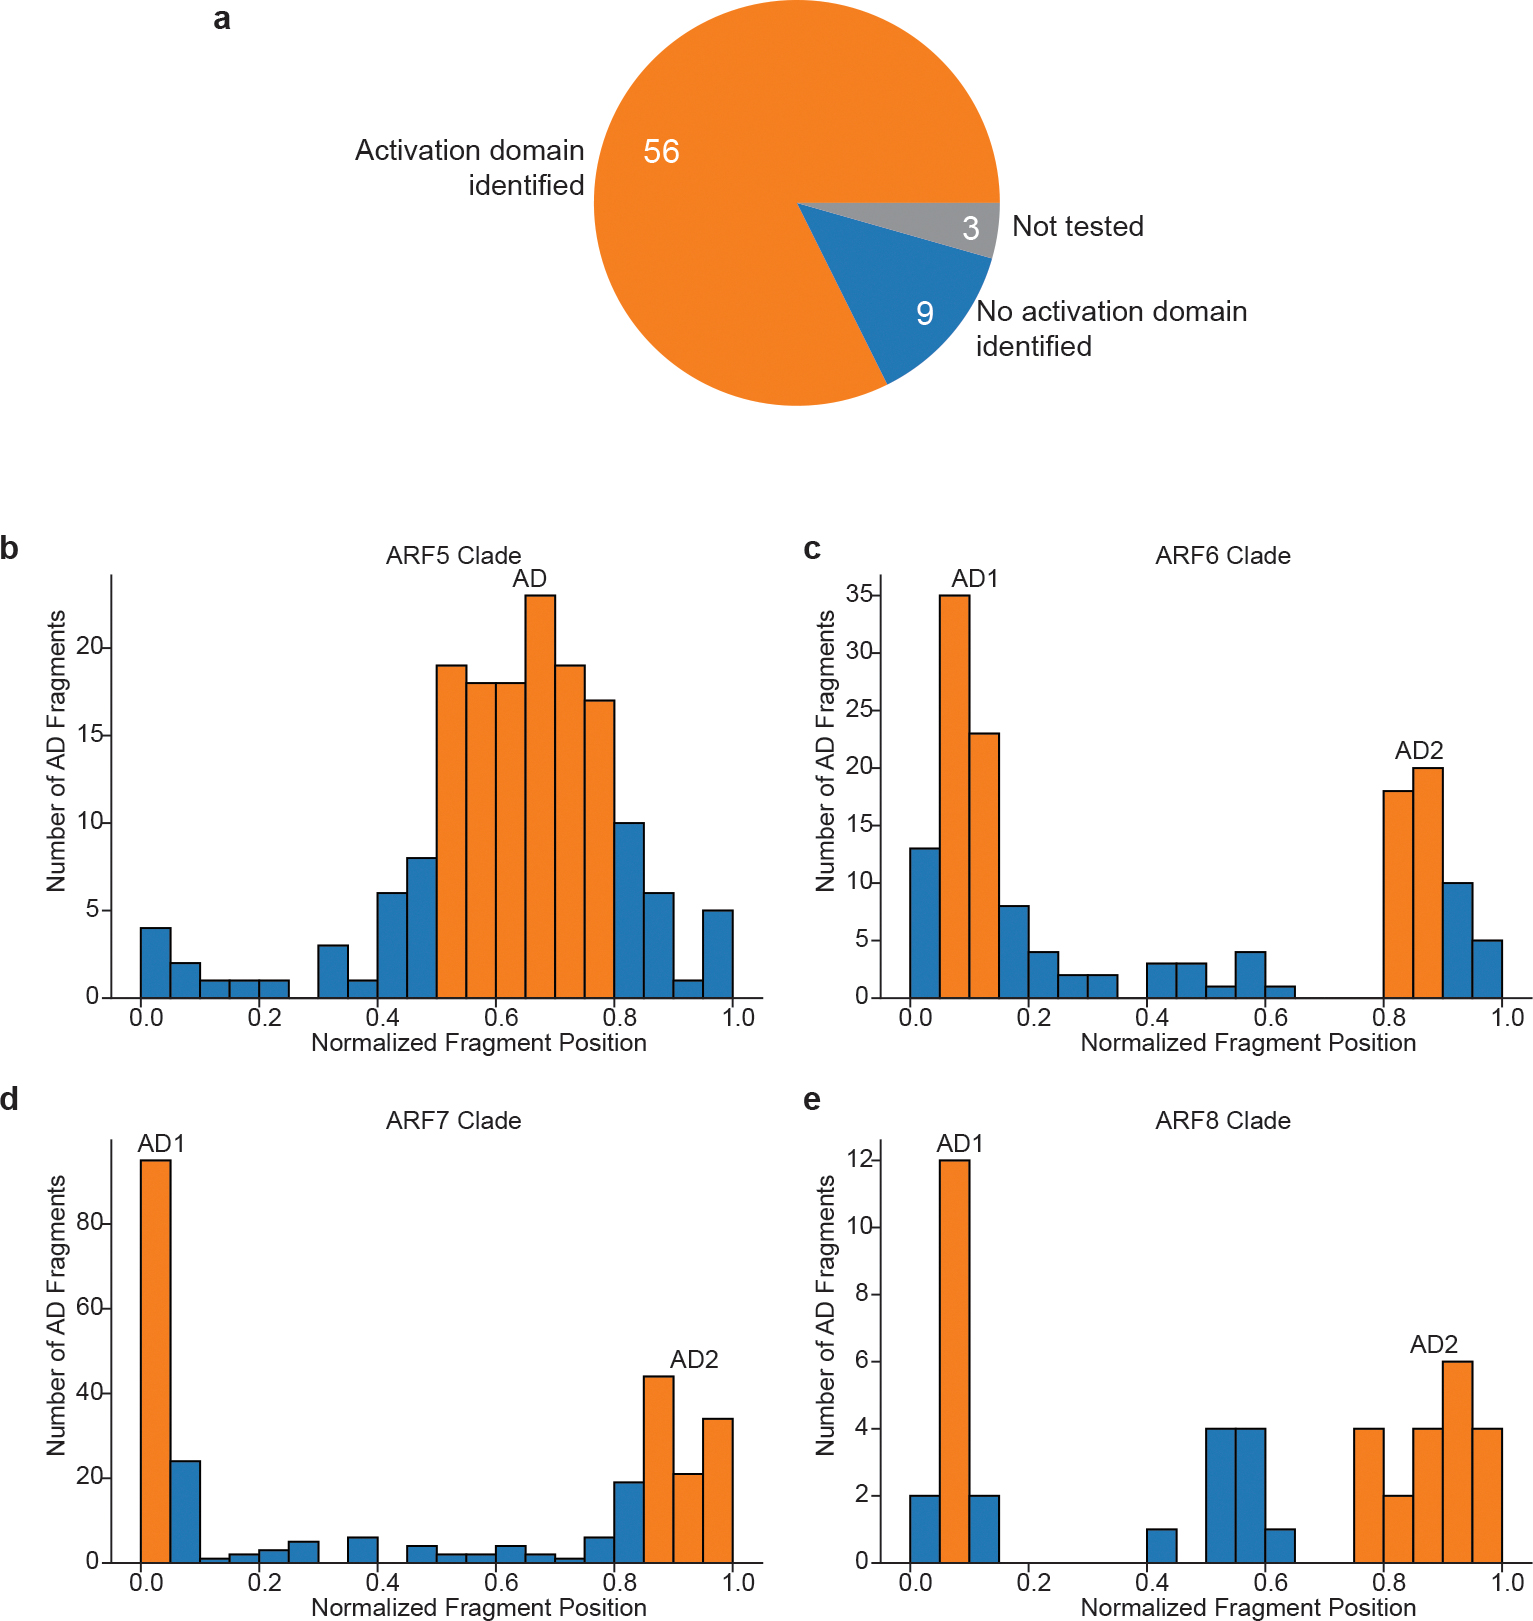
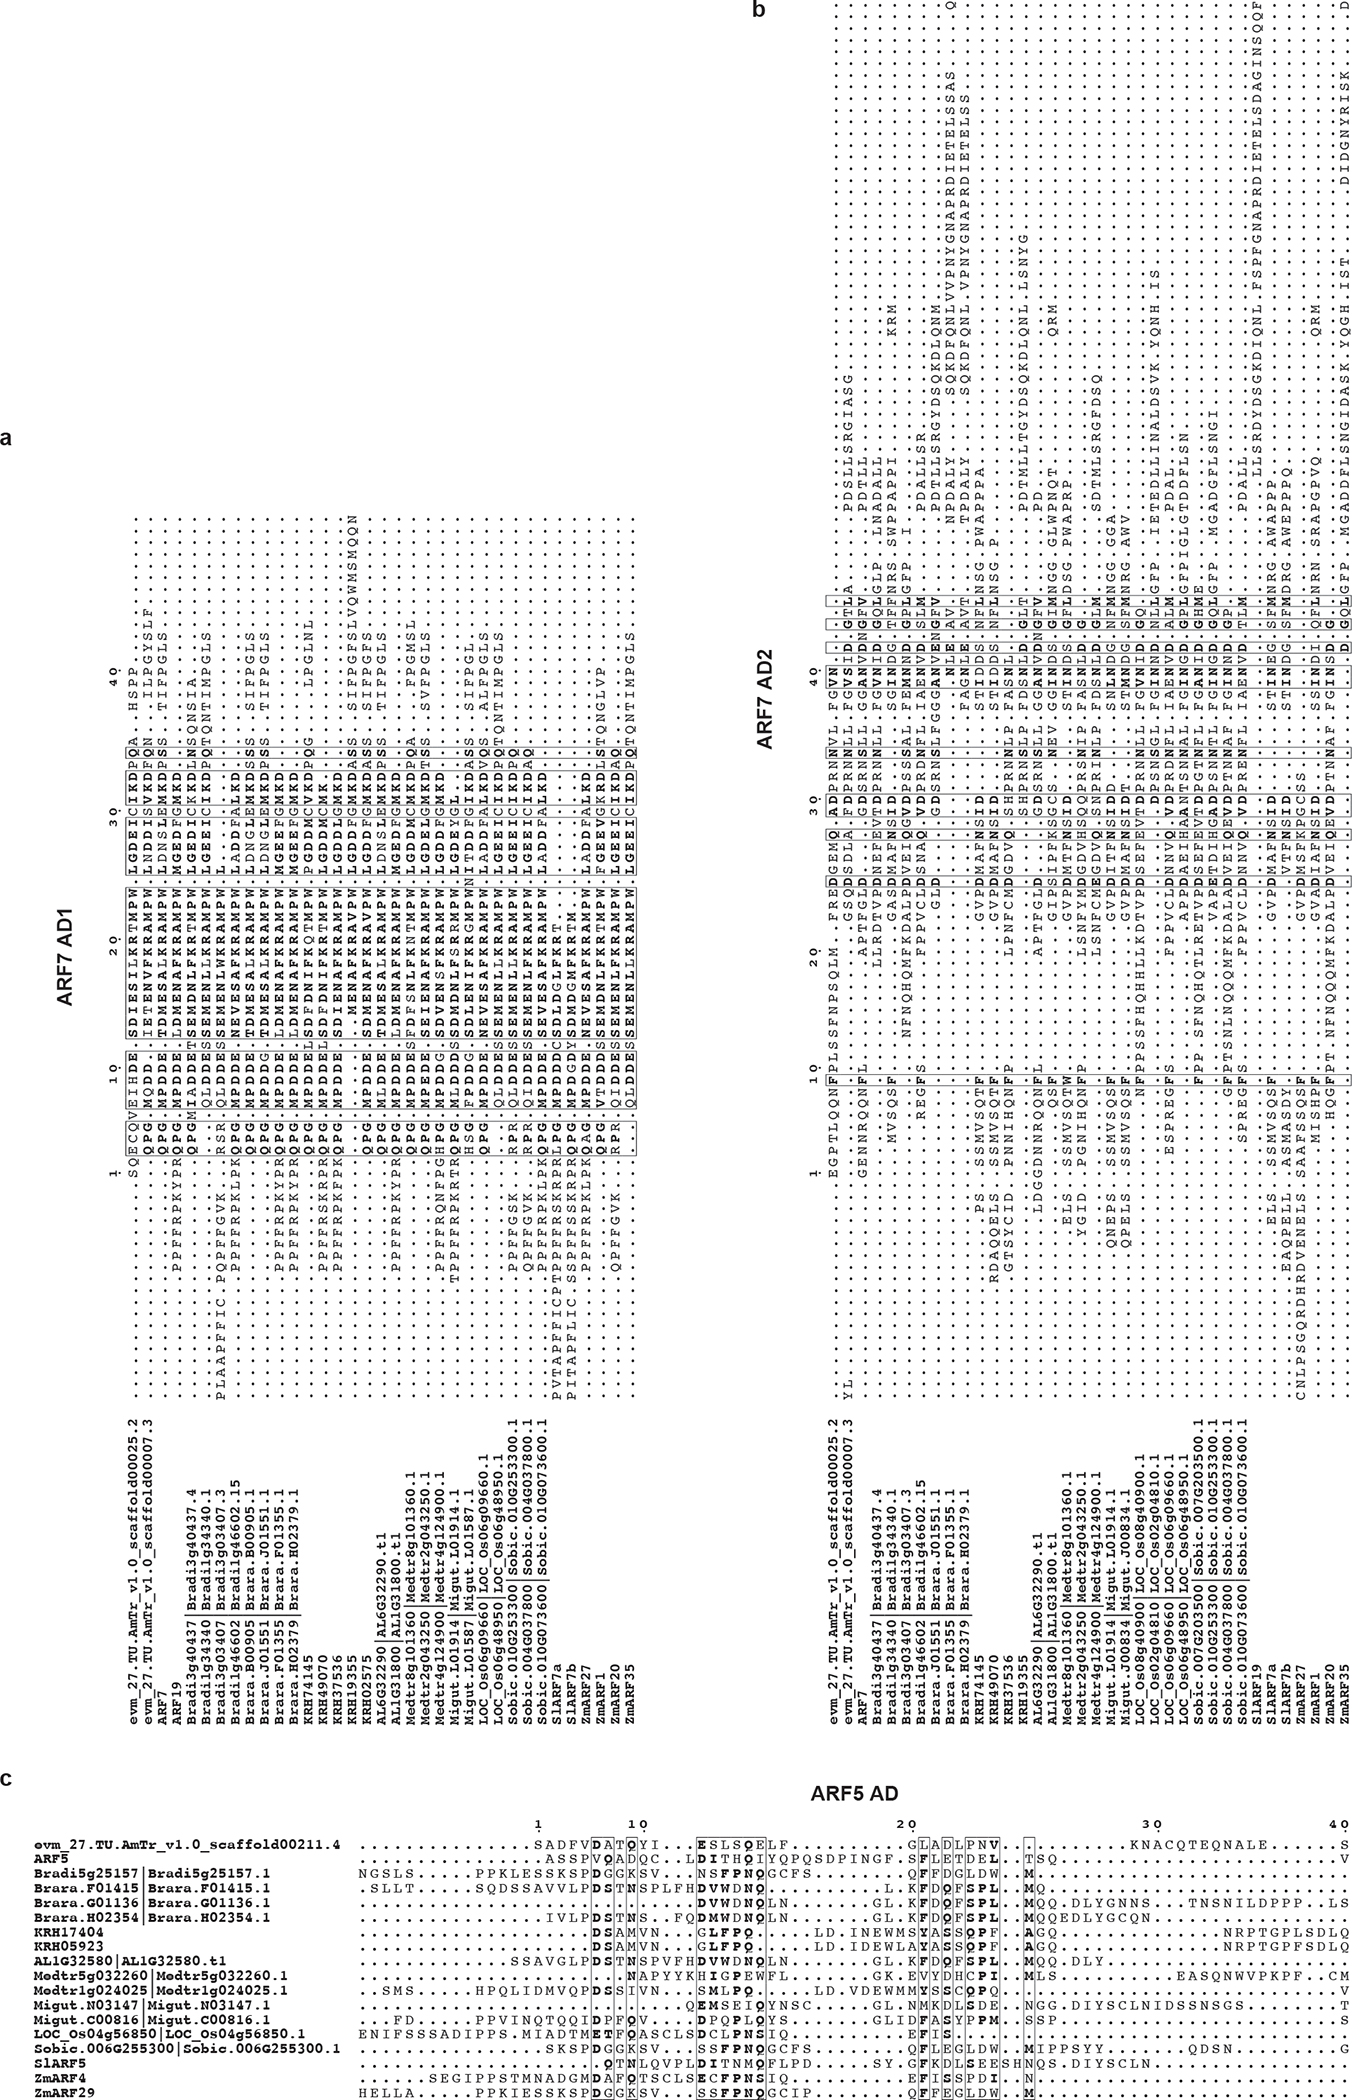
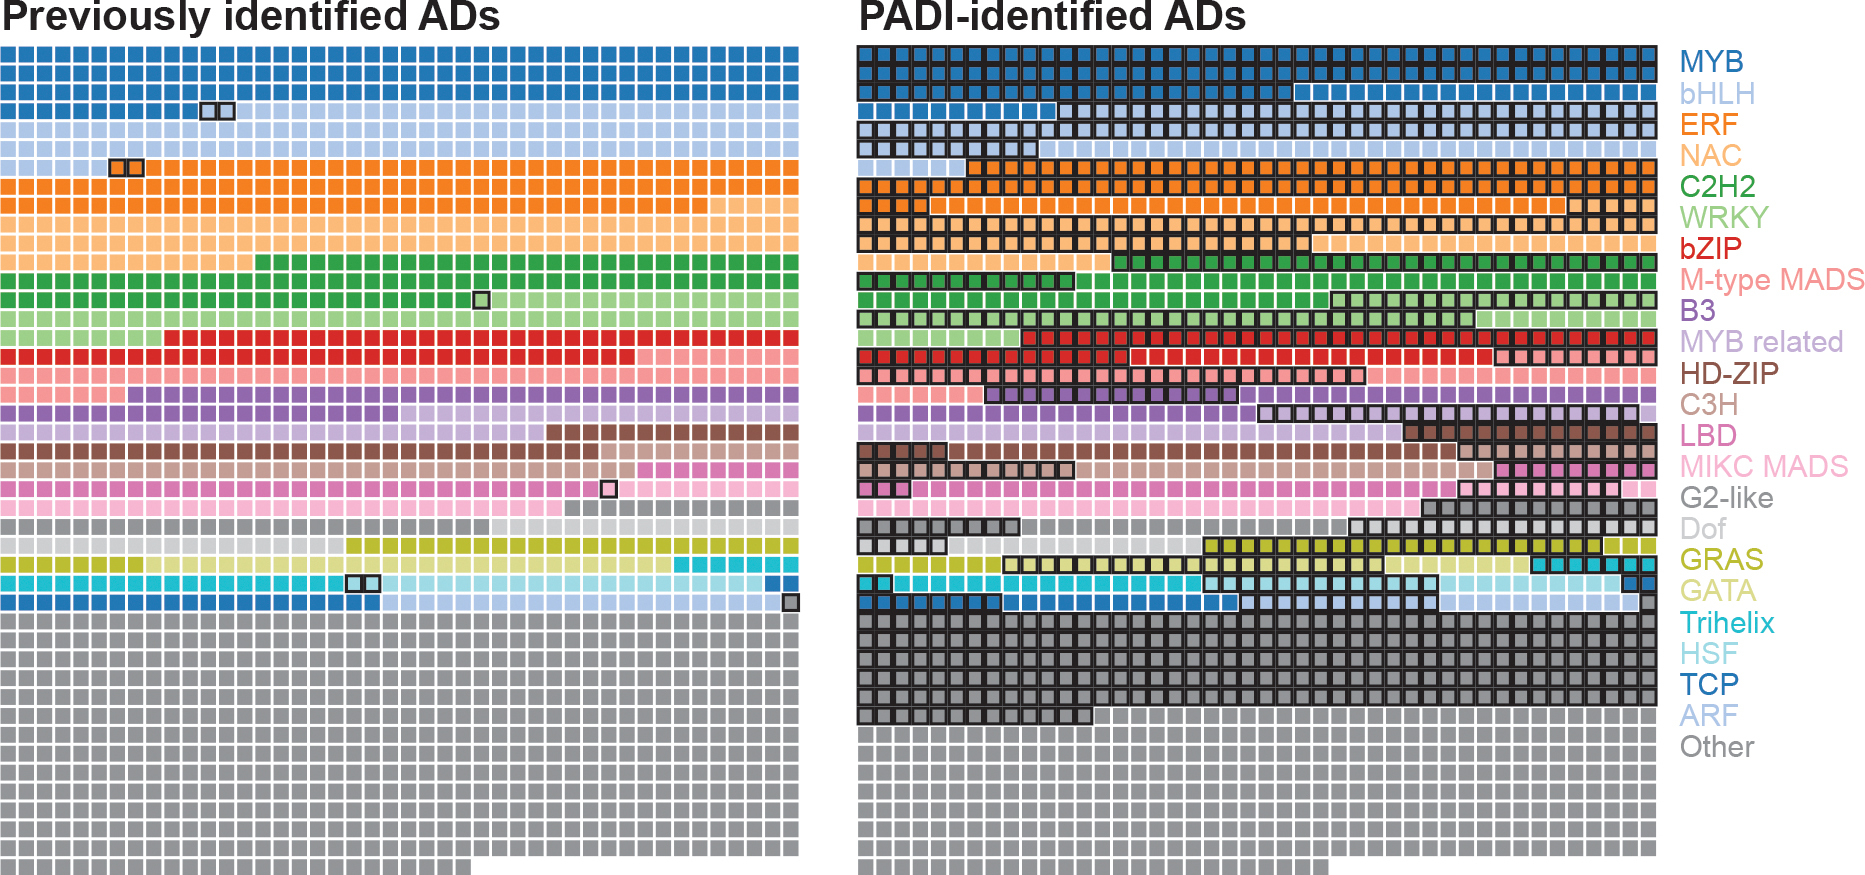
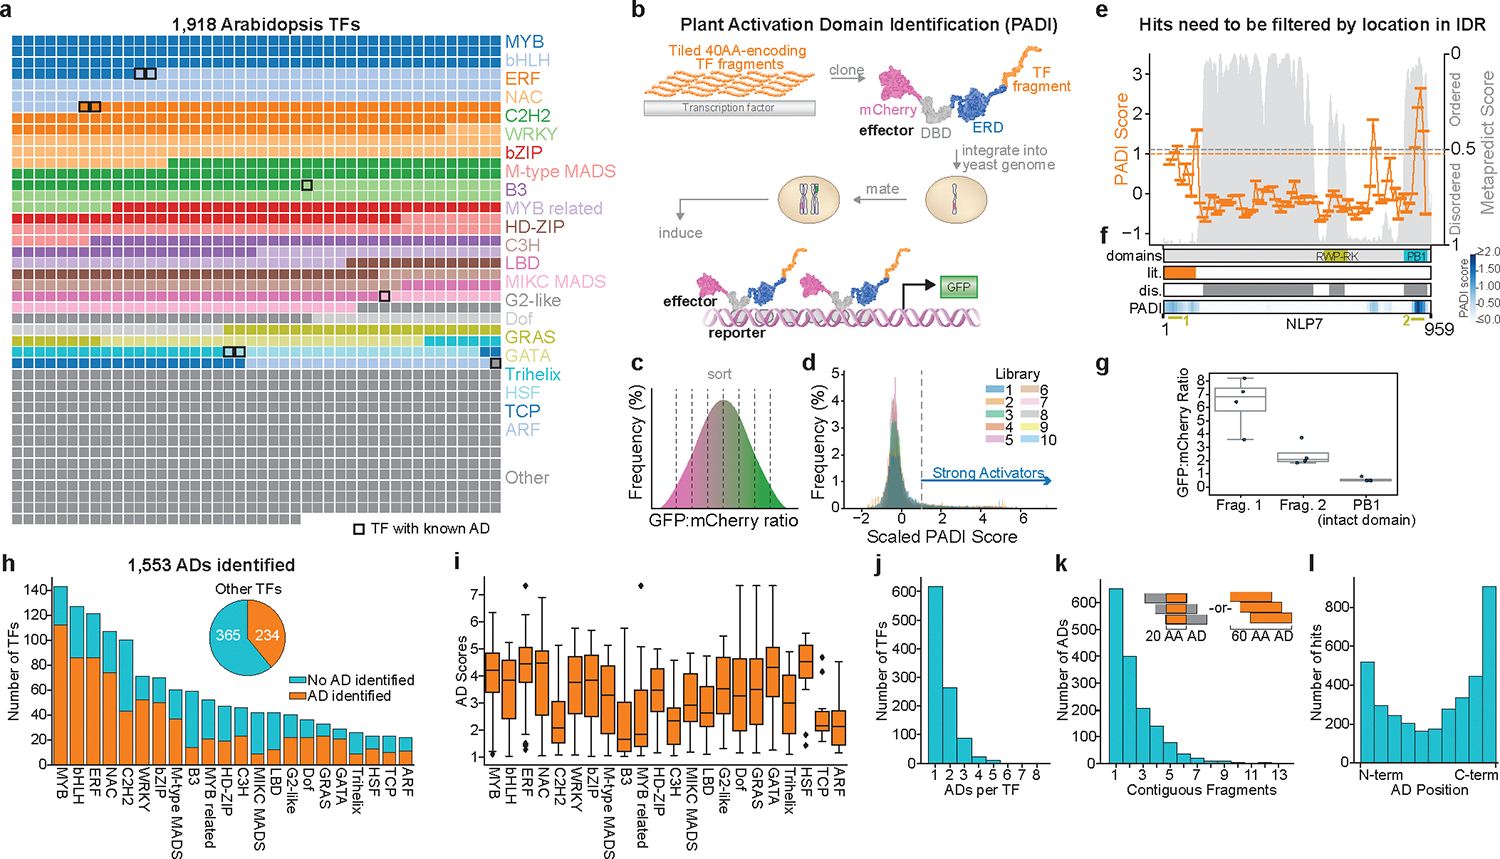
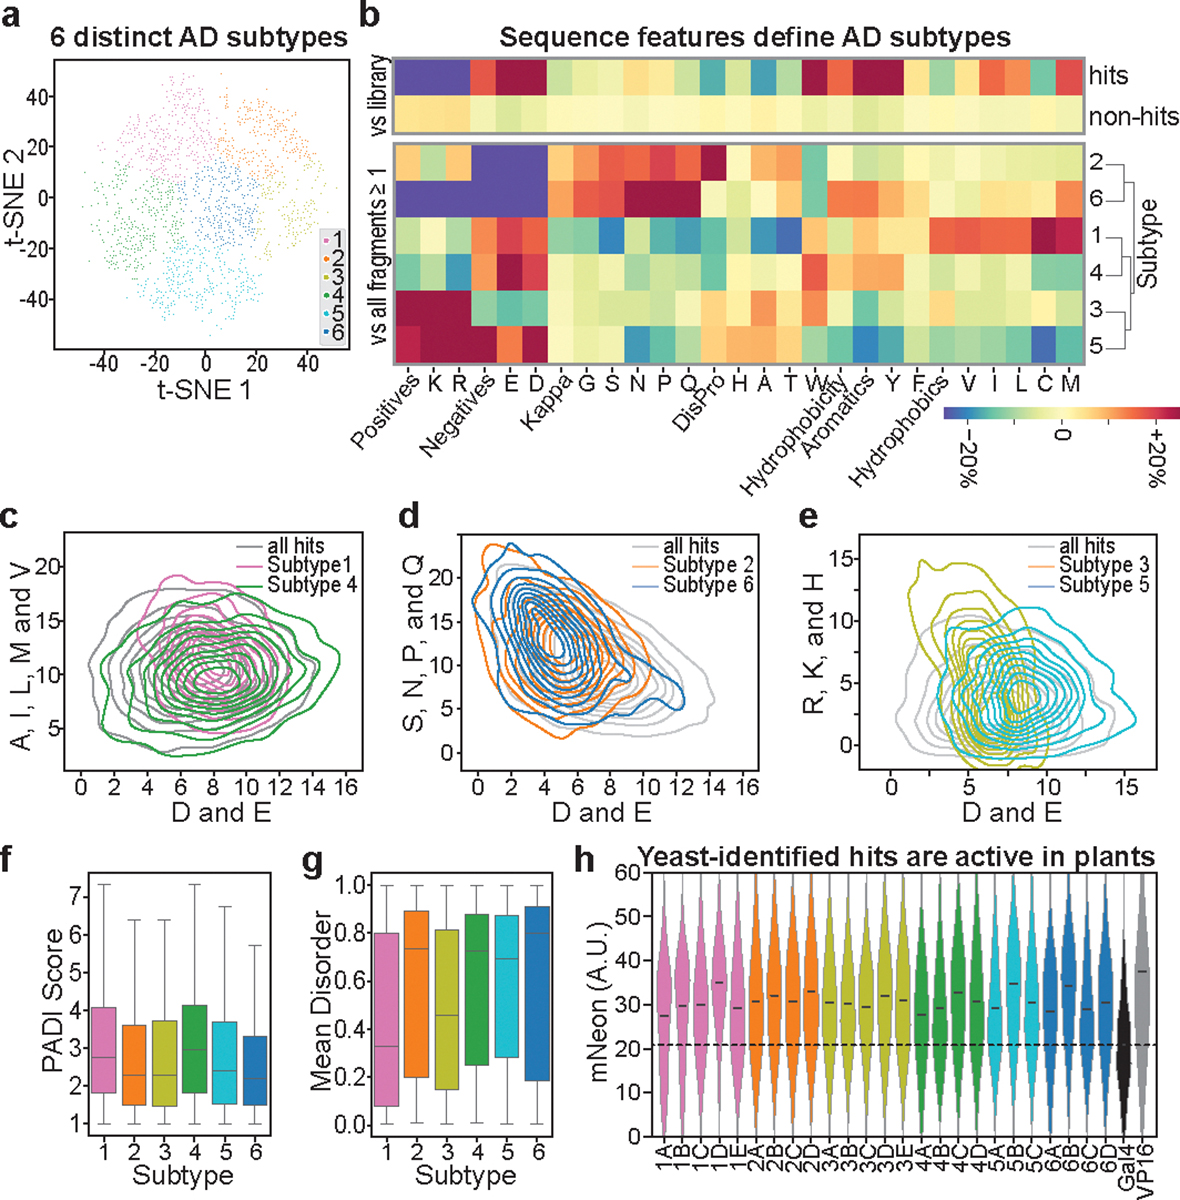
Gene expression in Arabidopsis is regulated by more than 1,900 transcription factors (TFs), which have been identified genome-wide by the presence of well-conserved DNA-binding domains. Activator TFs contain activation domains (ADs) that recruit coactivator complexes; however, for nearly all Arabidopsis TFs, we lack knowledge about the presence, location and transcriptional strength of their ADs1. To address this gap, here we use a yeast library approach to experimentally identify Arabidopsis ADs on a proteome-wide scale, and find that more than half of the Arabidopsis TFs contain an AD. We annotate 1,553 ADs, the vast majority of which are, to our knowledge, previously unknown. Using the dataset generated, we develop a neural network to accurately predict ADs and to identify sequence features that are necessary to recruit coactivator complexes. We uncover six distinct combinations of sequence features that result in activation activity, providing a framework to interrogate the subfunctionalization of ADs. Furthermore, we identify ADs in the ancient AUXIN RESPONSE FACTOR family of TFs, revealing that AD positioning is conserved in distinct clades. Our findings provide a deep resource for understanding transcriptional activation, a framework for examining function in intrinsically disordered regions and a predictive model of ADs.


Conflict of interest statement

Competing Interests

LCS is on the science advisory board of Prose Foods. RS is founder of Raleigh Biosciences. All other authors declare no competing interests.

Figures

Extended Data Fig. 1.
Extended Data Fig. 1.. PADI Workflow and Quality Control.
a, Extended depiction of the PADI assay. 1) DNA encoding 40 AA fragments are synthesized and 2) cloned into a synthetic TF backbone in bulk. 3) Confirmed synthetic TF libraries are cloned into the URA3 locus of DHY211 yeast cells and positive clones are selected by G418 and 5-FOA resistance. 4) Positively cloned yeast TF libraries are mated to the MY435 reporter strain . Positively mated clones are selected by G418 (library) and CloNAT (reporter) resistance. 5) Pooled mated libraries and controls are grown overnight and subcultured 1:5 with 1 μM beta-estradiol to induce synthetic TF localization to the nucleus. 6) After 4 hrs beta-estradiol treatment, mated yeast libraries are sorted into bins based on relative levels of GFP (reporter) to mCherry (synthetic TF) to determine AD activity. 7) Populations from each bin were grown overnight and sequenced to determine the distribution of tested fragments across bins. b and c, These plots show the correlation between PADI scores from all Arabidopsis TF libraries plotted against a pooled library where cells were sorted on median GFP (b) or mCherry (c) values. Each fragment was given a GFP or mCherry score based on the weighted mean of its appearance across all GFP or mCherry bins and then normalized using Z-score normalization consistent with how the PADI score was generated. The blue line represents the linear correlation of the data. There is a positive correlation between PADI score and GFP score, but not between PADI and mCherry scores. These results show that the PADI score is a robust measure of transcriptional activity regardless of the abundance of any transcription factor. d, Scatter plot showing the correlation between two sorts of PADI library 3. Replicate 1 is included in all analysis. The blue line represents the linear regression of the two datasets. The linear regression model has an r-value of 0.657. e, Violin plots showing the PADI scores of four positive AD controls (n=10 independent library experiments). The controls are found in all 10 PADI libraries and were consistently positive across libraries. The violin plot of Arabidopsis fragments (n=69,347 fragments from 10 libraries) is also provided as a comparison. Boxplots within the violin plot show the interquartile range and the median with whiskers that are 1.5 times the interquartile range. f, Boxplots showing the PADI scores of tested control fragments across the 10 PADI libraries. Each point is the PADI score of the tested fragment and the color of each point corresponds to the 10 PADI libraries (n=10 independent experiments). All boxplots show the interquartile range and the median. Whiskers are 1.5 times the interquartile range. g, Comparison of panels h-l from main text Fig 1. The data presented from figure 1h–l (top) (n=3,576) are presented above the same analysis conducted on all positive fragments regardless of mean disorder (bottom) (n=6,207). The trends hold between the filtered data (top) and unfiltered data (bottom). h, Distribution of identified activation domains across Arabidopsis transcription factor families. i, Distribution of highest scoring hits from each TF in each family. j, Distribution of the number of activation domains identified per Arabidopsis transcription factor. k, Distribution of number of contiguous hits identified per identified AD. Contiguous hits could be indicative of a short AD contained in neighboring fragments or of an extended AD for which a subset of residues is sufficient to activate transcription; our data cannot distinguish between these. l, The distribution of hit locations revealed a bias towards the amino and carboxy termini of proteins. All box plots represent the median and interquartile range. The whiskers are 1.5 times the interquartile range.
Extended Data Fig. 2.
Extended Data Fig. 2.. PADI hit characterization.
a-d, Boxplots showing the number of D+E (a) R+K+H (b) A+I+L+M+V (c) and S+N+P+Q (d) of each subtype (n≥625). Letters correspond to the statistical levels of each subtype based on the Tukey-kramer HSD metric with an alpha-level of 0.05. e, Scatter plot showing the correlation between the percentage of TFs with at least one AD (defined as a PADI score of greater than or equal to 1 and from an IDR) and the mean of the highest scoring AD from each TF in a family. The line represents the linear regression and the shaded area represent the 95% confidence interval. f, Boxplots showing the net charge of hits from each of the six AD subtypes (n≥625). g, Heatmap showing the distribution of Rg values against PADI score for all tested fragments (n=6,207). We used simulations to examine the radius of gyration (Rg), which is a measure of the volume that an IDR ensemble occupies. Rg is particularly relevant to the AD molecular mechanism, as exposure of interacting side chains is necessary for interaction with the transcriptional machinery. We found that the Rg of our identified ADs occupied a narrow range of radii, as compared to the tested library, raising the possibility that ADs must adopt sufficiently expanded conformations for activity. h, Boxplots showing the Rg values of each Subtype; Rg was similar across subtypes (n≥625). i, Table describing the PADI fragments tested in the Synthetic TFs in Fig. 3h. The fragment key, its Arabidopsis identifier, amino acid sequence, PADI score, and subtype are shown. j, Boxplots showing the distribution of PADI scores for each of the six subtypes. The stars represent the PADI score of the fragments tested for activity in Fig. 3h and shown in Extended Data Fig. 2i. The tested fragments span the range of PADI scores found in the six subtypes (n≥625). Stars depict the PADI scores of selected hits for testing in protoplasts. k, Protein accumulation of Synthetic TFs from Fig. 3h. Violin plots show the mScarlet-TF values of cells. The black lines mark the mean mScarlet-TF value of each sample (n≥529 cells from 3 independent transfections). l, Protein accumulation of FrankenARF TFs from Fig. 4e. Violin plots show the mNEON-TF values of cells. The black lines mark the mean mNEON-TF value of each sample (n≥2,212 cells from 4 independent transfections). All cells collected for reporter expression were gated on the presence of TF signal when compared to blank cells. Only positive cells were used to collect output data presented in Figs. 3h and 4e. m, Gating strategy for examination of activation domain activity in protoplasts. Cells were gated based on size and mScarlet (for presence of TF) signal as depicted. Untransfected cells did not display signal above the threshold for mScarlet (left) whereas control cells transfected with the TF lacking an AD (middle) and cells transfected with the TF carrying VP16 (right) were selected for assessment of mNeonGreen (transcriptional output). All box plots represent the median and interquartile range. The whiskers are 1.5 times the interquartile range.
Extended Data Fig. 3.
Extended Data Fig. 3.. Classification performance of TADA and feature impact on TADA’s prediction performance.
a, The loss of TADA during training and validation. b, TADA’s performance in terms of precision, recall, area under the receiver operating curve (AUC), accuracy, area under the precision recall curve (AUPR), and F1-score. TADA was trained three distinct times using random peptides , PADI (referred to as “plant TFs”), and random peptides and PADI combined. c, TADA outperforms all published AD predictors. We compared the performance TADA with three published activation domain predictors (ADpred, PADDLE and a composition model ,,. We used a hand-curated list of 599 activation domains from 451 human TFs. For each TF, we predicted ADs and considered predictions that overlapped a known annotation by > 10AA to be true positive, using each predictor. TADA made the most predictions, had the highest Sensitivity, and highest F1-score. d, Z-score normalized SHAP values leading to the selection of 8 features with a z-score above 1. e, Normalized SHAP values ranked from overall most important to least important for fragments scoring above 1. e for each of the 6 identified AD subclasses.
Extended Data Fig. 4.
Extended Data Fig. 4.. AD Subtypes by TF family.
A heat map showing the percentage of hits (defined as a PADI score ≥ 1) from each subtype found in each family in Arabidopsis.
Extended Data Fig. 5.
Extended Data Fig. 5.. Comparison of PADI hits to previous activators and distribution of hits across the middle regions of Clade A ARF subclades.
a, Hummel et al. identified ADs in sixty-eight Arabidopsis TFs that could elicit a transcriptional response when transiently expressed in intact tobacco leaves. We identified fragments that could activate transcription in yeast from fifty-six (82%) of the sixty-eight TFs factors identified by Hummel et al. We did not identify fragments that could elicit yeast-based transcription from nine TFs in which Hummel et al. demonstrated transcriptional activity. An additional three TFs were untested in the PADI dataset. It is possible that for the 9 TFs for which Hummel et al. found activation activity and in which we did not identify a hit in our PADI screen that either 1) they contain ADs that are active in plant cells but not in yeast or 2) the nearly intact TFs used by Hummel et al. recruited other co-activators in their system (for example native TFs that contain an AD). b-e,Orange regions were used to define AD regions for alignment in Extended Data Figs. 7–8.
Extended Data Fig. 6.
Extended Data Fig. 6.. Phylogeny of examined ARFs.
The maximum-likelihood tree was generated using MAFFT alignments of the conserved ARF DNA-binding domain. Major ARF clades (bright blue, orange, and green) and sub-clades (light blue, orange and green) are annotated. These annotations were used for categorizing sequences in Figure 4.
Extended Data Fig. 7.
Extended Data Fig. 7.. ARF7 and ARF5 sub-clade AD alignments.
The highest scoring fragment from each tested ARF within the defined ARF7 and ARF5 AD regions (orange bars in Fig S5b,d) were used to generate alignments with MAFFT. Alignments were visualized with the ESPript 3.0 webserver. Boxes indicate regions where 50% of amino acid residues share sequence similarity based on biochemical properties. Bolded residues are the amino acids with shared properties within the region. Black boxes represent sequence conservation.
Extended Data Fig. 8.
Extended Data Fig. 8.. ARF 6 and ARF8 sub-clade AD Alignments.
The highest scoring fragment from each tested ARF within the defined AD regions (orange bars in Fig S5c,e) were used to generate alignments with MAFFT. Alignments were visualized with the ESPript 3.0 webserver. Boxes indicate regions where 50% of amino acid residues share sequence similarity based on biochemical properties. Bolded residues are the amino acids with shared properties within the region. Black boxes represent sequence conservation.
Extended Data Fig. 9.
Extended Data Fig. 9.. MYB Family Activation Domains and prediction performance of TADA on the ARF evolution dataset.
a, Histogram of all AD hits (defined as a PADI score of greater than or equal to 1 and from an IDR) from the MYB family. Each bar represents the number of ADs found in each 5% interval of the protein length. These results show that MYB ADs are enriched in the final 15% of tested TFs. b, Representative gating strategy for all PADI libraries. Yeast cells were gated based on size to exclude doublets (R1 and R3). Single cells were then gated to exclude those with mCherry signal below background (R4) when compared to mCherry negative cells. The mCherry positive cells were then binned and sorted into twelve populations based on the GFP:mCherry ratio. c,Prediction performance of TADA, and the TADAΔARF variation. TADA performance on the PADI data test set and the ARF evolution dataset in terms of precision, recall, area under the receiver operating curve (AUC), accuracy, area under the precision recall curve (AUPR), and F1-score. We further validated the generalization of TADA by retraining TADA on the original training dataset but withholding the ARF sequences (2,046 of the 70,937 sequences), which we called TADAΔARF. This approach prevents TADA from memorizing/overfitting ARF sequences. d, Prediction performance of TADA, PADDLE, ADPred, and the composition model in terms of area under the receiver operating curve (roc_auc), area under the precision recall curve (pr_auc), accuracy, F1-score, true positive rate (tpr), false positive rate (fpr), precision, and recall when tested on the ARF evolution dataset. Because each of these predictors subdivides sequences differently and used different fragment lengths for training, we compared their performance on full-length protein sequence from the evolution dataset.
Extended Data Fig. 10.
Extended Data Fig. 10.. Arabidopsis transcription factors with identified activation domains.
Waffle plots of the 1,918 Arabidopsis transcription factors analyzed. Those with previously identified activations domains are marked with a black box in the left waffle plot. The right waffle plot depicts those with activating fragments identified by PADI.
Fig. 1.
Fig. 1.. High-throughput tiling of Arabidopsis transcription factors uncovers thousands of activation domains.
a, Waffle plot of the 1,918 Arabidopsis transcription factors analyzed; those with previously identified activations domains are marked with a black box. b, Schematic of PADI. Ten pooled libraries of synthetic transcription factors were integrated into the yeast URA3 locus prior to mating to yeast carrying a 5xUAS reporter. c, After induction, cells were flow sorted into bins based on GFP:mCherry ratio to assess transcriptional output. d, A scaled activation domain (PADI) score; a PADI score of ≥1 (one standard deviation from the mean) were considered strong activators. e, PADI (orange) and predicted disorder (white) scores for NLP7 show regions strong activity in disordered regions as well as ordered regions that overlap with the know PB1 domain. The orange (PADI = 1) and gray (Metapredict score = 0.5) dashed lines are considered cutoffs for activation and disorder, respectively. f, Schematic of NLP7 protein domains from top to bottom, ordered domains (Uniprot Q84TH9, olive and teal), previously annotated as containing activation domain activity (orange), the predicted disorder (gray), and PADI scores (blue). g, 40 AA fragments (underlined in f) or intact PB1 domain (teal in f) were tested for activation activity using a modified version of the PADI assay (n=4 independent experiments). h, Distribution of identified activation domains across Arabidopsis transcription factor families (n≥22). i, Distribution of highest scoring hits from each TF in each family (n≥11). j, Distribution of the number of activation domains identified per Arabidopsis transcription factor. k, Distribution of number of contiguous hits identified per identified AD. Contiguous hits could be indicative of a short AD contained in neighboring fragments or of an extended AD for which a subset of residues is sufficient to activate transcription; our data cannot distinguish between these. l, The distribution of hit locations revealed a bias towards the amino and carboxy termini of proteins. The data reported in Fig. 1h–l has been filtered for hits that are present in IDR regions of the parent transcription factor. Unfiltered data can be found in Extended Data Fig. 1g. All boxplots show the interquartile range and the median. Whiskers are 1.5 times the interquartile range.
Fig. 2.
Fig. 2.. AD sequence features leveraged to create a predictive model.
a, Scatter plot showing distribution of net charge and number of Trp, Leu, Phe, and Tyr residues in the library (left) and hits (right). The size of each point represents the number of fragments at each coordinate and the color corresponds to the mean PADI score fragments at that coordinate. b, Box and whisker plots showing the distribution of PADI scores for fragments based on the number of Asp, Glu, Trp, Phe, Tyr, and Leu residues per fragment. Boxes represent interquartile range with the median drawn within the box. Whiskers are 1.5x the interquartile range (n=1– 44,633 fragments). c, TADA architecture and 42 descriptors, including counts of side chain class, counts of amino acid occurrence, attributes calculated by LocalCIDER , and secondary structure prediction by Metapredict . From these 42 descriptors, TADA uses two CNNs, and attention layer, two sequential BiLSTM layers and a dense layer to classify sequences. d, TADA score across PADI hits. Using TADA to predict hits from the PADI dataset suggests that a TADA cutoff score of 0.4 will capture most fragments that activate transcription. e, SHAP values averaged across the 26 subsequences for each input feature, as calculated for the test dataset classified as fragments scoring above 1. Features derived by counting number of residues by side chain property (blue), derived from LocalCIDER (green) and the Metapredict 14-based secondary structure score (olive) are shown. f, Normalized SHAP values ranked from most important to least important for fragments scoring above 1. The top 8 features plotted as having a positive or negative impact on prediction (insert). Features derived by counting number of residues by side chain property (blue), derived from LocalCIDER (green) and the Metapredict 14-based secondary structure score (olive) are shown.
Fig. 3.
Fig. 3.. AD subtypes display distinct compositional biases.
a, The ADs were divided into 6 subtypes based on k-means clustering of the 2D t-SNE output. T-SNE was performed on a 10-component PCA of the 8 most important features and their SHAP values. b, Comparative analysis of fragment composition of AD versus non-AD fragments in relation to the library as a whole (top). Comparative analysis of fragment composition of each AD subtype in relation to all AD fragments (scoring above 1) (bottom). c-e, Distribution of subtypes in feature space against all hits (gray) for c) Subtypes 1 and 4, d) Subtypes 2 and 6, e) and Subtypes 3 and 5 based on enrichment of depicted amino acids. f, PADI score by subtype (n≥625). g, Mean disorder by subtype (n≥625). h, All examined yeast-identified hits promote transcription in plant cells. Protoplasts were transfected with a synthetic TF containing an N-terminal mScarlet-I tag, the Gal4 DBD, and the identified 40-AA PADI hit, or just the Gal4 DBD (Gal4). The cells were also transfected with a reporter of NLS-mNeonGreen driven by 5x Gal4 UAS. The mNEON reporter was assayed in mScarlet-positive cells using flow cytometry. Violin plots depict mNEON signal in arbitrary units (A.U.) with the mean mNEON signal depicted as a black bar. All examined hits were significantly different from the control (Student’s t-test; p≤0.0001) (n≥520 cells from 3 independent transfections). All boxplots show the interquartile range and the median. Whiskers are 1.5 times the interquartile range.
Fig. 4.
Fig. 4.. Validation of identified activation domains.
a, Schematic of WRKY50 , DREB1A , AP1 , DREB2A , AtHSFA2 , HtHSFA6b , PIF3 , MYC3 , and NLP7 protein domains previously annotated as containing activation domain activity (orange), TADA scores (pink), PADI scores (blue), the predicted disorder (white). b, Schematic of ARF8, ARF5, ARF6, and ARF7 protein domains previously annotated as containing activation domain activity (orange), TADA scores (pink), PADI scores (blue), the predicted disorder (white). The two identified ADs in the ARF7 middle region are annotated as AD1 and AD2. c, ARF7 AD1 and AD2 variants alter transcriptional output. AD sequences were modified as indicated and tested in the PADI assay. d, Deletion of ARF7 AD1 or AD2 results in decreased ARF7 output in a reconstructed yeast system. pIAA19:mScarlet-I reporter fluorescence was measured by flow cytometry with the results depicted as median values of 3 transformants and 3 replicate experiments (20,000 cells per replicate) with underlayed box plots. Boxplots show the interquartile range and the median. Whiskers are 1.5 times the interquartile range. e, Deletion of ARF7 AD1 or AD2 results in decreased ARF7 output in plant cells. Protoplasts were transfected with a synthetic TF containing an N-terminal mNEON tag, the Gal4 DBD, and the middle region and C-terminus of ARF7 with or without the identified ADs (FrARF7, ΔAD1 ΔAD2, and ΔAD1 ΔAD2) or just the Gal4 DBD (Gal4), along with an mScarlet-I fused to the Histone 2B (H2B) reporter driven by 5x Gal4 UAS. The mScarlet reporter was assayed in mNEON positive cells using flow cytometry. Violin plots depict mScarlet signal in A.U. with black bars marking the average mScarlet signal (n≥2,212 cells from 4 independent transfections). Letters are statistically significant groupings based on Tukey-HSD with an alpha-level of .01.
Fig. 5.
Fig. 5.. Position of ARF activations domains has remained constant over evolutionary time.
a, Arabidopsis Class A ARFs are enriched in activation domains. b, Flowering plant species examined in ARF evolution library. c, A breakdown of the number of ARFs with at least one AD region (orange), putative RD (blue), AD and putative RD (gray), and neither AD or RD (teal) in each of the three clades and the maximum PADI score found in each of the tested ARFs that scored above the threshold. RDs were identified by searching for the following motifs in the ARF fragments: LxLxL, [R/K]LFG[F/I/V], DLNxxP, and LxLxPP ,. d, Heatmaps showing the average PADI score and TADA prediction scores of ARF middle region fragments from different Clade A subclades. Each column is 5% of the length of the tested ARF middle region and each row is one examined ARF. When multiple fragments reside within a column, the color will represent the mean PADI score (blue) or TADA prediction (pink) of all fragments within that window.

References

    1. Strader L, Weijers D & Wagner D Plant transcription factors - being in the right place with the right company. Curr Opin Plant Biol 65, 102136 (2022). - PMC - PubMed
    1. O’Malley RC et al. Cistrome and Epicistrome Features Shape the Regulatory DNA Landscape. Cell 166, 1598 (2016). - PubMed
    1. Galli M et al. The DNA binding landscape of the maize AUXIN RESPONSE FACTOR family. Nat Commun 9, 4526 (2018). - PMC - PubMed
    1. Sanborn AL et al. Simple biochemical features underlie transcriptional activation domain diversity and dynamic, fuzzy binding to Mediator. Elife 10 (2021). - PMC - PubMed
    1. Dyson HJ & Wright PE Role of Intrinsic Protein Disorder in the Function and Interactions of the Transcriptional Coactivators CREB-binding Protein (CBP) and p300. J Biol Chem 291, 6714–6722 (2016). - PMC - PubMed

Reference List for Methods

    1. Boer DR et al. Structural Basis for DNA Binding Specificity by the Auxin-Dependent ARF Transcription Factors. Cell 156, 577–589 (2014). - PubMed
    1. Korasick DA et al. Molecular basis for AUXIN RESPONSE FACTOR protein interaction and the control of auxin response repression. Proc Natl Acad Sci U S A 111, 5427–5432 (2014). - PMC - PubMed
    1. Havens KA et al. A synthetic approach reveals extensive tunability of auxin signaling. Plant Physiol 160, 135–142 (2012). - PMC - PubMed
    1. Hillson NJ, Rosengarten RD & Keasling JD j5 DNA assembly design automation software. ACS Synth Biol 1, 14–21 (2012). - PubMed
    1. Garcia-Nafria J, Watson JF & Greger IH IVA cloning: A single-tube universal cloning system exploiting bacterial In Vivo Assembly. Sci Rep 6, 27459 (2016). - PMC - PubMed

MeSH terms