. 2024 Jul 17;7(1):869.
doi: 10.1038/s42003-024-06404-1.

Electrokinetic convection-enhanced delivery for infusion into the brain from a hydrogel reservoir

Affiliations

Electrokinetic convection-enhanced delivery for infusion into the brain from a hydrogel reservoir

Jesus G Cruz-Garza et al. Commun Biol. .

Abstract

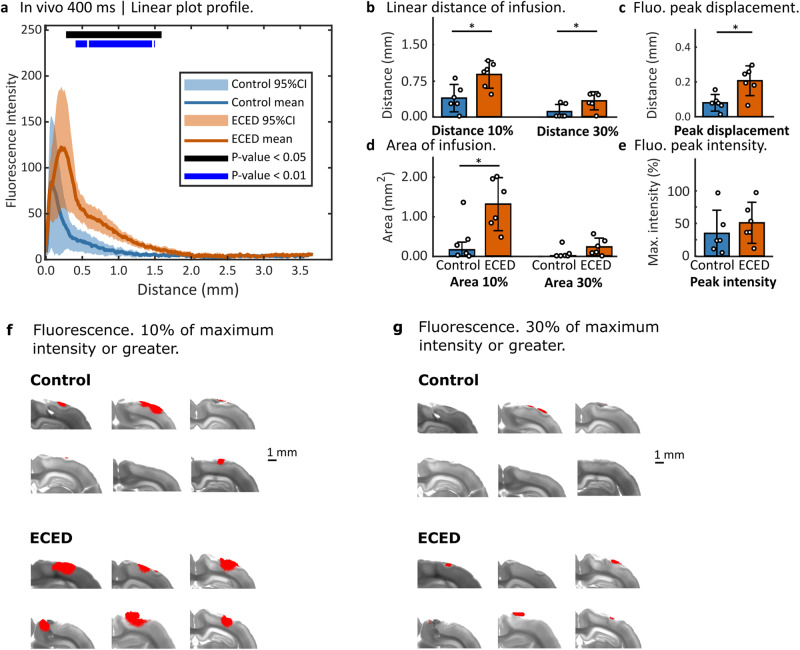
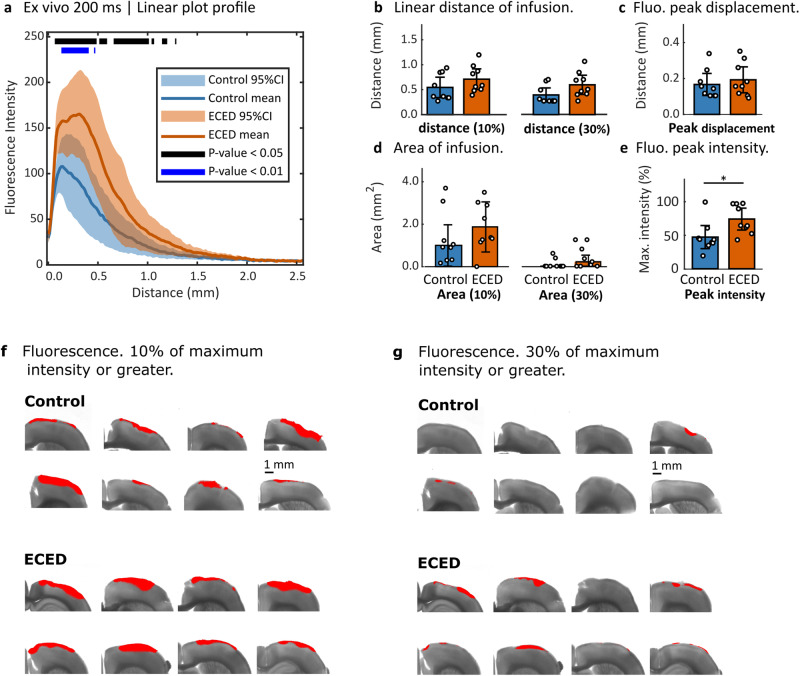
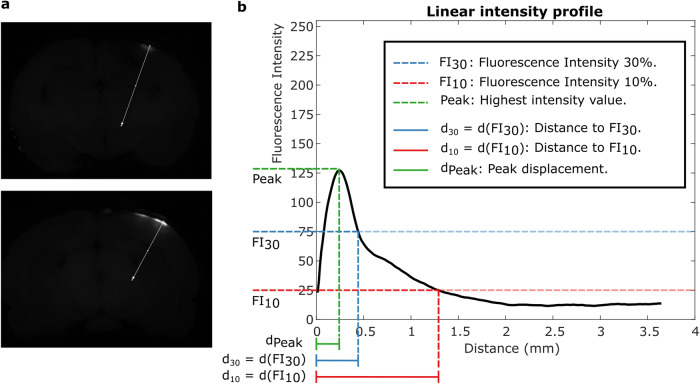
Electrokinetic convection-enhanced delivery (ECED) utilizes an external electric field to drive the delivery of molecules and bioactive substances to local regions of the brain through electroosmosis and electrophoresis, without the need for an applied pressure. We characterize the implementation of ECED to direct a neutrally charged fluorophore (3 kDa) from a doped biocompatible acrylic acid/acrylamide hydrogel placed on the cortical surface. We compare fluorophore infusion profiles using ECED (time = 30 min, current = 50 µA) and diffusion-only control trials, for ex vivo (N = 18) and in vivo (N = 12) experiments. The linear intensity profile of infusion to the brain is significantly higher in ECED compared to control trials, both for in vivo and ex vivo. The linear distance of infusion, area of infusion, and the displacement of peak fluorescence intensity along the direction of infusion in ECED trials compared to control trials are significantly larger for in vivo trials, but not for ex vivo trials. These results demonstrate the effectiveness of ECED to direct a solute from a surface hydrogel towards inside the brain parenchyma based predominantly on the electroosmotic vector.


Conflict of interest statement

A.H.F. is an inventor in a patent for electroosmotic delivery assigned to University of Pittsburgh — of the Commonwealth System of Higher Education, Pittsburgh, PA (US). US Patent 11,471,674. Electroosmotic delivery was implemented in this study for fluorophore delivery to the brain. All other authors declare no competing interests.

Figures

Fig. 1
Fig. 1. Schematic of experimental setup for ECED transport.
a Ex vivo brain placed over a microscope slide under the stereoscope. b Configuration of hydrogel placement, capillary insertion, and schematic representation of the expected fluorophore infusion inside the brain. c Experimental conditions of diffusion-only control and ECED, with a representative example from each, created by merging a brightfield image with the fluorescent image. d In vivo subject placed on the stereotaxic device, showing a single craniotomy where the hydrogel and capillary were placed. e Detailed configuration of hydrogel and capillary placement in coronal view, with a schematic representation of the expected fluorophore infusion inside the brain. f Experimental conditions of diffusion-only control and ECED, with a representative example for each.
Fig. 2
Fig. 2. In vivo results at 400 ms exposure time, N = 12 biologically independent subjects.
a Mean and 95% confidence intervals (CI) of the plot profiles that measure the fluorescence intensity of the fluorophore infusion from the surface of the brain, identified in the plots as distance = 0.00 mm, perpendicularly towards inside the brain. b Distribution of fluorophore infusion distance, measured from the surface of the brain to the point where the fluorescence intensity reached 10% of the maximum intensity (d10) and 30% of the maximum intensity (d30). c Displacement from the surface of the brain, for the highest value of fluorescence intensity in each trial. d Area covered by fluorophore infusion, at a threshold of 10% of the maximum intensity (A10) and 30% of the maximum intensity (A30). e Fluorescence peak intensity value in each trial, as a percentage of the highest peak in all trials. The bar graph indicates the mean, and the error bars correspond to the 95% CI. e Fluorescence peak intensity value in each trial, as a percentage of the highest peak in all trials. f Fluorescence images overlaid upon brightfield images for the brain slice selected for analysis, with the intensity threshold set at 10%, and g the intensity threshold set at 30% of maximum intensity. Significant differences are indicated by ** for p < 0.01, and * for p < 0.05.
Fig. 3
Fig. 3. Ex vivo results at 200 ms exposure time, N = 18 biologically independent subjects.
a Mean and 95% confidence intervals (CI) of the plot profiles that measure the fluorescence intensity of the fluorophore infusion from the surface of the brain, identified in the plots as distance = 0.00 mm, perpendicularly towards inside the brain. b Distribution of fluorophore infusion distance, measured from the surface of the brain to the point where the fluorescence intensity reached 10% of the maximum intensity (d10) and 30% of the maximum intensity (d30). c Displacement from the surface of the brain, for the highest value of fluorescence intensity in each trial. d Area covered by fluorophore infusion, at a threshold of 10% of the maximum intensity (A10) and 30% of the maximum intensity (A30). e Fluorescence peak intensity value in each trial, as a percentage of the highest peak in all trials. The bar graph indicates the mean, and the error bars correspond to the 95% CI. f Fluorescence images overlaid upon brightfield images for the brain slice selected for analysis, with the intensity threshold set at 10%, and g the intensity threshold set at 30% of maximum intensity. Significant differences are indicated by ** for p < 0.01, and * for p < 0.05.
Fig. 4
Fig. 4. Schematic visualization of the plot profile evaluation metrics for ECED-based infusion of molecules into the brain.
a Two separate examples of linear trajectories selected for evaluation. b Smoothed plot profile of one experimental trial, with the outcome variables of interest: Peak displacement dPeak, distance to 30% of the maximum intensity d30, distance to 10% of the maximum intensity d10.

References

    1. Alam MI, et al. Strategy for effective brain drug delivery. Eur. J. Pharm. Sci. 2010;40:385–403. doi: 10.1016/j.ejps.2010.05.003. - DOI - PubMed
    1. Faraji AH, Rajendran S, Jaquins-Gerstl AS, Hayes HJ, Richardson RM. Convection-enhanced delivery and principles of extracellular transport in the brain. World Neurosurg. 2021;151:163–171. doi: 10.1016/j.wneu.2021.05.050. - DOI - PubMed
    1. Wang Y, Bastiancich C, Newland B. Injectable local drug delivery systems for glioblastoma: a systematic review and meta-analysis of progress to date. Biomater. Sci. 2023;11:1553–1566. doi: 10.1039/D2BM01534J. - DOI - PubMed
    1. Pardridge WM. The blood-brain barrier: bottleneck in brain drug development. NeuroRx. 2005;2:3–14. doi: 10.1602/neurorx.2.1.3. - DOI - PMC - PubMed
    1. Hersh DS, et al. Evolving drug delivery strategies to overcome the blood brain barrier. Curr. Pharm. Des. 2016;22:1177–1193. doi: 10.2174/1381612822666151221150733. - DOI - PMC - PubMed

Publication types

LinkOut - more resources