Comparative Study
. 2024 Nov;229(8):1943-1977.
doi: 10.1007/s00429-024-02823-2. Epub 2024 Jul 17.

Comparative analysis of the chimpanzee and human brain superficial structural connectivities

Affiliations
Comparative Study

Comparative analysis of the chimpanzee and human brain superficial structural connectivities

Maëlig Chauvel et al. Brain Struct Funct. 2024 Nov.

Abstract

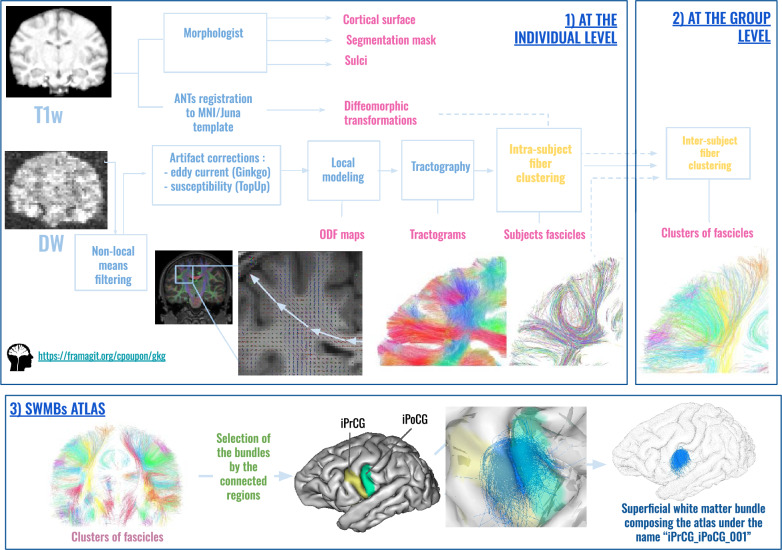
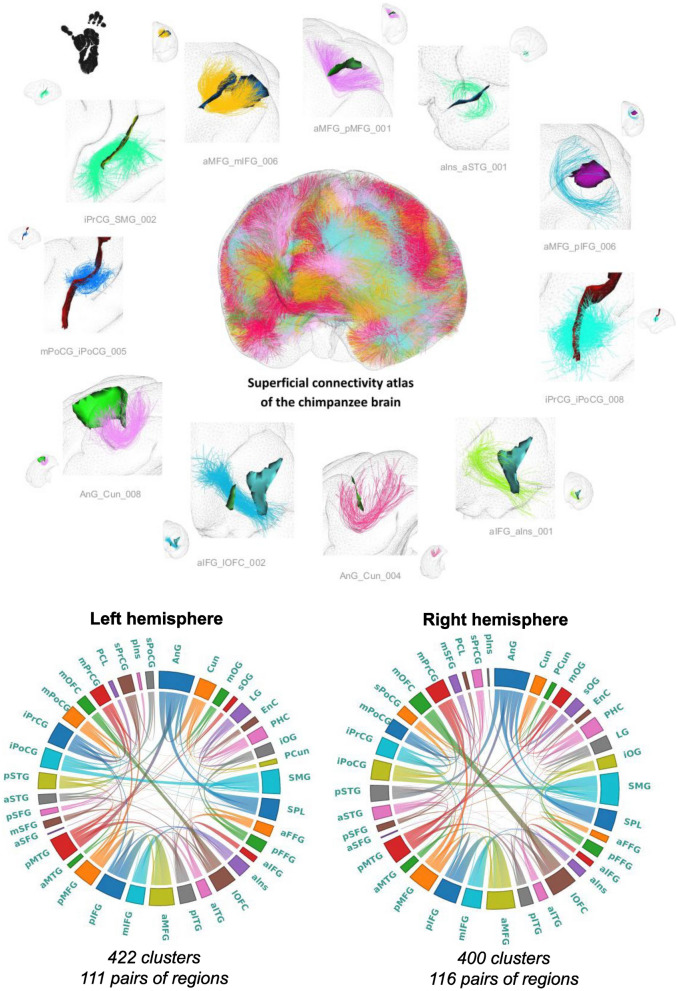
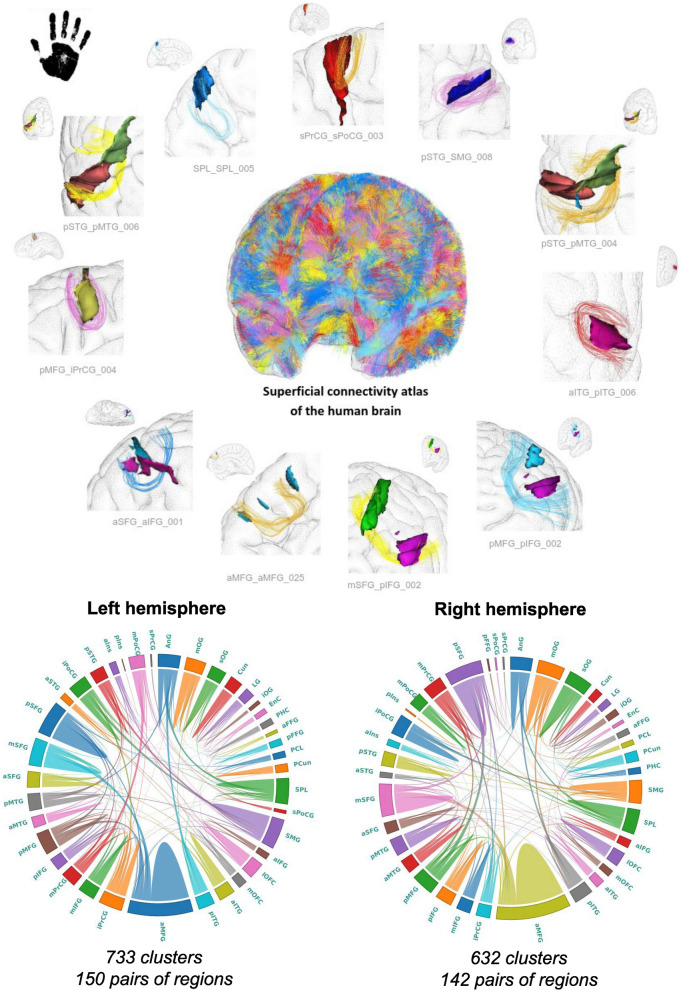
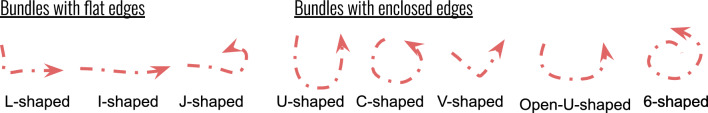
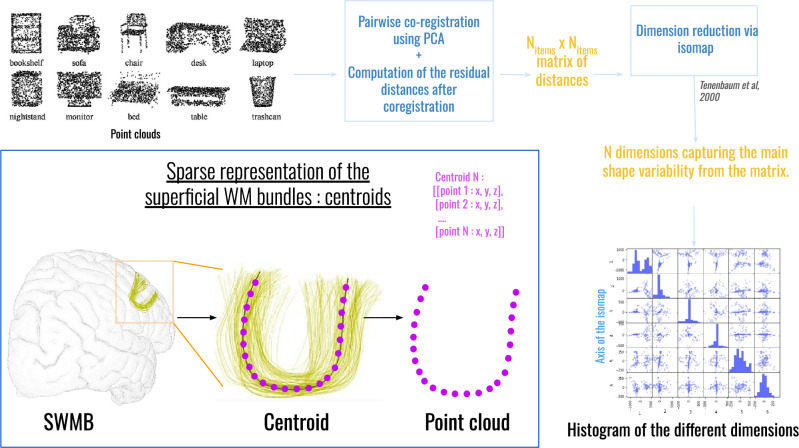
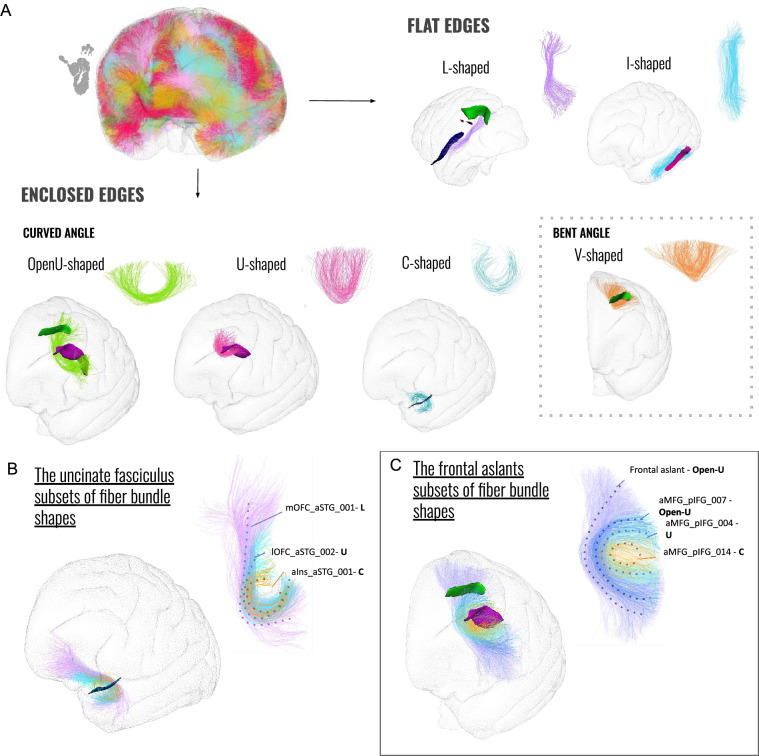
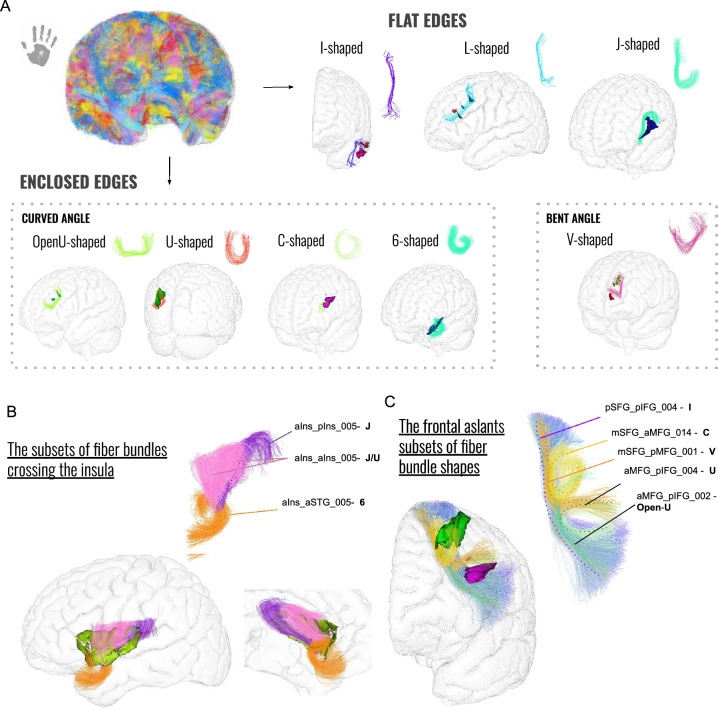
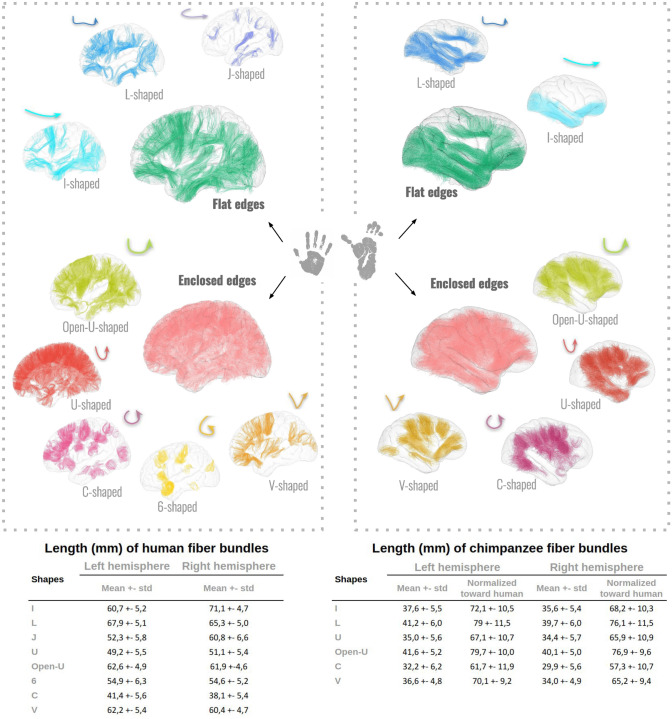
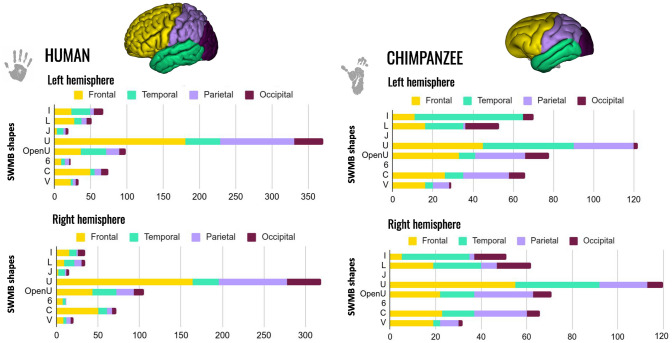
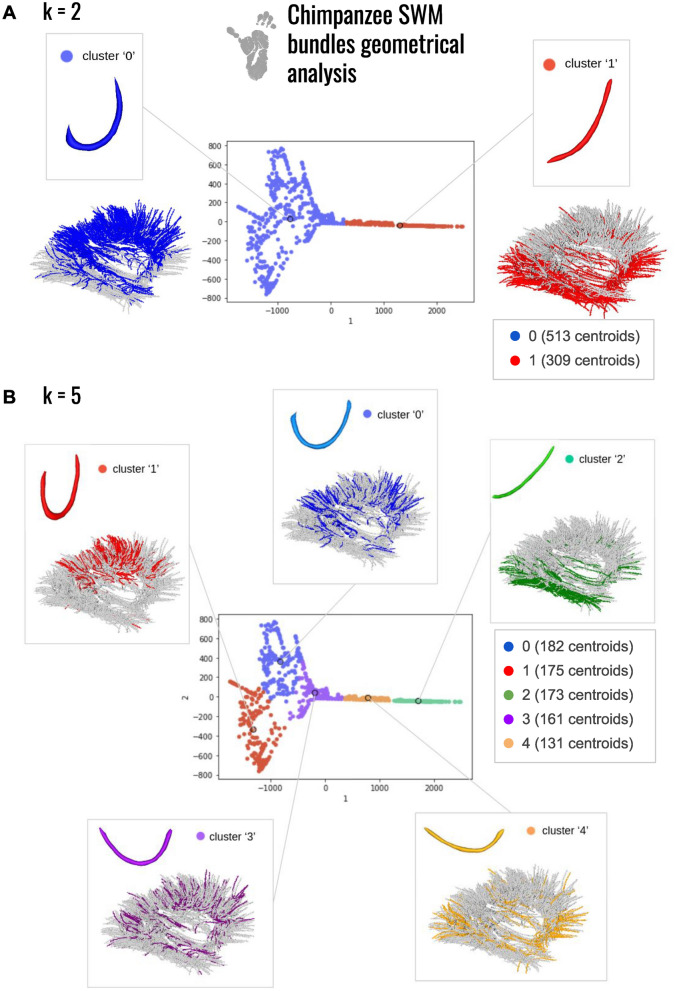
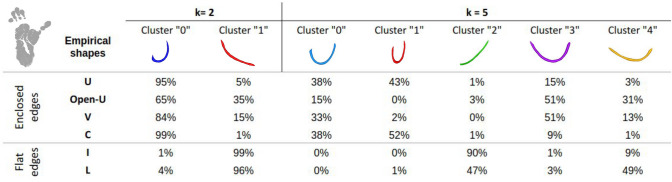
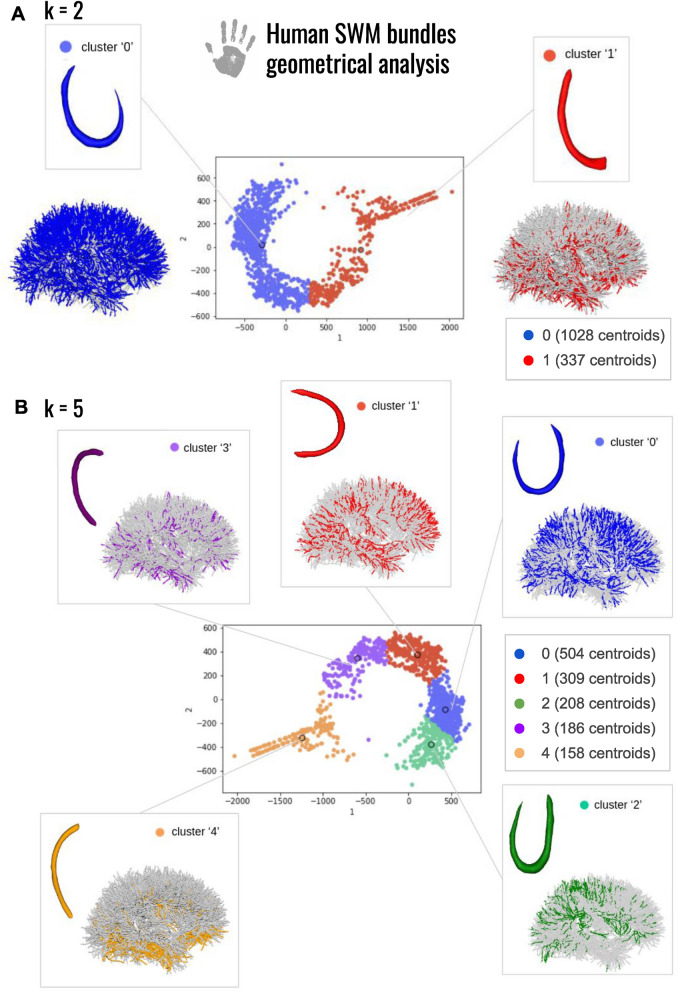
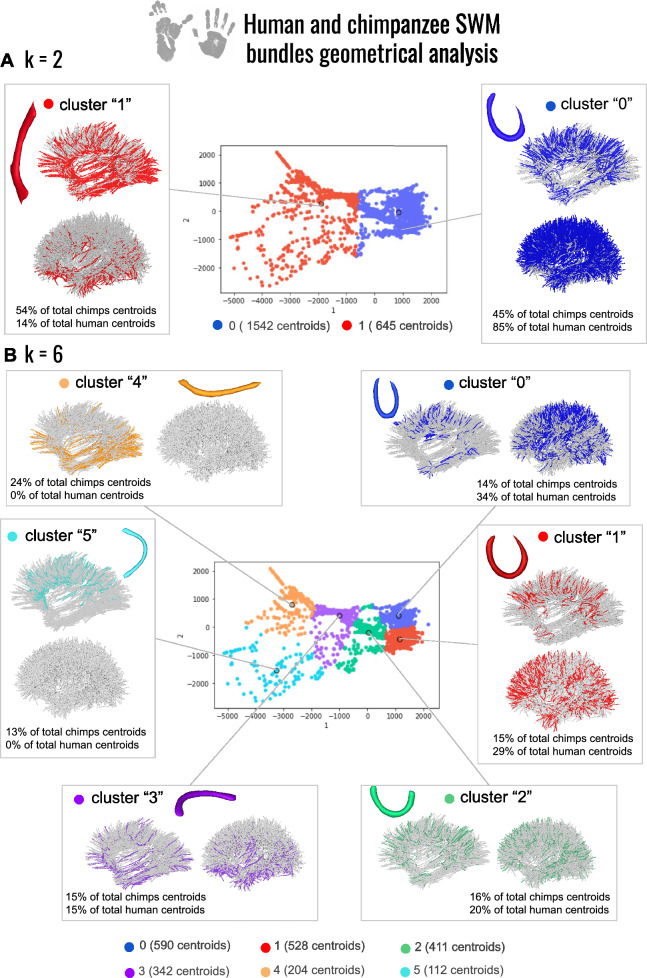
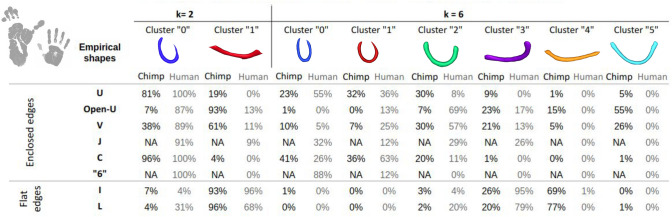
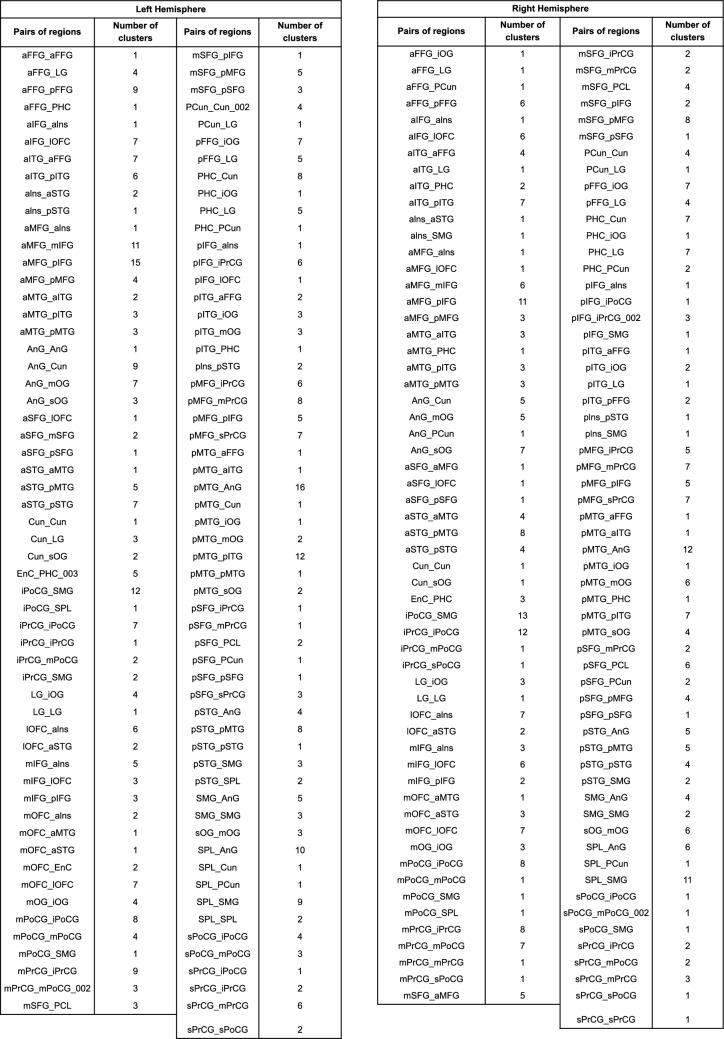
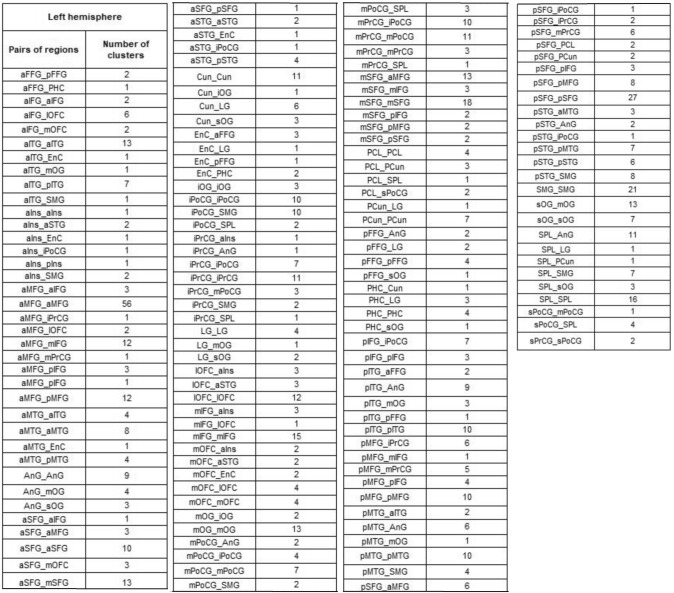
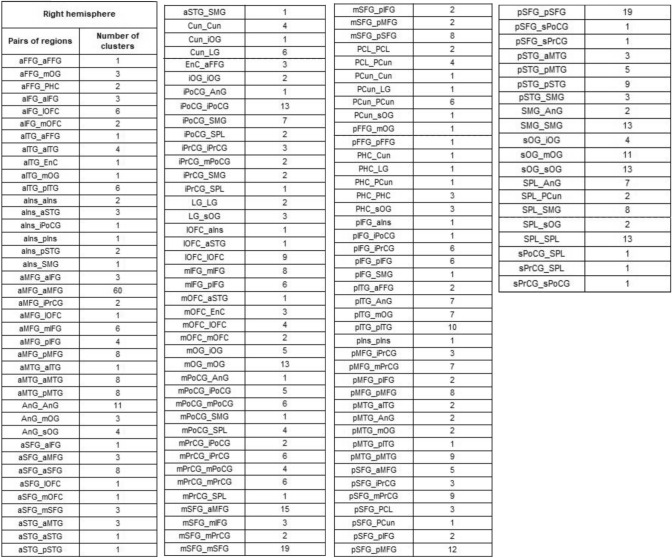
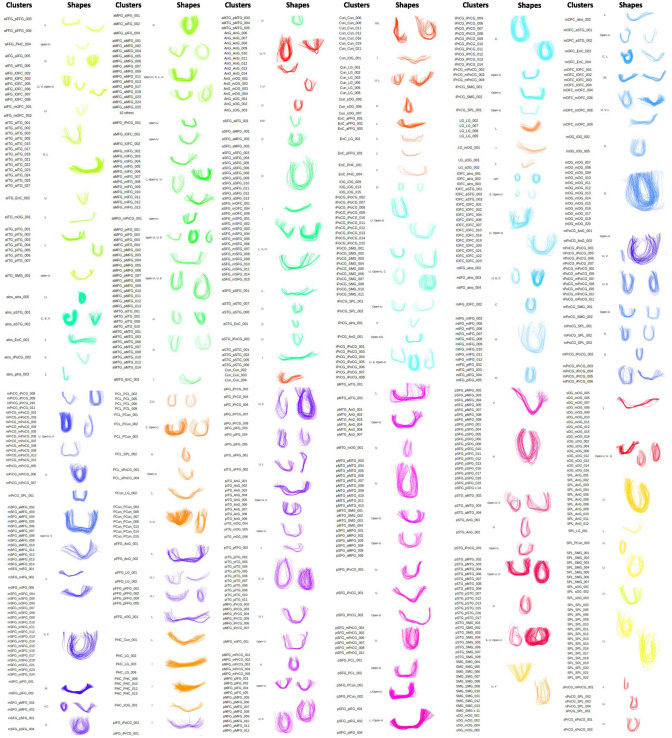
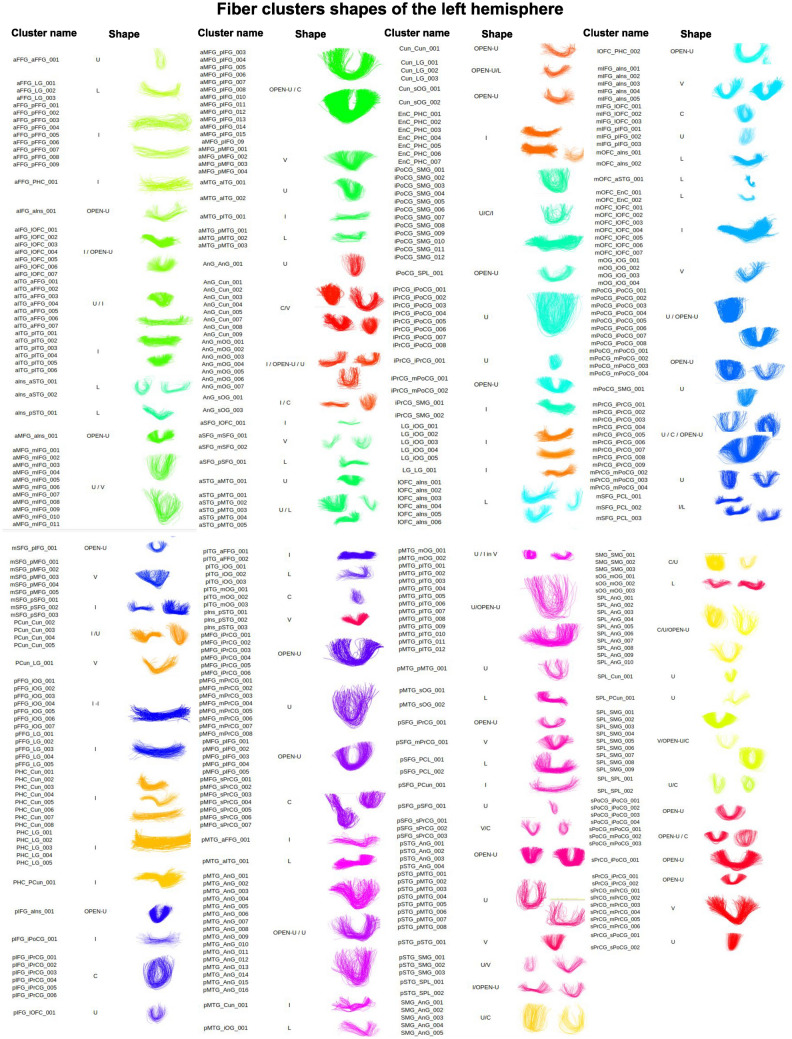
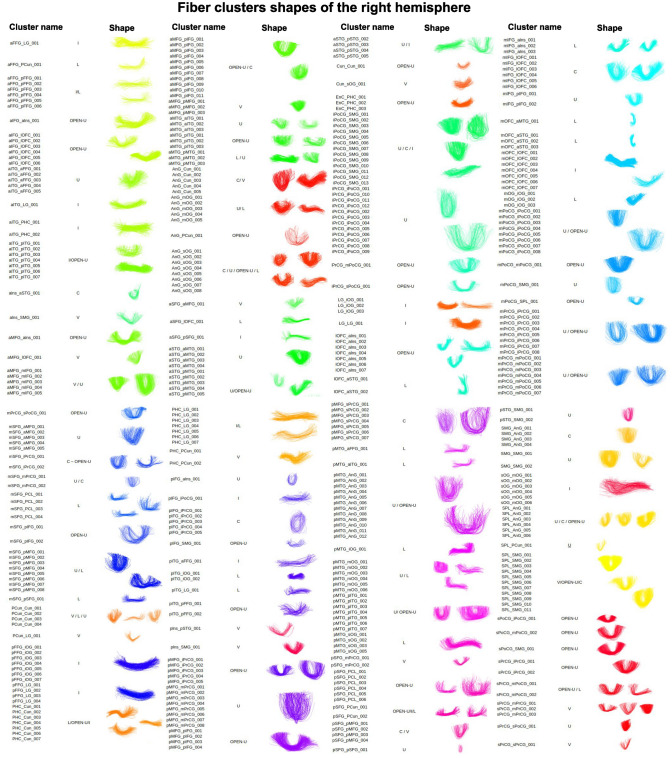
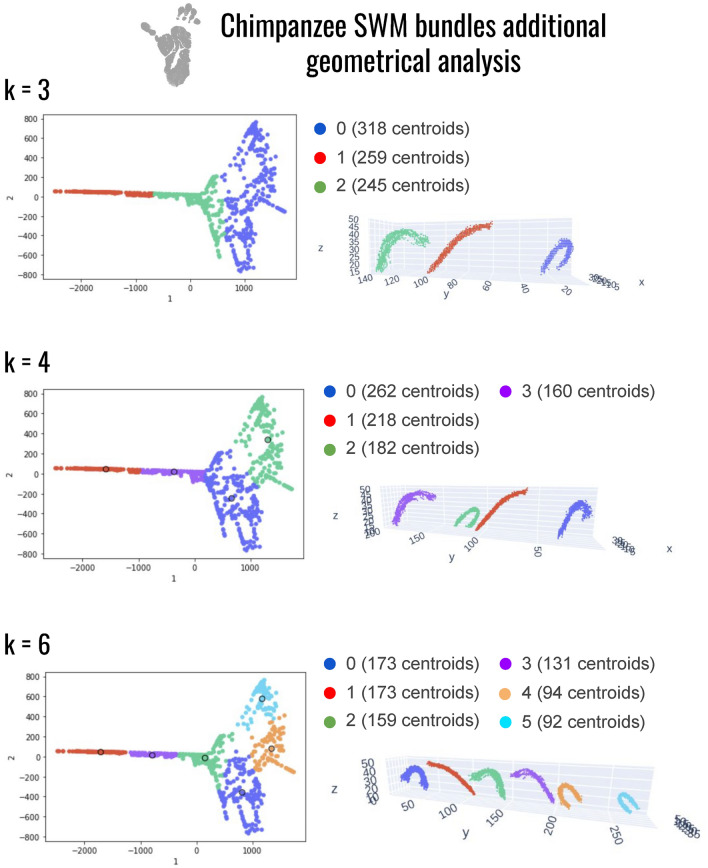
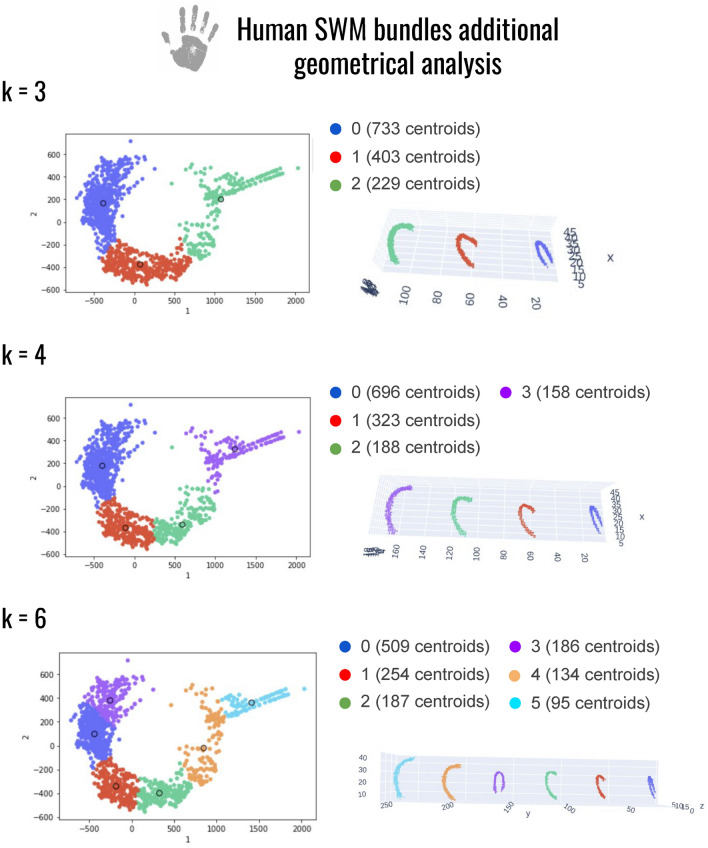
Diffusion MRI tractography (dMRI) has fundamentally transformed our ability to investigate white matter pathways in the human brain. While long-range connections have extensively been studied, superficial white matter bundles (SWMBs) have remained a relatively underexplored aspect of brain connectivity. This study undertakes a comprehensive examination of SWMB connectivity in both the human and chimpanzee brains, employing a novel combination of empirical and geometric methodologies to classify SWMB morphology in an objective manner. Leveraging two anatomical atlases, the Ginkgo Chauvel chimpanzee atlas and the Ginkgo Chauvel human atlas, comprising respectively 844 and 1375 superficial bundles, this research focuses on sparse representations of the morphology of SWMBs to explore the little-understood superficial connectivity of the chimpanzee brain and facilitate a deeper understanding of the variability in shape of these bundles. While similar, already well-known in human U-shape fibers were observed in both species, other shapes with more complex geometry such as 6 and J shapes were encountered. The localisation of the different bundle morphologies, putatively reflecting the brain gyrification process, was different between humans and chimpanzees using an isomap-based shape analysis approach. Ultimately, the analysis aims to uncover both commonalities and disparities in SWMBs between chimpanzees and humans, shedding light on the evolution and organization of these crucial neural structures.

Keywords: Chimpanzee connectivity; Clustering; Diffusion MRI; Isomap; Short association fibers.


Conflict of interest statement

The authors have no relevant financial or non-financial interests to disclose.

Figures

Fig. 1
Fig. 1
Pipeline of the different steps from raw anatomical and diffusion data to the species atlases. (1) At the individual level, anatomical MRI scans were processed using the Morphologist pipeline from Geffroy et al. (2011), enabling the extraction of various anatomical volumes and surfaces necessary for registration and subsequent analysis, such as cortical surface extraction, segmentation mask, and brain sulci. Diffeomorphic transformations to the MNI/Juna templates were computed based on the anatomical volumes. Diffusion MRI data underwent artifact correction, followed by the computation of orientation distribution functions, enabling deterministic tractography for each subject’s brain. Intra-subject fiber clustering was then applied to the tractograms to derive individual white matter fascicles. (2) At the group level, all individual white matter fascicles were aggregated, and a second inter-subject fascicle clustering was performed (using a normalized pairwise distance between the set of centroids representing the intra-subject fascicles) to identify clusters of fascicles representative of the group. (3) Atlasing the short white matter bundles (SWMBs): to atlas the short white matter bundles (SWMBs), clusters of fascicles containing short associative fibers were labeled according to the connected regions (e.g., "iPrCG" for "inferior Pre-Central Gyrus" and "iPoCG" for "inferior Post-Central Gyrus"). Pairing all clusters of fascicles facilitated the creation of a comprehensive atlas of superficial white matter bundles. Further details about this pipeline can be found in the "Fiber clustering" section. All processing steps were implemented using the CEA/NeuroSpin in-house C++ Ginkgo toolbox
Fig. 2
Fig. 2
Cortical parcellation of the chimpanzee and human brains: (left) the chimpanzee cortical parcellation where the 38 left parcels are shown, these parcels were extracted manually from the DAVI130 atlas; (right) the human cortical parcellation used for the SWMB atlas, drawn on the MNI template using the Desikan-Killiany atlas as a reference for corresponding regions of the DAVI130. The 38 regions defined in Fig. 3 were manually drawn using Voi viewer from the Ginkgo toolbox
Fig. 3
Fig. 3
Table of corresponding cortical regions and labels used for the superficial atlases of the chimpanzee and human brains
Fig. 4
Fig. 4
Superficial white matter fiber bundle atlas of the chimpanzee brain based on a fiber clustering from 39 subjects. Top: rendering of the superficial white matter atlas of the chimpanzee brain on the 3D pial surface, each bundle being represented with a different color. The atlas is surrounded by examples of superficial white matter bundles with the negative cast of nearby sulci. Bottom: left and right hemispheres connectivity matrices for bundles connecting the cortical regions, colors are related to the parcellation of the cortical mantle, thickness of regions proportional to the number of clusters
Fig. 5
Fig. 5
Superficial white matter fiber bundle atlas of the human brain based on a fiber clustering from 39 subjects. Top: rendering of the superficial white matter atlas of the human brain on the 3D pial surface, each bundle is represented with a different color. The atlas is surrounded by examples of superficial white matter bundles with the negative cast of nearby sulci. Bottom: left and right hemispheres connectivity matrices for bundles connecting the cortical regions, colors are related to the the parcellation of the cortical mantle, thickness of regions proportional to the number of clusters
Fig. 6
Fig. 6
Schematic representations of the different shapes that could be identified for the SWMB atlases. Two major morphologies are found, composed by flat and enclosed edges, and among them we distinguished: L-shaped, I-shaped, J-shaped, U-shaped, C-shaped, V-shaped, Open-U shaped and 6-shaped morphologies
Fig. 7
Fig. 7
Pipeline of the different steps from point clouds to the description of shape variability through an isomap algorithm
Fig. 8
Fig. 8
Superficial white matter bundle shapes of the chimpanzee brain. A Fiber bundles are categorized into various groups based on their shapes, ranging from bundles with flat edges to those with enclosed edges. Each group is supported by the main fiber shape and an example related to crossed sulci projected onto the Juna.Chimp template chimpanzee pial surface is given. B and C Instances of well-recognized bundles, along with their subdivisions and corresponding fiber bundle morphologies, are provided. Specifically, the uncinate fasciculus and the frontal aslants are presented
Fig. 9
Fig. 9
Superficial white matter bundle shapes of the human brain. A Fiber bundles are categorized into various groups based on their shapes, ranging from bundles with flat edges to those with enclosed edges. Each group is supported by the main fiber shape and an example related to crossed sulci projected onto the MNI template human pial surface is given. B Particular instances of fiber bundle shapes crossing the insula. C The frontal aslants along with the bundle subdivisions and corresponding identified shapes
Fig. 10
Fig. 10
(Top) Fiber bundle shapes empirically seen in the human (left) and chimpanzee (right) brains, accompanied by synthetic shape representations. (Bottom) Table of correspondence between the different observed shapes and related fiber bundle lengths (mean ± standard deviation) for the left and right hemispheres, in both species. Mean lengths of chimpanzee fiber bundles normalized by the cortical surfaces toward human are displayed in the columns entitled "normalized toward human". Chimpanzee bundle lengths have been normalized to human bundle lengths using a multiplicative factor based on the square root of the ratio between the pial surface areas of the two species
Fig. 11
Fig. 11
Histograms of superficial white matter bundles shape and their number in brain lobes (frontal, temporal, parietal and occipital) of the left and right hemispheres for humans (left) and chimpanzees (right)
Fig. 12
Fig. 12
Morphological investigation of the superficial white matter bundles of the chimpanzee brain. A 2 clusters of fiber bundles are identified with average shapes (k = 2) and related number of fiber bundles belonging to each shape. B 5 clusters of fiber bundles are identified with average shapes (k = 5), number of neighbors = 5, and related number of fiber bundles belonging to each shape
Fig. 13
Fig. 13
Percentage of white matter bundles belonging to empirically defined (U, Open-U, V, C, I, L) shapes contributing to each cluster of a chimpanzee isomap-based classification for k = 2 and k = 5 respectively
Fig. 14
Fig. 14
Morphological investigation of the superficial white matter bundles of the human brain. A 2 clusters of fiber bundles are identified with average shapes (k = 2) and related number of fiber bundles belonging to each shape. B 5 clusters of fiber bundles are identified with average shapes (k = 5), number of neighbors = 5, and related number of fiber bundles belonging to each shape
Fig. 15
Fig. 15
Percentage of white matter bundles belonging to empirically defined (U, Open-U, V, J, C, 6, I, L) shapes contributing to each cluster of a human isomap-based classification for k= 2 and k= 5 respectively
Fig. 16
Fig. 16
Morphological investigation of the superficial white matter bundles in chimpanzee and human brains. A 2 clusters of fiber bundles are identified with average shapes (k = 2). B 6 clusters of fiber bundles are identified with average shapes (k = 6). The related number of fiber bundles belonging to each shape in total is displayed. Under each cluster, the percentage of centroids belonging to each average shape for each species is indicated
Fig. 17
Fig. 17
Percentage of white matter bundles belonging to empirically defined (U, Open-U, V, C, I, L) shapes contributing to each cluster of a joint human-chimpanzee isomap-based classification for k = 2 and k = 6 respectively
Fig. 18
Fig. 18
Table of corresponding cortical regions and number of clusters for the chimpanzee superficial white matter bundles
Fig. 19
Fig. 19
Table of corresponding cortical regions and number of clusters for the left human superficial white matter bundles
Fig. 20
Fig. 20
Table of corresponding cortical regions and number of clusters for the right human superficial white matter bundles
Fig. 21
Fig. 21
Bundles of the left SWMB atlas of the human brain and corresponding shapes
Fig. 22
Fig. 22
Bundles of the right SWMB atlas of the human brain and corresponding shapes
Fig. 23
Fig. 23
Bundles of the left SWMB atlas of the chimpanzee brain and corresponding shapes
Fig. 24
Fig. 24
Bundles of the right SWMB atlas of the chimpanzee brain and corresponding shapes
Fig. 25
Fig. 25
Additional morphological investigation of the superficial white matter bundles of the chimpanzee brain. Results are presented for k = 3 to k = 6, graphs are presenting points corresponding to each centroid point cloud with corresponding clusters. For each cluster, the number of centroids is indicated. Each color corresponds to a different cluster. Next to each graph is presented the average shape related to each cluster
Fig. 26
Fig. 26
Additional morphological investigation of the superficial white matter bundles of the human brain. Results are presented for k = 3 to k = 6, graphs are presenting points corresponding to each centroid point cloud with corresponding clusters. For each cluster, the number of centroids is indicated. Each color corresponds to a different cluster. Next to each graph is presented the average shape related to each cluster
Fig. 27
Fig. 27
Additional morphological investigation of the superficial white matter bundles of the human and chimpanzee brains. Results are presented for k = 3 to k = 7, graphs are presenting points corresponding to each centroid point cloud with corresponding clusters. For each cluster, the number of centroids is indicated. Each color corresponds to a different cluster. Next to each graph is presented the average shape related to each cluster

References

    1. Armstrong E, Schleicher A, Omran H, Curtis M, Zilles K (1995) The ontogeny of human gyrification. Cereb Cortex 5(1):56–63 - PubMed
    1. Autrey MM, Reamer LA, Mareno MC, Sherwood CC, Herndon JG, Preuss T, Schapiro SJ, Hopkins WD (2014) Age-related effects in the neocortical organization of chimpanzees: Gray and white matter volume, cortical thickness, and gyrification. Neuroimage 101:59–67 - PMC - PubMed
    1. Avants BB, Tustison N, Song G et al (2009) Advanced normalization tools (ants). Insight j 2(365):1–35
    1. Bellekens B, Spruyt V, Berkvens R, Weyn M (2014) A survey of rigid 3d pointcloud registration algorithms. AMBIENT 2014: the Fourth International Conference on Ambient Computing, Applications, Services and Technologies, August 24-28, 2014, Rome, Italy, 8–13
    1. Bryant KL, Li L, Eichert N, Mars RB (2020) A comprehensive atlas of white matter tracts in the chimpanzee. PLoS Biol 18(12):e3000971 - PMC - PubMed

Publication types

LinkOut - more resources