. 2024 Jul 17;22(1):365.
doi: 10.1186/s12964-024-01737-0.

miR-29a-3p orchestrates key signaling pathways for enhanced migration of human mesenchymal stem cells

Affiliations

miR-29a-3p orchestrates key signaling pathways for enhanced migration of human mesenchymal stem cells

Dayeon Kang et al. Cell Commun Signal. .

Abstract

Background: The homing of human mesenchymal stem cells (hMSCs) is crucial for their therapeutic efficacy and is characterized by the orchestrated regulation of multiple signaling modules. However, the principal upstream regulators that synchronize these signaling pathways and their mechanisms during cellular migration remain largely unexplored.

Methods: miR-29a-3p was exogenously expressed in either wild-type or DiGeorge syndrome critical region 8 (DGCR8) knockdown hMSCs. Multiple pathway components were analyzed using Western blotting, immunohistochemistry, and real-time quantitative PCR. hMSC migration was assessed both in vitro and in vivo through wound healing, Transwell, contraction, and in vivo migration assays. Extensive bioinformatic analyses using gene set enrichment analysis and Ingenuity pathway analysis identified enriched pathways, upstream regulators, and downstream targets.

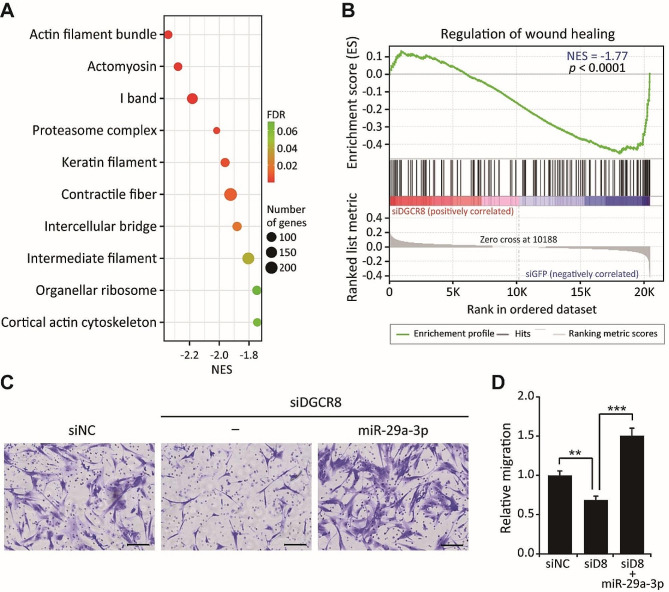
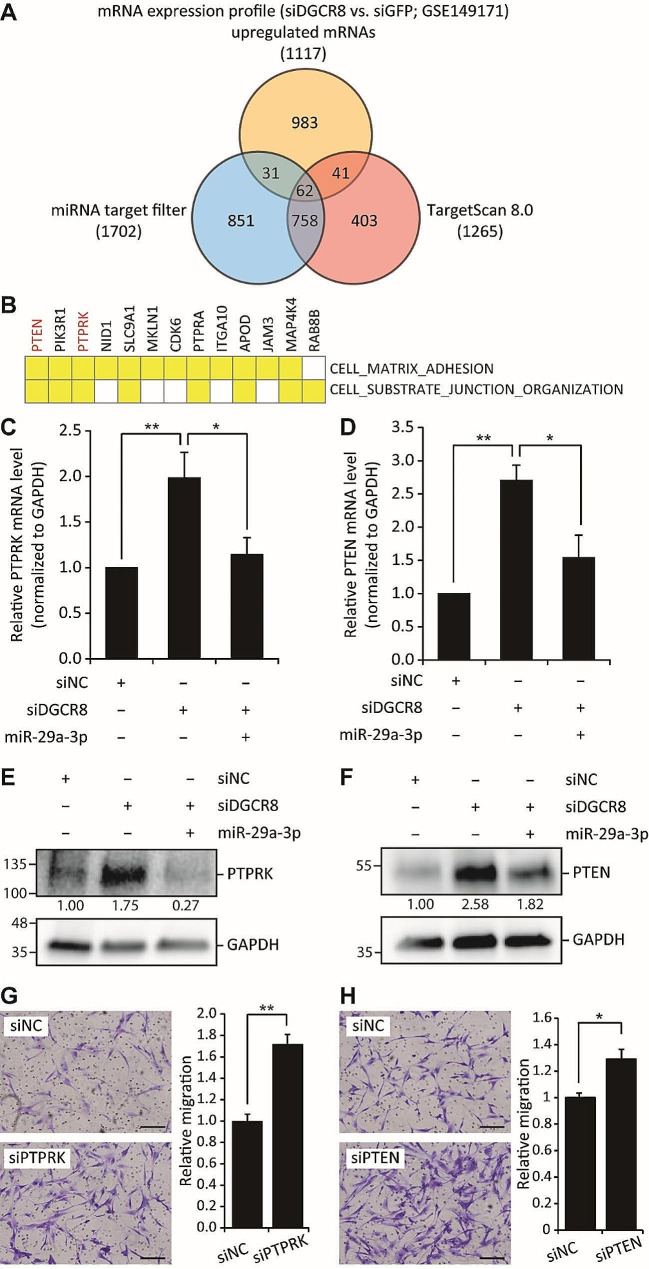
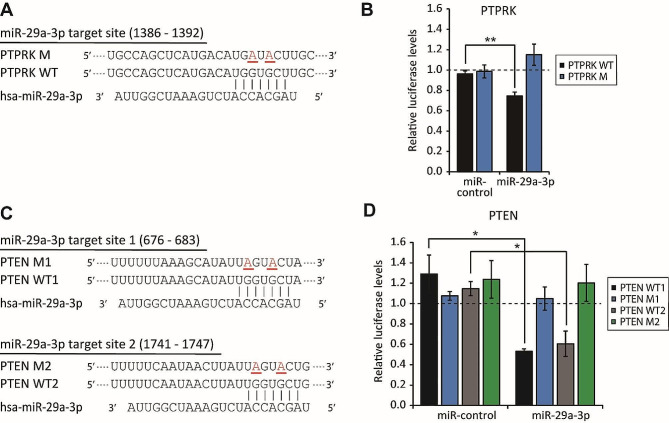
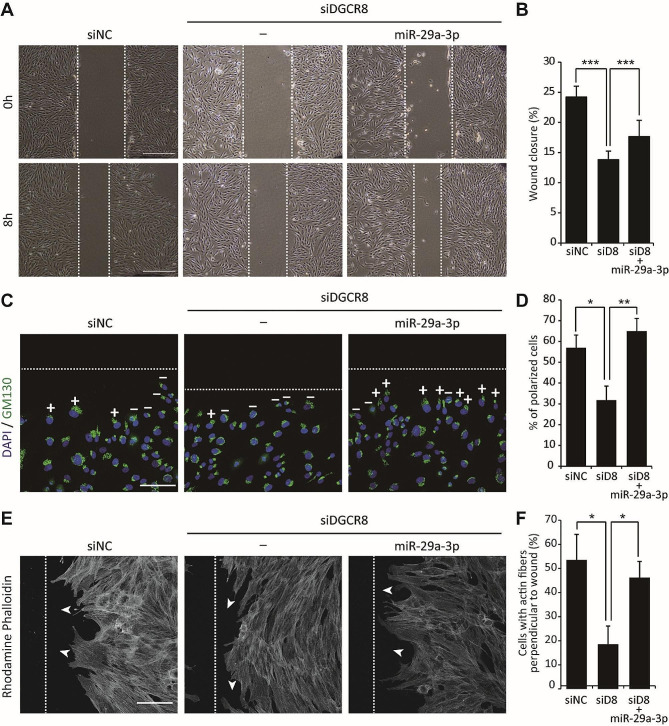
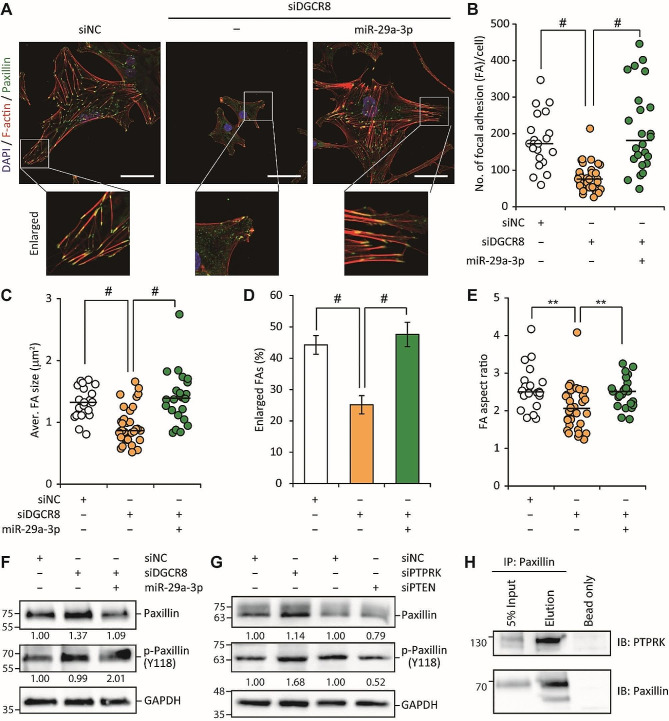
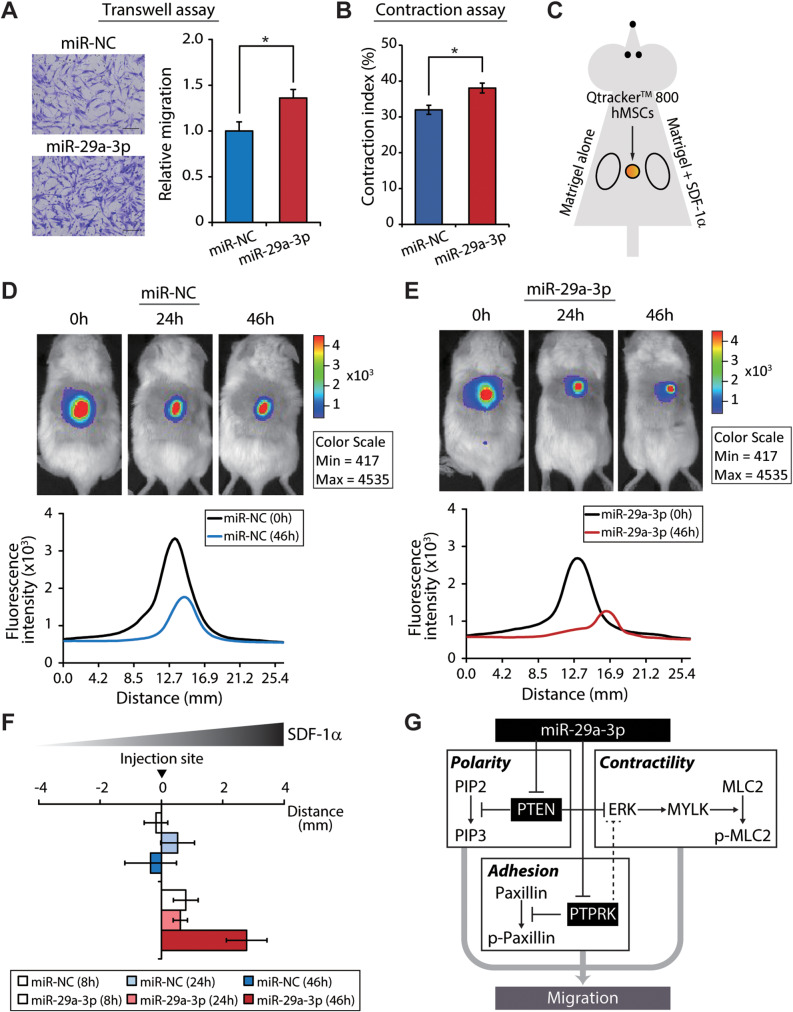
Results: The global depletion of microRNAs (miRNAs) due to DGCR8 gene silencing, a critical component of miRNA biogenesis, significantly impaired hMSC migration. The bioinformatics analysis identified miR-29a-3p as a pivotal upstream regulator. Its overexpression in DGCR8-knockdown hMSCs markedly improved their migration capabilities. Our data demonstrate that miR-29a-3p enhances cell migration by directly inhibiting two key phosphatases: protein tyrosine phosphatase receptor type kappa (PTPRK) and phosphatase and tensin homolog (PTEN). The ectopic expression of miR-29a-3p stabilized the polarization of the Golgi apparatus and actin cytoskeleton during wound healing. It also altered actomyosin contractility and cellular traction forces by changing the distribution and phosphorylation of myosin light chain 2. Additionally, it regulated focal adhesions by modulating the levels of PTPRK and paxillin. In immunocompromised mice, the migration of hMSCs overexpressing miR-29a-3p toward a chemoattractant significantly increased.

Conclusions: Our findings identify miR-29a-3p as a key upstream regulator that governs hMSC migration. Specifically, it was found to modulate principal signaling pathways, including polarization, actin cytoskeleton, contractility, and adhesion, both in vitro and in vivo, thereby reinforcing migration regulatory circuits.

Keywords: Cellular migration; Human mesenchymal stem cells; PTEN; PTPRK; miR-29a-3p.


Conflict of interest statement

The authors declare no competing interests.

Figures

Fig. 1
Fig. 1
Overexpression of miR-29a-3p rescues the migration impairment caused by DGCR8 knockdown in hMSCs. (A) Bubble plot of the top 10 Gene Ontology (GO)_cellular components (CCs) significantly enriched in siDGCR8 vs. siGFP-transfected hMSCs by gene set enrichment analysis (GSEA). Each dot represents a GO_CC term; dot size and color indicate the number and false discovery rate (FDR), respectively. (B) A gene set of regulation of wound healing in siDGCR8 vs. siGFP-transfected hMSCs. Normalized enrichment scores (NES) and p-values are indicated. (C) Representative images of a Transwell migration assay. Scale bars, 100 μm. (D) Migrated cells were enumerated and statistically analyzed (error bars indicate the standard errors of mean of four experiments, **P < 0.01, ***P < 0.001 by Student’s two-tailed t-test). “siD8” indicates siRNA targeting DGCR8.
Fig. 2
Fig. 2
Putative mRNA targets of miR-29a-3p in hMSCs are enriched in processes associated with cellular assembly and organization. (A) Venn diagrams showing the numbers of putative targets according to miRNA target filter and TargetScan v. 8.0 and upregulated genes in DGCR8-knockdown cells. Sixty-two genes were identified by both target prediction algorithms and expression profiling (overlap in the Venn diagram). (B) Overlapping leading-edge genes in DGCR8-knockdown hMSCs. (C, D) mRNA levels of PTPRK (C) and PTEN (D) as determined by quantitative real-time PCR in DGCR8-knockdown hMSCs with or without miR-29a-3p overexpression. Data were normalized to the GAPDH mRNA level. (Error bars indicate standard errors of the mean of three and six experiments, *P < 0.05, **P < 0.01 by Student’s two-tailed t-test). (E, F) Immunoblot analysis of PTPRK (E) or PTEN (F) in DGCR8-knockdown cells with or without miR-29a-3p forced expression. GAPDH was used as the loading control. (G, H) Representative images of a Transwell migration assay in siPTPRK (G) and siPTEN (H) hMSCs. Scale bars, 100 μm. Migrated cells were quantified and statically analyzed (error bars indicate standard errors of the mean of four experiments, *P < 0.05, **P < 0.01 by Student’s two-tailed t-test)
Fig. 3
Fig. 3
miR-29a-3p directly represses PTPRK and PTEN. (A, C) Schematic of miR-29a-3p binding sites in the 3’-UTR of PTPRK (A) and PTEN (C). Mutated nucleotides are underlined and highlighted in red. (B, D) Luciferase reporter assay. 293T cells were co-transfected with luciferase reporters carrying the wild-type or mutated 3′-UTR, as well as 50 nM negative control or miR-29a-3p mimics. Data were normalized to firefly luciferase expression. Values for mock-transfections set to 1 as denoted by the dashed line (error bars indicate standard errors of the mean of three experiments, *P < 0.05 and **P < 0.01 by Student’s two-tailed t-test)
Fig. 4
Fig. 4
miR-29a-3p modulates hMSC polarization during wound healing. (A) Representative images of a wound healing assay of siNC, siDGCR8, and siDGCR8 overexpressing miR-29a-3p (scale bars, 500 μm). (B) The percentage of wound closure was calculated as follows: (A0 − A8)/A0. (A0 is the initial (0 h) wound area, and A8 is the wound area after 8 h). (siNC; n = 26 wells, siDGCR8; n = 26 wells, siDGCR8 + miR-29a-3p; n = 19 wells, ***P < 0.001 by Student’s two-tailed t-test). (C) Representative immunofluorescence images of Golgi (GM130, green) and nucleus (DAPI, blue) in hMSCs 4 h after wounding. (+) polarized; (–) non-polarized. Scale bars, 100 μm. (D) Percentage of polarized hMSCs at the wound edge (siNC; n = 53 cells, siDGCR8; n = 87 cells, siDGCR8 + miR-29a-3p; n = 84 cells, *P < 0.05 and **P < 0.01 by Student’s two-tailed t-test). (E) Representative immunofluorescence images of F-actin in hMSCs 4 h after wounding. White arrowheads indicate the orientation of actin fibers. Scale bars, 100 μm. (F) Percentage of hMSCs with actin fibers perpendicular to the wound (siNC; n = 49 cells, siDGCR8; n = 76 cells, siDGCR8 + miR-29a-3p; n = 98 cells, *P < 0.05 by Student’s two-tailed t-test). “siD8” indicates siRNA targeting DGCR8.
Fig. 5
Fig. 5
miR-29a-3p regulates actomyosin contractility and cellular traction force in hMSCs. (A) Representative fluorescence images of F-actin (red) and pMLC2 (green). A higher-magnification image shows actin and pMLC2. Scale bars, 50 μm. (B) Intensity profiles of F-actin (red) and pMLC2 (green) in siNC or siDGCR8 hMSCs with or without miR-29a-3p overexpression. (C) Pearson’s correlation coefficients of F-actin and pMLC2 (siNC; n = 19 cells, siDGCR8; n = 22 cells, siDGCR8 + miR-29a-3p; n = 27 cells, **P < 0.01 and ***P < 0.001 by Student’s two-tailed t-test). “siD8” indicates siRNA targeting DGCR8. (D) Representative images and stress maps by traction force microscopy of DGCR8-knockdown cells with or without miR-29a-3p forced expression. Scale bars, 50 μm. Force scale bar is in Pascals (Pa). (E) Total traction force of control and DGCR8-knockdown cells with or without miR-29a-3p overexpression. Central box, first to third quartile; middle line, median. (siNC; n = 20 cells, siDGCR8; n = 17 cells, siDGCR8 + miR-29a-3p; n = 17 cells, *P < 0.05 by Student’s two-tailed t-test). (F) Representative images show a Transwell migration assay in siDGCR8 hMSCs overexpressing miR-29a-3p and treated with the non-muscle myosin II inhibitor blebbistatin (blebb) (10 µM), the actin polymerization inhibitor latrunculin A (Lat-A) (0.1 µM), the Rho-associated protein kinase (ROCK) inhibitor Y-27632 (10 µM), or the myosin light chain kinase inhibitor ML-7 (10 µM). Scale bars represent 100 μm. Migrated cells were quantified and statistically analyzed (error bars indicate standard errors of the mean from four experiments, **P < 0.01, ***P < 0.001 by Student’s two-tailed t-test)
Fig. 6
Fig. 6
miR-29a-3p modulates focal adhesion formation and maturation by regulating PTPRK and paxillin in hMSCs. (A) Representative immunofluorescence images of actin cytoskeleton (F-actin, red) and focal adhesions (paxillin, green) in siNC or siDGCR8 hMSCs with or without miR-29a-3p overexpression. A higher-magnification image shows actin and paxillin. Scale bars, 50 μm. (B) Number of focal adhesions per cell, (C) average size of focal adhesions per cell, (D) percentage of cells with enlarged focal adhesions (greater than the median focal adhesion size), and (E) aspect ratio of focal adhesions (siNC; n = 21 cells, siDGCR8; n = 35 cells, siDGCR8 + miR-29a-3p; n = 24 cells; lines, medians, **P < 0.01 and #P < 0.0001 by Student’s two-tailed t-test). (F) Western blotting of the levels of paxillin and pY118-paxillin (p-Paxillin) in siNC or siDGCR8 hMSCs with or without miR-29a-3p overexpression. GAPDH is the loading control. (G) Western blotting of the levels of paxillin and p-Paxillin in siNC, siPTPRK, and siPTEN hMSCs. (H) Co-immunoprecipitation of paxillin and PTPRK in immortalized hMSCs. Immunoprecipitation was performed using an anti-paxillin antibody, and precipitated proteins were examined by western blotting using anti-PTPRK and anti-paxillin antibodies
Fig. 7
Fig. 7
miR-29a-3p enhances hMSC migration in vivo. (A) Representative images of a Transwell migration assay of hMSCs with control or miR-29a-3p overexpression. SDF-1α was used as the chemoattractant. Scale bars, 100 μm. Migrated cells were enumerated and statistically analyzed (error bars indicate standard errors of the mean of four experiments, *P < 0.05 by Student’s two-tailed t-test). (B) Gel contraction by miR-NC and miR-29a-3p overexpression hMSCs (error bars indicate standard errors of the mean of three experiments, *P < 0.05 by Student’s two-tailed t-test). (C) Schematic of subcutaneously implanted Matrigel plugs and injected cells in immunocompromised mice. (D, E) (Top) Qtracker™ 800-labeled hMSCs with or without miR-29a-3p overexpression were traced in vivo using the IVIS Spectrum In Vivo Imaging System at 0, 24, and 46 h. (Bottom) Fluorescence intensity profiles, along with injection sites. (F) Labeled cell distribution at the indicated time points (error bars indicate standard errors of the mean of two or three experiments, mice, n = 3/group, miR-29a-3p group at 46 h, n = 2). (G) A working model of the orchestration of cellular migration by miR-29a-3p, encompassing modulation of the polarization, adhesion, and contractility of hMSCs.

References

    1. Fu X, Liu G, Halim A, Ju Y, Luo Q, Song AG. Mesenchymal stem cell migration and tissue repair. Cells 2019, 8. - PMC - PubMed
    1. Margiana R, Markov A, Zekiy AO, Hamza MU, Al-Dabbagh KA, Al-Zubaidi SH, Hameed NM, Ahmad I, Sivaraman R, Kzar HH, et al. Clinical application of mesenchymal stem cell in regenerative medicine: a narrative review. Stem Cell Res Ther. 2022;13:366. doi: 10.1186/s13287-022-03054-0. - DOI - PMC - PubMed
    1. Deak E, Seifried E, Henschler R. Homing pathways of mesenchymal stromal cells (MSCs) and their role in clinical applications. Int Rev Immunol. 2010;29:514–29. doi: 10.3109/08830185.2010.498931. - DOI - PubMed
    1. Karp JM, Leng Teo GS. Mesenchymal stem cell homing: the devil is in the details. Cell Stem Cell. 2009;4:206–16. doi: 10.1016/j.stem.2009.02.001. - DOI - PubMed
    1. Qu F, Guilak F, Mauck RL. Cell migration: implications for repair and regeneration in joint disease. Nat Rev Rheumatol. 2019;15:167–79. doi: 10.1038/s41584-018-0151-0. - DOI - PMC - PubMed

Publication types