. 2024 Jul 18;15(1):215.
doi: 10.1186/s13287-024-03827-9.

Biological characteristics of tissue engineered-nerve grafts enhancing peripheral nerve regeneration

Affiliations

Biological characteristics of tissue engineered-nerve grafts enhancing peripheral nerve regeneration

Xiangling Li et al. Stem Cell Res Ther. .

Abstract

Background: A favorable regenerative microenvironment is essential for peripheral nerve regeneration. Neural tissue-specific extracellular matrix (ECM) is a natural material that helps direct cell behavior and promote axon regeneration. Both bone marrow-derived mesenchymal stem cells (BMSCs) and adipose-derived mesenchymal stem cells (ADSCs) transplantation are effective in repairing peripheral nerve injury (PNI). However, there is no study that characterizes the in vivo microenvironmental characteristics of these two MSCs for the early repair of PNI when combined with neural tissue-derived ECM materials, i.e., acellular nerve allograft (ANA).

Methods: In order to investigate biological characteristics, molecular mechanisms of early stage, and effectiveness of ADSCs- or BMSCs-injected into ANA for repairing PNI in vivo, a rat 10 mm long sciatic nerve defect model was used. We isolated primary BMSCs and ADSCs from bone marrow and adipose tissue, respectively. First, to investigate the in vivo response characteristics and underlying molecular mechanisms of ANA combined with BMSCs or ADSCs, eighty-four rats were randomly divided into three groups: ANA group, ANA+BMSC group, and ANA+ADSC group. We performed flow cytometry, RT-PCR, and immunofluorescence staining up to 4 weeks postoperatively. To further elucidate the underlying molecular mechanisms, changes in long noncoding RNAs (lncRNAs), circular RNAs (circRNAs), microRNAs (miRNAs), and messenger RNAs (mRNAs) were systematically investigated using whole transcriptome sequencing. We then constructed protein-protein interaction networks to find 10 top ranked hub genes among differentially expressed mRNAs. Second, in order to explore the effectiveness of BMSCs and ADSCs on neural tissue-derived ECM materials for repairing PNI, sixty-eight rats were randomized into four groups: ANA group, ANA+BMSC group, ANA+ADSC group, and AUTO group. In the ANA+BMSC and ANA+ADSC groups, ADSCs/BMSCs were equally injected along the long axis of the 10-mm ANA. Then, we performed histological and functional assessments up to 12 weeks postoperatively.

Results: The results of flow cytometry and RT-PCR showed that ANA combined with BMSCs exhibited more significant immunomodulatory effects, as evidenced by the up-regulation of interleukin (IL)-10, down-regulation of IL-1β and tumor necrosis factor-alpha (TNF-α) expression, promotion of M1-type macrophage polarization to M2-type, and a significant increase in the number of regulatory T cells (Tregs). ANA combined with ADSCs exhibited more pronounced features of pro-myelination and angiogenesis, as evidenced by the up-regulation of myelin-associated protein gene (MBP and MPZ) and angiogenesis-related factors (TGF-β, VEGF). Moreover, differentially expressed genes from whole transcriptome sequencing results further indicated that ANA loaded with BMSCs exhibited notable immunomodulatory effects and ANA loaded with ADSCs was more associated with angiogenesis, axonal growth, and myelin formation. Notably, ANA infused with BMSCs or ADSCs enhanced peripheral nerve regeneration and motor function recovery with no statistically significant differences.

Conclusions: This study revealed that both ANA combined with BMSCs and ADSCs enhance peripheral nerve regeneration and motor function recovery, but their biological characteristics (mainly including immunomodulatory effects, pro-vascular regenerative effects, and pro-myelin regenerative effects) and underlying molecular mechanisms in the process of repairing PNI in vivo are different, providing new insights into MSC therapy for peripheral nerve injury and its clinical translation.

Keywords: Extracellular matrix; Mesenchymal stem cells; Peripheral nerve injury; Vascular regeneration; Whole transcriptome sequencing.


Conflict of interest statement

The authors declare no conflict of interest.

Figures

Fig. 1
Fig. 1
Characterization of decellularized nerve and identification of BMSCs and ADSCs. A Gross view of rat sciatic nerve before and after decellularization (scale bar = 1 cm). B DAPI staining to observe the nucleus structure of rat sciatic nerve before and after decellularization. C Scanning electron micrographs of nerve tissue before and after decellularization, scale bar = 20 μm. D Fibronectin staining of decellularized nerves (20x), scale bar = 40 μm. E, F ADSCs and BMSCs of P3 generation, scale bar = 200 μm. G DNA content of normal and decellularized nerves (n = 3). H, I Flow cytometry analysis of ADSCs and BMSCs. Data represent mean ± standard error and were analyzed using Student’s t test. (***p < 0.001)
Fig. 2
Fig. 2
Effects of ANA combined with BMSCs or ADSCs on the gene expression of inflammatory cytokines, myelin-related proteins, pro-angiogenesis-related factors, and neurotrophic factors in each group at 2 weeks postoperatively (n = 5 per group). AC Gene expression of pro-inflammatory cytokines IL-1β, IL-6, and TNF-α. DF Gene expression of anti-inflammatory cytokines IL-10, IL-13, and IL-4. GI Gene expression of M1-type macrophages (iNOS) and M2-type macrophages (CD206, ARG-1). J, K Gene expression of angiogenesis-related factors TGF-β and VEGF. LN Gene expression of myelin production-related proteins c-Jun, MBP, and MPZ. OQ Gene expression of neurotrophic factors BDNF, NGF, and NT3. Data represent mean ± standard error and were analyzed using one-way ANOVA. (*p < 0.05, **p < 0.01, ***p < 0.001; ns: no significance)
Fig. 3
Fig. 3
Flow cytometry analysis of the effects of ANA combined with BMSCs or ADSCs on different immune cells at 1 and 2 weeks postoperatively (n = 3). AC Flow gating plots of Tregs in each group. D Statistical plots of the proportion of Tregs in each group at 2 weeks postoperatively. E, F Statistical plots of the proportion of CD4+T cells and CD8+T cells in each group at 1 week postoperatively. G Statistical graph of the proportion of the number of B cells in each group at 1 week postoperatively. Data represent mean ± standard error and were analyzed using one-way ANOVA. (*p < 0.05, **p < 0.01, ***p < 0.001; ns: no significance)
Fig. 4
Fig. 4
Effects of ANA combined with BMSCs or ADSCs on vascular regeneration at 3 and 4 weeks postoperatively. A Immunofluorescence staining of CD31 (endothelial cells, red) and α-SMA (vascular smooth muscle actin, green) in longitudinal sections of neural tissue from each group. (Scale bar = 40 μm). B Gross view of neural tissue after MicroFil perfusion of blood vessels in each group at 4 weeks postoperatively, scale bar = 1000 μm. C 3D reconstructed image of MicroFil perfused nerve scanned by micro-CT. D A statistical plot of the ratio of the area of fluorescent area co-expressed with CD31 and α-SMA to the total area in each group (n = 4 per group). E, F Total surface area and volume of blood vessels of MicroFil perfused nerve obtained from analysis of micro-CT scans (ANA+BMSC group: n = 3; ANA and ANA+ADSC groups: n = 4). Data represent mean ± standard error and were analyzed using one-way ANOVA. (*p < 0.05, **p < 0.01, ***p < 0.001)
Fig. 5
Fig. 5
Effects of ANA combined with BMSCs or ADSCs on axonal regeneration and intraneural myelin regeneration at 2 and 3 weeks postoperatively. AC Immunofluorescence staining of myelin-associated protein MPZ in ANA, ANA+BMSC, and ANA+ADSC groups at 3 weeks postoperatively. AC represents the respective local magnification. Scale bar = 20 μm. DF Immunofluorescence staining results of axons (NF200) and Schwann cells (S100) in each group at 3 weeks postoperatively. Scale bar = 500 μm. GJ Immunofluorescence staining results of axons (NF200) and Schwann cells (S100) in each group at 2 weeks postoperatively. Scale bar = 1000 μm. K Statistical graphs of the fluorescence intensity of MPZ at 3 weeks postoperatively. L Statistical graph of axon regeneration length in each group at 2 weeks postoperatively (AUTO, ANA+ADSC and ANA groups: n = 4; ANA+BMSC group: n = 5). Data represent mean ± standard error and were analyzed using one-way ANOVA. (*p < 0.05, ***p < 0.001; ns: no significance)
Fig. 6
Fig. 6
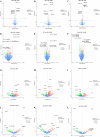
Expression profiles of distinct RNAs at 2 weeks postoperatively (n = 9). In the volcano plots, red, green, and blue colors represent up-regulated differential RNAs, down-regulated differential RNAs, and RNAs with no significant difference. AC DE-miRNAs of BM vs ANA, ASC vs ANA, and BM vs ASC. DF DE-circRNAs of BM vs ANA, ASC vs ANA, and BM vs ASC. GI DE-circRNAs in the ANA+BMSC group compared with the ANA group and the ANA+ADSC group. GI DE-circRNAs in the BMSC group compared with the ANA group and the ANA+ADSC group. GI DEmRNAs of BM vs ANA, ASC vs ANA, and BM vs ASC. JL DE-lncRNAs of BM vs ANA, ASC vs ANA, and BM vs ASC. x-axis: log2 ratio of miRNAs to miRNAs. axis: log2 ratio of miRNA/circRNA/mRNA/lncRNA expression levels. y-axis: false discovery rate values (− log10 transformed) of miRNA/circRNA/mRNA/lncRNA. BM: ANA+BMSC group; ASC: ANA+ADSC group; ANA: ANA group. DE: differentially expressed
Fig. 7
Fig. 7
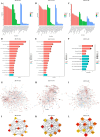
lncRNA-mRNA transcriptomic analysis of BM vs ANA, ASC vs ANA, and BM vs ASC at 2 weeks postoperatively. The top 30 most significantly enriched GO terms of differential RNAs. Different colors represent the three GO subclasses biological processes (BPs, pink), cellular components (CCs, green), and molecular functions (MFs, blue). A GO enrichment analysis of DE-mRNAs in the ANA+BMSC group compared with the ANA group. B GO enrichment analysis of DE-mRNAs in the ANA+ADSC group compared with the ANA group. C GO enrichment analysis of DE-mRNAs in the ANA+BMSC group compared with the ANA+ADSC group. D Line plots of the significantly enriched KEGG pathways of DE-mRNAs in the ANA+BMSC group compared with the ANA group. E Line plots of the significantly enriched KEGG pathways of DE-mRNAs in the ANA+ADSC group compared with the ANA group. F Line plots of the significantly enriched KEGG pathways of the DE-mRNAs in the ANA+BMSC group compared with the ANA+ADSC group. Bars indicate the size of the p-value, the longer the bar, the smaller the p-value; dots indicate the number of genes, and the larger the dot, the greater the number of genes. G PPI network of DE-mRNAs in the ANA+BMSC group compared with the ANA group H PPI network of DE-mRNAs in the ANA+ADSC group compared with the ANA group. I PPI network of DE-mRNAs in the ANA+BMSC group compared to the ANA+ADSC group. J Top 10 hub genes in the PPI network of the DE-mRNAs in the ANA+BMSC group compared with the ANA group. K Top 10 hub genes in the PPI network of the DE-mRNAs in the ANA+ADSC group compared with the ANA group. L Top 10 hub genes in the PPI network of the DE-mRNAs in the ANA+BMSC group compared to the ANA+ADSC group. Darker colors represent higher degree in the network. DE: differentially expressed
Fig. 8
Fig. 8
ANA combined with BMSCs or ADSCs promoted peripheral nerve regeneration and motor function recovery at 12 weeks postoperatively. A Gross view of nerve grafts of each group at 12 weeks postoperatively. B The representative TEM images of each group at 12 weeks postoperatively. Scale bar = 10 μm. C The three-dimensional (3D) footprint intensities charts of CatWalk gait analysis. And the intensities range from 0 to 255. D 2D paw print maps in Catwalk gait for each group. E Masson staining of cross sections of the gastrocnemius muscle on the injured side in each group. Scale bar = 40 μm. And the gross view of the gastrocnemius muscle of the injured (left) and normal (right) sides of each group. Scale bar = 1 cm. F Compound muscle action potential (CMAPs) waveforms on the injured side of each group at 12 weeks postoperatively. G Quantification of the mean thickness of myelin sheath of injured side in each group (n = 3 per group). H Sciatic nerve function index (SFI) of each group at 2, 4, 6, 8, 10, and 12 weeks postoperatively. I The ratio of gastrocnemius muscle wet weight (injured side/normal side) in each group (AUTO, ANA and ANA+BMSC groups: n = 9; ANA+ADSC: n = 8). J The mean cross-sectional area of gastrocnemius muscle fibers in each group at 12 weeks postoperatively. K Ratio of complex muscle action potentials peak in each group (injured side/normal side) (AUTO and ANA+BMSC groups: n = 4; ANA and ANA+ADSC groups: n = 3). L Ratio of delay time of complex muscle action potential in each group (injured side/normal side). Data represent mean ± standard error and were analyzed using one-way ANOVA (G, I, J, K, L) and two-way ANOVA (H). (*p < 0.05, **p < 0.01, ***p < 0.001; ns: no significance)

References

    1. Siemionow M, Brzezicki G. Current techniques and concepts in peripheral nerve repair. Int Rev Neurobiol. 2009;87:141–172. doi: 10.1016/S0074-7742(09)87008-6. - DOI - PubMed
    1. Frostick SP. The physiological and metabolic consequences of muscle denervation. Int Angiol. 1995;14:278–287. - PubMed
    1. Evans GRD. Challenges to nerve regeneration. Semin Surg Oncol. 2000;19:312–318. doi: 10.1002/1098-2388(200010/11)19:3<312::AID-SSU13>3.0.CO;2-M. - DOI - PubMed
    1. Mackinnon SE, Hudson AR. Clinical application of peripheral nerve transplantation. Plast Reconstr Surg. 1992;90(4):695–699. doi: 10.1097/00006534-199210000-00024. - DOI - PubMed
    1. Gordon T. Peripheral nerve regeneration and muscle reinnervation. Int J Mol Sci. 2020;21(22):8652. doi: 10.3390/ijms21228652. - DOI - PMC - PubMed

Publication types