. 2024 Sep;115(9):3180-3193.
doi: 10.1111/cas.16288. Epub 2024 Jul 17.

Discovering cancer stem-like molecule, nuclear factor I X, using spatial transcriptome in gastric cancer

Affiliations

Discovering cancer stem-like molecule, nuclear factor I X, using spatial transcriptome in gastric cancer

Akira Ishikawa et al. Cancer Sci. 2024 Sep.

Abstract

Gastric cancer (GC) is characterized by significant intratumoral heterogeneity, and stem cells are promising therapeutic targets. Despite advancements in spatial transcriptome analyses, unexplored targets for addressing cancer stemness remain unknown. This study aimed to identify Nuclear Factor IX (NFIX) as a critical regulator of cancer stemness in GC and evaluate its clinicopathological significance and function. Spatial transcriptome analysis of GC was conducted. The correlation between NFIX expression, clinicopathological factors, and prognosis was assessed using immunostaining in 127 GC cases. Functional analyses of cancer cell lines validated these findings. Spatial transcriptome analysis stratified GC tissues based on genetic profiles, identified CSC-like cells, and further refined the classification to identify and highlight the significance of NFIX, as validated by Monocle 3 and CytoTRACE analyses. Knockdown experiments in cancer cell lines have demonstrated the involvement of NFIX in cancer cell proliferation and kinase activity. This study underscores the role of spatial transcriptome analysis in refining GC tissue classification and identifying therapeutic targets, highlighting NFIX as a pivotal factor. NFIX expression is correlated with poor prognosis and drives GC progression, suggesting its potential as a novel therapeutic target for personalized GC therapies.

Keywords: biomarker; gastric cancer; gastric mucin phenotype; nuclear factor IX; spatial transcriptome.


Conflict of interest statement

Wataru Yasui is an editorial board member of Cancer Science. The other authors have no conflict of interest.

Figures

FIGURE 1
FIGURE 1
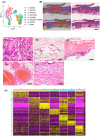
Classification of gastric cancer (GC) tissues using spatial transcriptome analysis. (A) UMAP projection of Visium (CytAssist Visium) spots also identified eight clusters based on differential gene expression analysis. (B) Left: spatial gene expression analysis classifies the cells in GC. Right: HE staining with dots removed from left panel. Scale bars, 1 mm. (C–G) Representative images of GC tissue of HE for each classified cluster; 400×; scale bars, 50 μm. (C) Cluster 0 and 6: cancer. (D) Cluster 1: stroma. (E) Cluster 3: necrosis. (F) Cluster 2: stroma. (G) Cluster 5: smooth muscle. (H) Heat map analysis of high‐expression genes of each cluster.
FIGURE 2
FIGURE 2
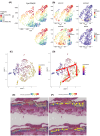
Identification of gastric cancer (GC) stem cell‐like cells via spatial transcriptomic analysis. (A) UMAP projection spots identified four clusters based on differential gene expression analysis of GC. (B) Spatial gene expression analysis classifies the cells in GC. (C) Heat map analysis of highly expressed genes in each cluster. (D–F) Representative images of GC of HE for each classified cluster; 400×; scale bars, 50 μm. (D) Cancer 3 cluster: pronounced nuclear atypia area. (E) Cancer 1 cluster: cancer cells with diffuse morphological characteristics predominantly located in basal areas. (F) Cancer 4 cluster: gland‐forming components. (G–I) Expression relationship with gastric stem cell markers and cancer stem cell markers. (G) Feature plot. (H) Violin plot. (I) Spatial plot.
FIGURE 3
FIGURE 3
Narrowing down gastric cancer stem cell‐like cells through trajectory analysis. (A, B) CytoTRACE analysis with (A) Factor Decomposition ((FD)) for dimensionality reduction and (B) gene expression distribution. (C–F) Pseudotime analysis of Monocle3. (C) UMAP and (D) flow highlighted with red arrows. (E) Spatial plot and (F) flow highlighted with yellow arrows.
FIGURE 4
FIGURE 4
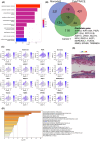
Identification of NFIX as a key gene associated with cancer stemness in gastric cancer. (A) Gene Ontology enrichment analysis of the top 50 genes of cancer stem cell‐like cells. (B) The overlap of the Venn diagram shows that there are 16 candidate targeted genes predicted by Cancer 1 cluster, Monocle3, and CytoTRACE. (C) Feature plots of each candidate gene. (D) Metascape analysis of these genes. (E) Spatial plot of NFIX.
FIGURE 5
FIGURE 5
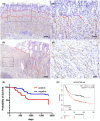
Correlation of NFIX expression with poor prognosis in gastric cancer (GC). (A–D) Representative immunohistochemical images of NFIX. (A, B) Immunohistochemical staining of NFIX in non‐neoplastic gastric mucosa. Original magnification: (A) 100×; scale bars, 200 μm and (B) 400×; scale bars, 50 μm. Expression regions are indicated by red dotted lines, and representative expression areas are indicated by red arrows. (C, D) Immunohistochemical staining of NFIX in GC. Original magnification: (C) 40×; scale bars, 200 μm and (D) 400×; scale bars, 50 μm. (E) Overall survival probability in the 127 GC cases. (F) Overall survival probability in the public RNA‐seq dataset.
FIGURE 6
FIGURE 6
Role of NFIX in gastric cancer (GC) cells: Proliferation, stemness, and kinase activity regulation. (A) Western blot analysis of NFIX in five non‐neoplastic or GC cell lines. (B) Western blot analysis of NFIX in MKN‐45 cells transfected with the negative control or NFIX siRNA. (C) Effect of NFIX knockdown on cell growth in MKN‐45 cells transfected with the negative control or NFIX siRNA. (D, E) Wound‐healing assay in MKN‐45 cells transfected with the negative control or NFIX siRNA. (D) Mean percentage of wound closure. (E) Representative image. (F) Number and size of spheroids formed by MKN‐45 cell lines transfected with negative control or NFIX siRNA. (G) The heatmap shows the gene expression profile of three independent sets of MKN‐45 cells transfected with the negative control or NFIX siRNA by RNA sequencing analysis. Data are color coded to reflect the gene expression level. (H) Volcano plot comparing MKN‐45 cells transfected with the negative control and those transfected with NFIX siRNA. (I) Gene Ontology enrichment analysis of the top 50 genes.

References

    1. Thuler LCS. The epidemiology of stomach cancer. In: Morgado‐Diaz JA, ed. Gastrointestinal Cancers; Brisbane (AU): Exon Publications. 2022. https://www.ncbi.nlm.nih.gov/books/NBK585996/ - PubMed
    1. Siegel RL, Miller KD, Wagle NS, Jemal A. Cancer statistics, 2023. CA Cancer J Clin. 2023;73:17‐48. - PubMed
    1. Oue N, Sentani K, Sakamoto N, Uraoka N, Yasui W. Molecular carcinogenesis of gastric cancer: Lauren classification, mucin phenotype expression, and cancer stem cells. Int J Clin Oncol. 2019;24:771‐778. - PubMed
    1. Takaishi S, Okumura T, Wang TC. Gastric cancer stem cells. J Clin Oncol. 2008;26:2876‐2882. - PMC - PubMed
    1. Ishikawa A, Sakamoto N, Honma R, et al. Annexin A10 is involved in the induction of pancreatic duodenal homeobox‐1 in gastric cancer tissue, cells and organoids. Oncol Rep. 2020;43:581‐590. - PubMed

MeSH terms

Substances