. 2024 Sep 9;52(16):9551-9573.
doi: 10.1093/nar/gkae611.

DNA cytosine methyltransferases differentially regulate genome-wide hypermutation and interhomolog recombination in Trichoderma reesei meiosis

Affiliations

DNA cytosine methyltransferases differentially regulate genome-wide hypermutation and interhomolog recombination in Trichoderma reesei meiosis

Lavernchy Jovanska et al. Nucleic Acids Res. .

Abstract

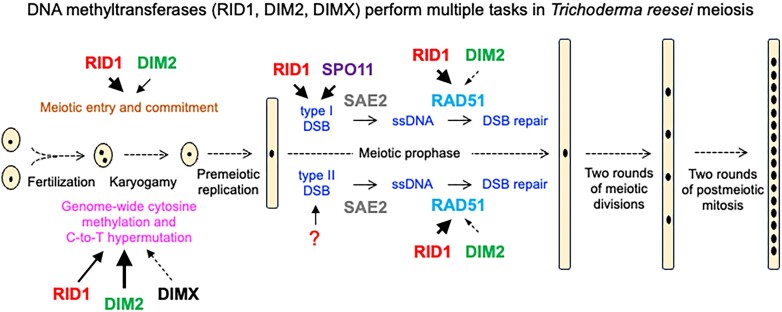
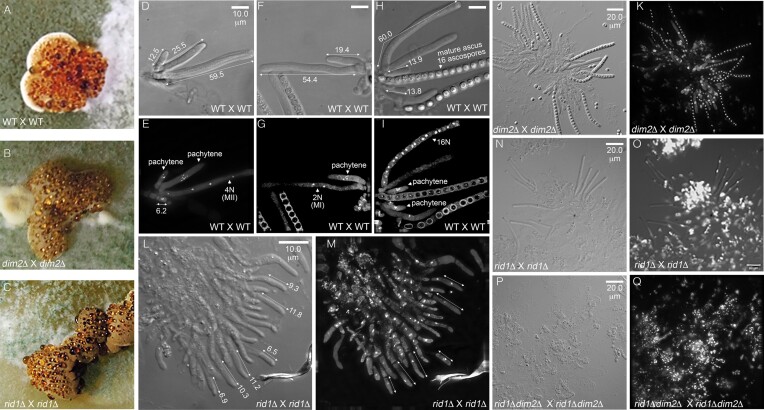
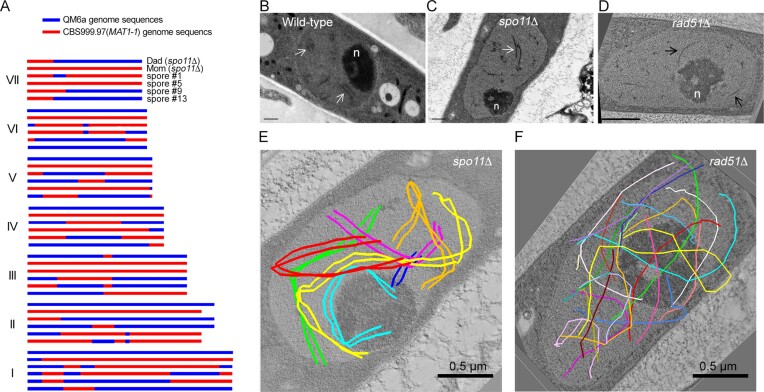
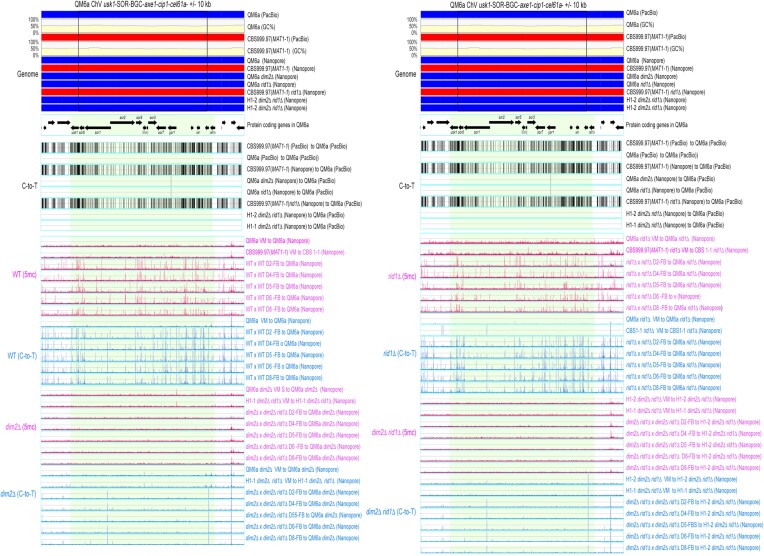
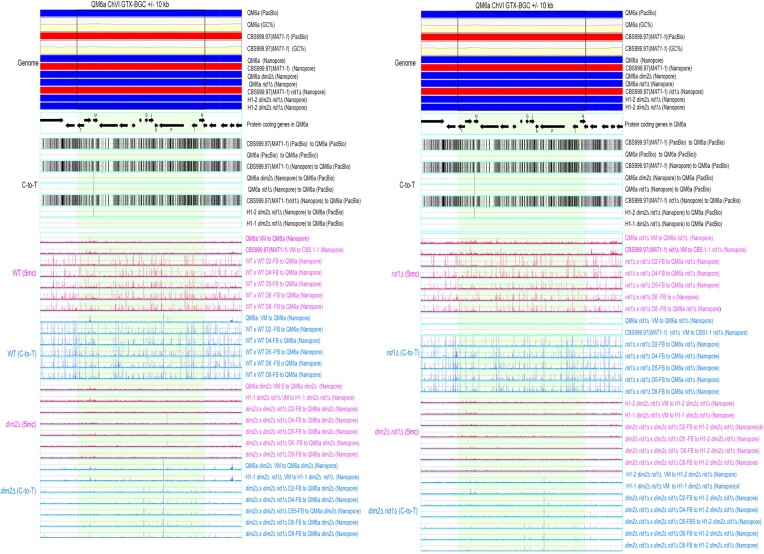
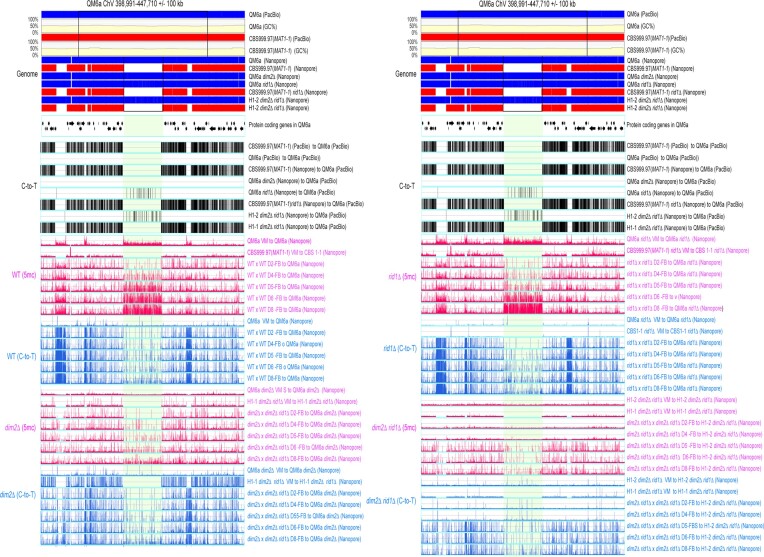
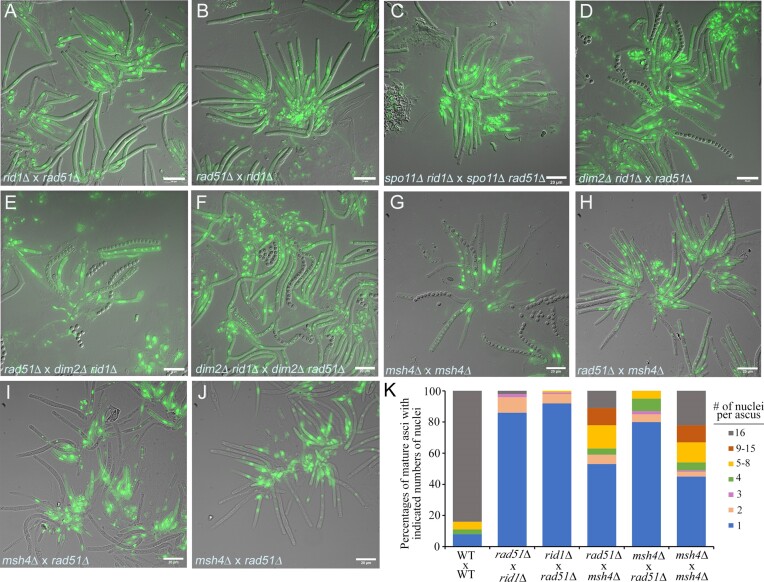
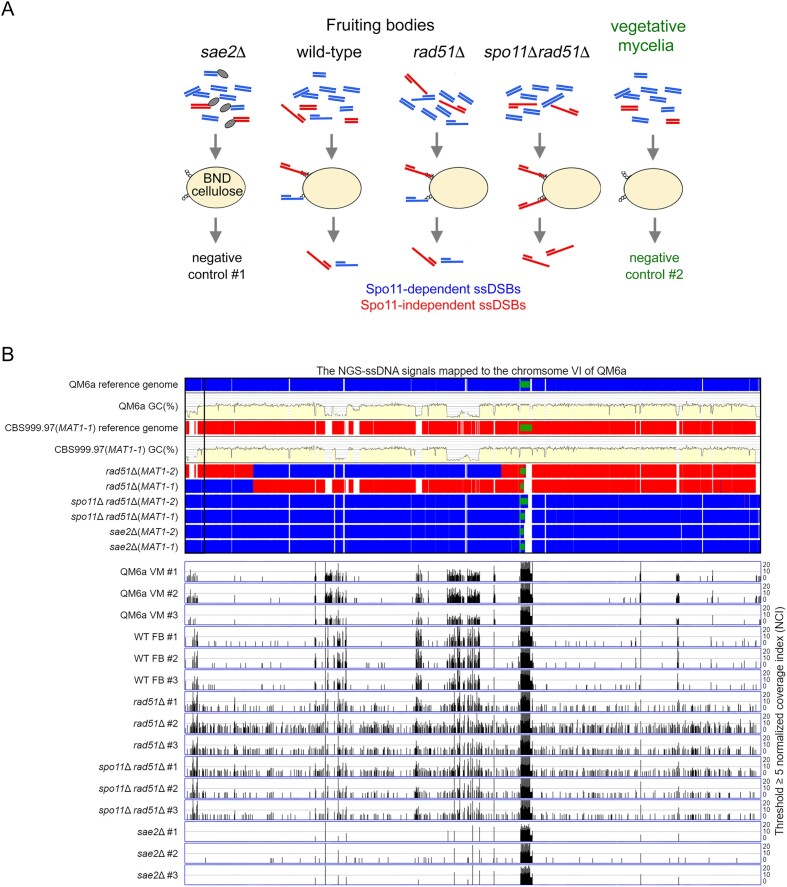
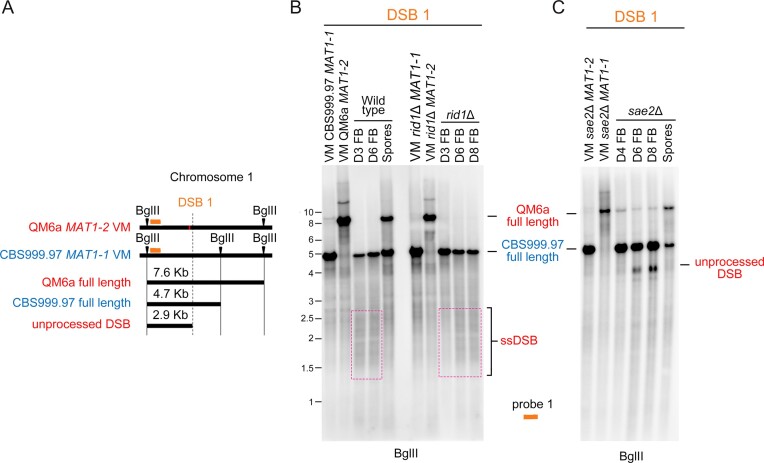
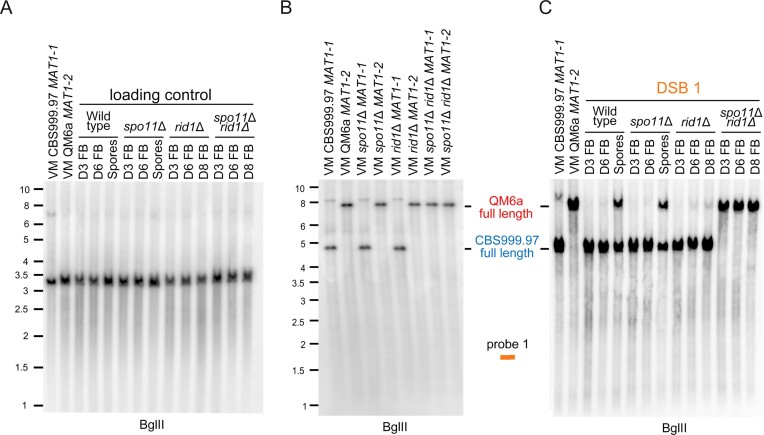
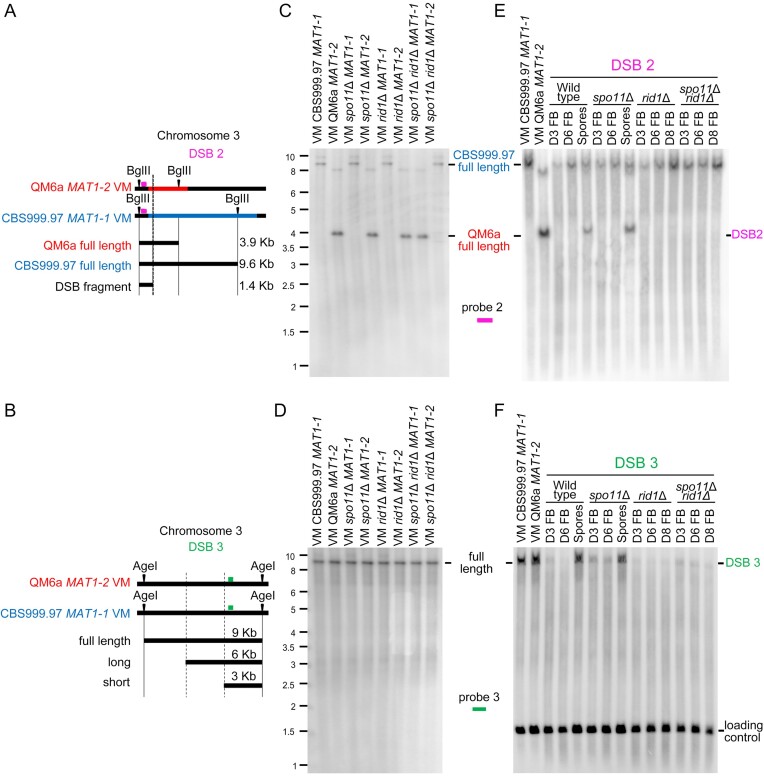
Trichoderma reesei is an economically important enzyme producer with several unique meiotic features. spo11, the initiator of meiotic double-strand breaks (DSBs) in most sexual eukaryotes, is dispensable for T. reesei meiosis. T. reesei lacks the meiosis-specific recombinase Dmc1. Rad51 and Sae2, the activator of the Mre11 endonuclease complex, promote DSB repair and chromosome synapsis in wild-type and spo11Δ meiosis. DNA methyltransferases (DNMTs) perform multiple tasks in meiosis. Three DNMT genes (rid1, dim2 and dimX) differentially regulate genome-wide cytosine methylation and C:G-to-T:A hypermutations in different chromosomal regions. We have identified two types of DSBs: type I DSBs require spo11 or rid1 for initiation, whereas type II DSBs do not rely on spo11 and rid1 for initiation. rid1 (but not dim2) is essential for Rad51-mediated DSB repair and normal meiosis. rid1 and rad51 exhibit a locus heterogeneity (LH) relationship, in which LH-associated proteins often regulate interconnectivity in protein interaction networks. This LH relationship can be suppressed by deleting dim2 in a haploid rid1Δ (but not rad51Δ) parental strain, indicating that dim2 and rid1 share a redundant function that acts earlier than rad51 during early meiosis. In conclusion, our studies provide the first evidence of the involvement of DNMTs during meiotic initiation and recombination.


Figures

Graphical Abstract
Graphical Abstract
Figure 1.
Figure 1.
rid1 (but not dim2) is required for normal meiosis. (A–C) rid1 and dim2 are dispensable for sexual mating and the formation of mature stromata. (D–Q) rid1 (but not dim2) is required for normal development of mature ascospores. Rosettes of asci were manually dissected from perithecia, stained with either DAPI or SYTOX™, and then visualized by a DeltaVision Core Imaging System. Differential interference contrast (DIC; D, F, H, L, J, N and P) and DAPI/SYTOX fluorescence images (E, G, H, I, K, M, O and P) are shown. Wild-type (WT; QM6a X CBS999.97(MAT1-1)) (D–I) and dim2Δ (J, K) can generate mature asci (>50 μm in length) with 16 ascospores. Some rid1Δ asci can elongate into mature asci, but they contain only one or two nuclei (L–O). The rid1Δ dim2Δ meiocytes hardly elongate into mature asci (P, Q). Bar = 10 or 20 μm.
Figure 2.
Figure 2.
spo11 is dispensable for T. reesei interhomolog recombination and chromosome synapsis. (A) Genome-wide mapping of meiotic recombination products in the absence of spo11 using PacBio Sequel technology and the TSETA software tool (59,60). The seven horizontal rows of sequence data represent the seven full-length chromosomes (I to VII) in two parental spo11Δ strains (Dad and Mom) and the four representative F1 progeny. Nucleotide sequences identical to those of the QM6a and CBS999.97(MAT1-1) reference genomes are indicated in blue and red. COs are located where 2:2 markers undergo a reciprocal genotype change. (B–D) Representative TEM images of wild-type (B), spo11Δ (C) and rad51Δ (D) meiotic cells at the pachytene stages. The SCs in WT and spo11Δ are marked by white arrows, whereas axial elements in rad51Δ are marked by black arrows. The enlarged nucleolus (n) is a hallmark of meiotic prophase nuclei. (E, F) 3D-TEM tomography. The seven pairs of lateral elements in spo11Δ (E) and the fourteen axial elements in rad51Δ (F) are highlighted as colored lines. Black bar: 0.5 μm.
Figure 3.
Figure 3.
The 5mC (in blue; BS+/NGS) and C-to-T mutation (in pink; BS−/NGS) profiles in RCS1-GTX. RCS1-GTX contains the GTX-BGC chromosomal region and its upstream 10 kb and downstream 10 kb sequences. The two boundaries of GTX-BGC are indicated by two vertical black lines. Genomic DNA was isolated from indicated vegetative mycelia (VM) of the two parental haploid strains, as well as the fruiting bodies (FB) at different days (D2-D8) after initiating sexual crosses of WT (WTH0011) × WT (WTH0015), dim2Δ (WTH13060) × rid1Δ dim2Δ (WTH13147), rid1Δ (WTH13058) × rid1Δ (WTH13059) and rid1Δ dim2Δ (WTH13215) × rid1Δ dim2Δ (WTH13147), respectively (Table 1). The results of BS− and BS+ NGS gDNA-seq were analyzed and visualized using ‘TSETA’ (58,59). The reference genome sequences of QM6a (WTH0011) and CBS999.97(MAT1-1) (WTH0015) determined by PacBio RSII technology (11) are indicated in red and blue, respectively. The GC contents (window size = 500 bp) for the telomere-to-telomere sequence of the sixth chromosome of QM6a are shown in yellow. The protein-coding genes in QM6a were visualized by arrows. The near-complete genome sequences of seven haploid parental strains were determined by Oxford Nanopore Technology, and their nucleotide sequences identical to the two reference genomes are visualized in blue and red, respectively. Compared to the genome sequence of QM6a, all C-to-T allelic variants in the genomes of CBS999.97(MAT1-1) and the seven parental haploid genomes are indicated by vertical black lines and were excluded to enable identification of newly generated C-to-T mutations.
Figure 4.
Figure 4.
The 5mC (in blue; BS+/NGS) and C-to-T mutation (in pink; BS−/NGS) profiles in RCS2-SOR. RCS2-SOR contains the usk1-SOR-BGC-axe1-cip1-cel61a chromosomal region and its upstream 10 kb and downstream 10 kb sequences. The two boundaries of usk1-SOR-BGC-axe1-cip1-cel61a are indicated by two vertical black lines. All results were analyzed and visualized as described in Figure 3.
Figure 5.
Figure 5.
The 5mC (in blue; BS+/NGS) and C-to-T mutation (in pink; BS−/NGS) profiles in RCS3-AT. RCS3-AT contains a long QM6a chromosomal fragment (ChV: 398991–447710 bp) and its upstream 10 kb and downstream 10 kb sequences. The two boundaries of this long QM6a chromosomal fragment are indicated by two vertical black lines. All results were analyzed and visualized as described in Figure 3. The five QM6a-specific, AT-rich, and protein-free DNA sequences are indicated by 1–5.
Figure 6.
Figure 6.
The LH relationship between rad51Δ × rid1Δ or rid1Δ × rad51Δ heterozygous zygotes is regulated by dim2 and partly mediated by msh4. (A–J) Rosettes of asci from indicated sexual crosses were manually dissected from perithecia, stained with SYTOX™, and then visualized by a DeltaVision Core Imaging System. Differential interference contrast (DIC) and DAPI/SYTOX fluorescence images (in green) are shown. Bar = 10 or 20 μm. (K) Percentages of cylindrical asci (≥50 μm in length) with the indicated number of nuclei are shown.
Figure 7.
Figure 7.
Genome-wide mapping of ssDNA-associated DSBs (ssDSBs) in wt, rad51Δ and rad51Δ spo11Δ fruiting bodies (FB). (A) Schematic illustrating the ssDNA enrichment procedures using BND cellulose, as described previously (65). The ssDNAs formed in QM6a (WHY00015) × CBS999.97(MAT1-1) (WHY00011), rad51Δ (WTH12867) × rad51Δ (WTH12794) and spo11Δ rad51Δ (WTH12901) × spo11Δ rad51Δ (WTH12902) FBs, as well as those from QM6a (WHY00015) and CBS999.97(MAT1-1) vegetative mycelia, were enriched employing BND cellulose. The ssDNAs isolated from the sae2Δ (WTH13049) x sae2Δ (WTH13040) FBs and from QM6a and CBS999.97(MAT1-1) vegetative mycelia were used as negative controls. All experiments were performed in triplicate(see Materials and methods). (B) The enriched ssDNA peaks along the sixth chromosome were identified using a threshold of ≥ 5 normalized coverage index (NCI) (see Materials and methods). The reference genome sequences of QM6a (WTH0011) and CBS999.97(MAT1-1) (WTH0015) determined by PacBio RSII technology (11) are indicated in red and blue, respectively. The GC contents (window size 500 bp) for the telomere-to-telomere sequence of the sixth chromosome of QM6a are shown in yellow. The near-complete genome sequences of six haploid parental strains were determined by Oxford Nanopore Technology, and their nucleotide sequences identical to the two reference genomes are visualized in blue and red, respectively. The two telomeric sequences and each 45S rDNA array are indicated by black empty and green solid rectangles, respectively. The raw sequencing reads from each sample were mapped to the QM6a genome using the BWA (v0.7.17) alignment tool (66). We used the package BAMscale (v1.0) to quantify the sequencing peaks and normalize the coverage tracks across all samples (67). Using its ‘scale’ function, peak coverages were calculated based on the sum of per-base coverage of reads and then scaled to 1× genome coverage. The resulting values of ‘normalized coverage index’ are referred to as NCI. QM6a and CBS999.97(MAT1-1) vegetative mycelia (VM) and the three sae2 FBs were used as negative controls. All experiments were performed in triplicate.
Figure 8.
Figure 8.
The roles of rid1 and sae2 in initiation and repair of DSB1. (A) Restriction map of DSB1 in the first chromosome of QM6a and CBS999.97(MAT1-1). Polymorphic DNA sequences in QM6a and CBS999.97(MAT11-1) are indicated in red and blue, respectively. The BglII restriction enzyme sites and the two break sites revealed by our BND ssDNA enrichment experiment are indicated by green arrowheads and ‘X’, respectively. After BglII digestion, the expected fragment sizes for the full-length bands, unprocessed DSB, and ssDSB are designated. The location of the DNA probe (red bar) used for Southern hybridization is shown above the chromosomes. (BC) Southern hybridization of gDNA isolated from two haploid maternal and paternal vegetative mycelia (VM) and the corresponding fruiting bodies (FBs) at indicated days after the initiation of sexual crosses, as well as the mature ascospores released from wild-type and sae2Δ FBs. Visualization/quantification of Southern hybridization band intensity was performed using a BAS-IP MS204 phosphorimaging plate (Cytiva, Japan) and a TyphoonFLA 9000 biomolecular imager (Cytiva, Japan).
Figure 9.
Figure 9.
The roles of rid1 and spo11 in initiation and repair of DSB1 (Figure 8A). (A) The smp3 DNA was used as the loading control for Southern hybridization. (B) Southern hybridization of gDNA isolated from eight haploid maternal and paternal vegetative mycelia (VM). (C) Southern hybridization of gDNA isolated from the corresponding fruiting bodies (FBs) at indicated days after the initiation of sexual crosses, as well as the mature ascospores released from the indicated fruiting bodies. Visualization/quantification of Southern hybridization band intensity was performed using a BAS-IP MS204 phosphorimaging plate (Cytiva, Japan) with a Typhoon 5 biomolecular imager (Cytiva, Japan).
Figure 10.
Figure 10.
The roles of rid1 and spo11 in initiation and repair of DSB2 and DSB3. (A) Restriction map of DSB2 on the third chromosome. Polymorphic DNA sequences in QM6a and CBS999.97(MAT11-1) are indicated in red and blue, respectively. The BglII restriction enzyme sites and the putative break site revealed by BND ssDNA enrichment experiments are indicated by black arrowheads and ‘X’, respectively. (B) Restriction map of DSB1 in the first chromosome of QM6a and CBS999.97(MAT1-1). The AgeI restriction enzyme sites and the two break sites revealed by our BND ssDNA enrichment experiment are indicated by two vertical lines, respectively. After AgeI digestion, the expected fragment sizes for the full-length band, ssDSB-1 (long), and ssDSB-2 (short) are designated. The location of the DNA probe (in green) used for Southern hybridization is shown above the chromosome (C–F) Southern hybridization. After BglII or AgeI digestion, the expected fragment sizes for the full-length DNA bands, DSB2 and DSB3 are designated. The location of the two DNA probes (in pink and orange) used for Southern hybridization are shown above the chromosome. (C, D) Southern hybridization of gDNA isolated from eight haploid maternal and paternal vegetative mycelia (VM). (E, F) Southern hybridization of gDNA isolated from the corresponding fruiting bodies (FBs) harvested at indicated days after the initiation of sexual crosses, as well as the mature ascospores released from the indicated fruiting bodies. After BglII digestion, the smp3 DNA was used as the loading control for Southern hybridization (Supplementary Figure S24A). After AgeI digestion, the act1 DNA was used as the loading control for Southern hybridization (F). Visualization/quantification of Southern hybridization band intensity was performed using a BAS-IP MS204 phosphorimaging plate (Cytiva, Japan) with a Typhoon 5 biomolecular imager (Cytiva, Japan).

Similar articles

Cited by

References

    1. Lyko F. The DNA methyltransferase family: a versatile toolkit for epigenetic regulation. Nat. Rev. Genet. 2018; 19:81–92. - PubMed
    1. Nai Y.S., Huang Y.C., Yen M.R., Chen P.Y.. Diversity of fungal DNA methyltransferases and their association with DNA methylation patterns. Front. Microbiol. 2021; 11:616922. - PMC - PubMed
    1. Walker J., Gao H., Zhang J., Aldridge B., Vickers M., Higgins J.D., Feng X.. Sexual-lineage-specific DNA methylation regulates meiosis in Arabidopsis. Nat. Genet. 2018; 50:130–137. - PMC - PubMed
    1. Gaysinskaya V., Miller B.F., De Luca C., van der Heijden G.W., Hansen K.D., Bortvin A.. Transient reduction of DNA methylation at the onset of meiosis in male mice. Epigenetics Chromatin. 2018; 11:15. - PMC - PubMed
    1. Keeney S., Giroux C.N., Kleckner N.. Meiosis-specific DNA double-strand breaks are catalyzed by Spo11, a member of a widely conserved protein family. Cell. 1997; 88:375–384. - PubMed

MeSH terms

Substances

Supplementary concepts