. 2024 Jun 14;4(1):ycae084.
doi: 10.1093/ismeco/ycae084. eCollection 2024 Jan.

Active prokaryotic and eukaryotic viral ecology across spatial scale in a deep-sea brine pool

Affiliations

Active prokaryotic and eukaryotic viral ecology across spatial scale in a deep-sea brine pool

Benjamin Minch et al. ISME Commun. .

Abstract

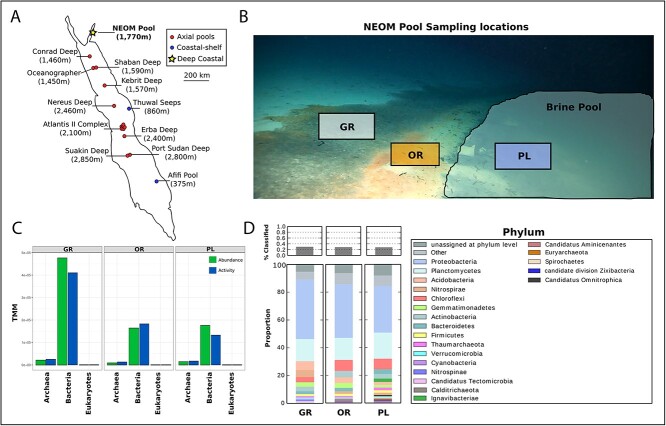
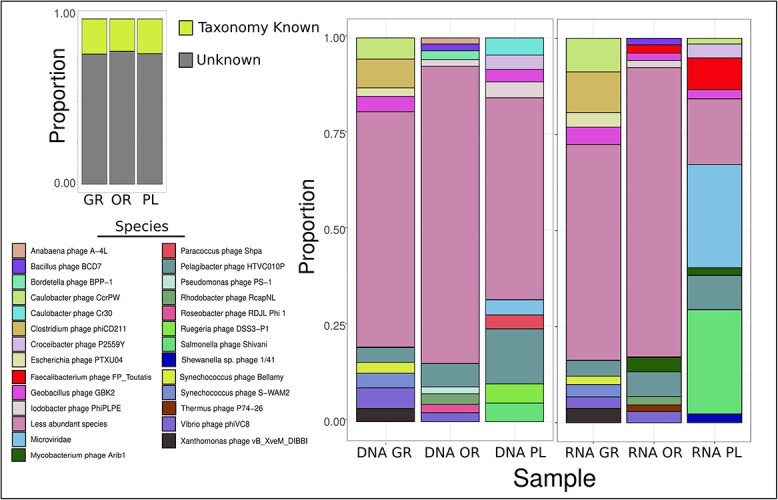
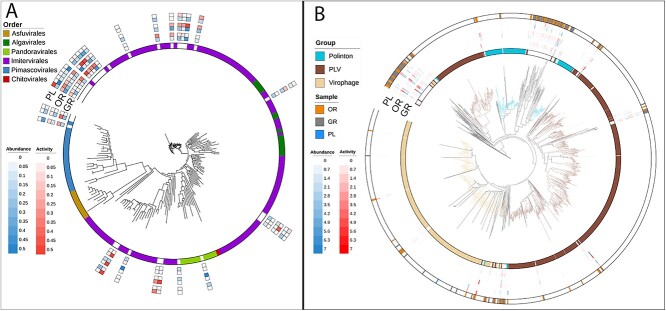
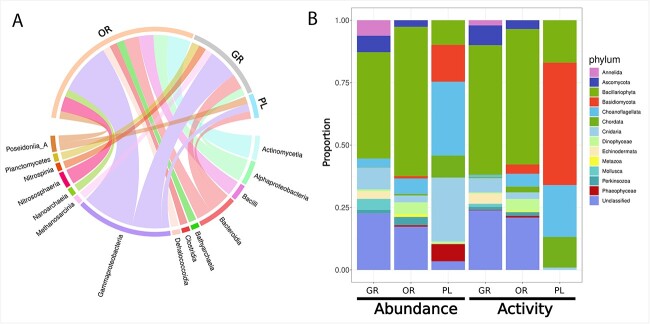
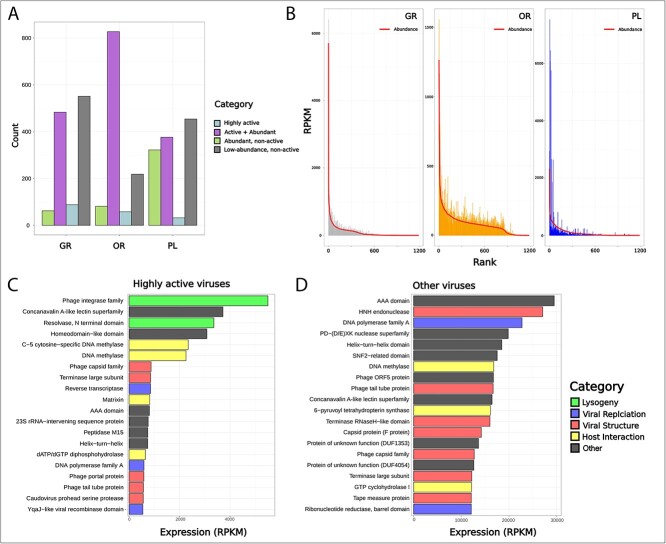
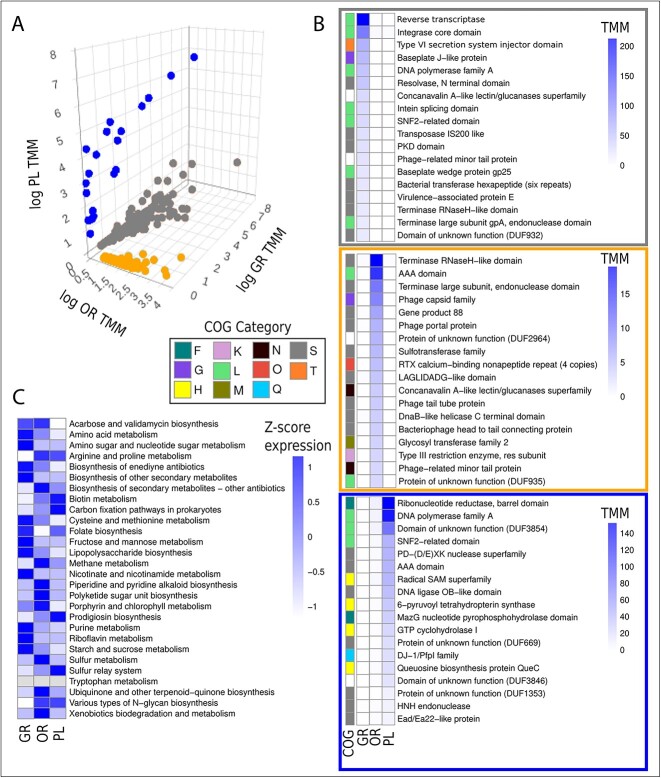
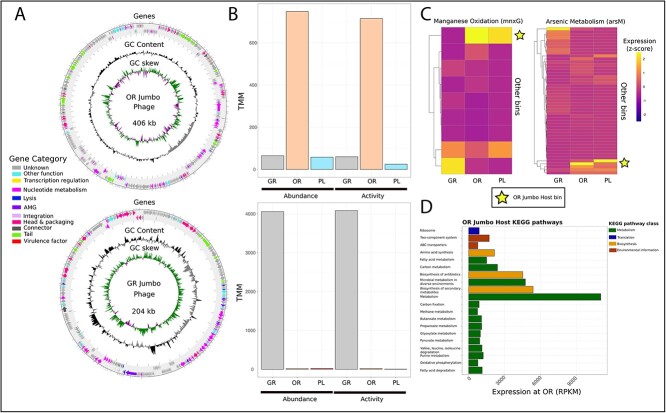
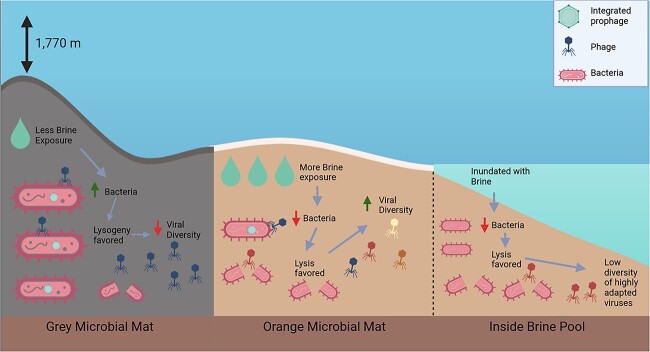
Deep-sea brine pools represent rare, extreme environments, providing unique insight into the limits of life on Earth, and by analogy, the plausibility of life beyond it. A distinguishing feature of many brine pools is presence of thick microbial mats that develop at the brine-seawater interface. While these bacterial and archaeal communities have received moderate attention, viruses and their host interactions in these environments remain underexplored. To bridge this knowledge gap, we leveraged metagenomic and metatranscriptomic data from three distinct zones within the NEOM brine pool system (Gulf of Aqaba) to reveal the active viral ecology around the pools. We report a remarkable diversity and activity of viruses infecting microbial hosts in this environment, including giant viruses, RNA viruses, jumbo phages, and Polinton-like viruses. Many of these form distinct clades-suggesting presence of untapped viral diversity in this ecosystem. Brine pool viral communities exhibit zone-specific differences in infection strategy-with lysogeny dominating the bacterial mat further away from the pool's center. We linked viruses to metabolically important prokaryotes-including association between a jumbo phage and a key manganese-oxidizing and arsenic-metabolizing bacterium. These foundational results illuminate the role of viruses in modulating brine pool microbial communities and biogeochemistry through revealing novel viral diversity, host associations, and spatial heterogeneity in viral dynamics.

Keywords: NEOM brine pools; brine pool viruses; deep-sea viruses; marine viral diversity; marine virus ecology; virus–host interactions.


Conflict of interest statement

The authors declare no conflict of interest.

Figures

Figure 1
Figure 1
Sampling location and community composition; (A) a map of all discovered Red Sea brine pools, split into three categories based on location and depth, and (B) a picture taken from the ROV of the sampling locations showing the GR, OR, and PL; (C) abundance and activity of different kingdoms of life based on normalized metagenomic (abundance) and metatranscriptomic (activity) reads (TMM) mapped to contigs from each kingdom identified using Tiara; (D) relative abundance of different bacterial and archaeal phyla at each zone, and these proportions were determined using kaiju to assign taxonomy to trimmed metagenomic reads.
Figure 2
Figure 2
Viral community composition across zones. Viral homology at the species level was determined for 258 viruses, making up only ~25% of the total abundance and activity of all viruses in the community. The proportion of the top viral species for each zone is shown for metagenomic (DNA) and metatranscriptomic (RNA) data, with less abundant species being grouped together. Proportional abundance within a zone is determined from RPKM normalization, taking genome length and reads mapped as normalization factors.
Figure 3
Figure 3
Phylogenetic diversity of eukaryotic viruses. (A) a phylogeny of the giant virus (NCLDV) major capsid protein (MCP) with reference sequences from the GVDB. Reads were mapped to MCPs and abundance and activity are represented for each zone as log normalized TMM values. (B) a phylogenetic tree showing identified MCPs from Polintons, PLVs, and Virophages from all zones as well as their abundance. Reference sequences were obtained from Stephens et al. [65]. Reads were similarly mapped to MCPs and abundance and activity of individuals is shown in the heatmap. The outer ring represents the site where the MCP was recovered from.
Figure 4
Figure 4
Predicted and potential hosts for prokaryotic and eukaryotic viruses. (A) Virus-host predictions for prokaryotic viruses were done using iPHOP for all zones. A total of 36 host predictions were made across zones and band thickness represents more hosts from a given bacterial class or zone. (B) the potential eukaryotic host pool was created through mapping reads to confirmed eukaryotic contigs obtained from Tiara. These contigs were classified to the phylum level using CAT and proportions represent RPKM values for each zone.
Figure 5
Figure 5
Active viral ecology and gene expression. (A) Viruses from each zone were categorized as either being “highly active”, “active + abundant”, “abundant, non-active”, and “non-abundant, non-active” based on hierarchical clustering of activity and abundance ratios. (B) Rank abundance curves for each zone with the line representing metagenomic (abundance) read mapping and the bars representing metatranscriptomic (activity) data. Both read counts were normalized with RPKM. The gene expression profiles of (C) highly active and (D) other viruses. The top 20 genes (derived from sum RPKM) from each group are displayed in descending order. Categories were created based on gene annotations found within the PFAM database.
Figure 6
Figure 6
Zone specific marker genes and AMGs. (A) Viruses that were deemed “exclusive” to a certain zone (see Fig. 2) were displayed on a three-dimensional scatter plot with axes representing the log TMM of activity data from each zone. (B) within each zone-specific cluster, the top 18 genes (by sum TMM) within that zone were plotted. COG categories were assigned based on eggNOG annotations [F: Nucleotide metabolism, G: Carbohydrate metabolism, H: Coenzyme metabolism, K: Transcription, L: Replication and repair, M: Cell wall/membrane biogenesis, N: Cell motility, O: Post-translational modification, Q: Secondary metabolite biosynthesis, S: Unknown, T: Signal transduction]. (C) AMGs were obtained from viruses at each zone and reads were mapped to calculate activity. This heatmap shows across-zone normalized Z-scores from TMM values.
Figure 7
Figure 7
Jumbo phages and their hosts. (A) Genome maps of two identified jumbo phages were created using pharokka. GC skew, GC content, and gene categories were displayed on each track. (B) Reads were mapped to each jumbo phage genome and normalized using TMM across zones. Abundance and activity for each phage at each zone is represented here. The metabolic profile of the CRISPR-linked host of the OR jumbo phage is displayed through both a targeted and general approach. (C) Manganese oxidation and arsenic metabolism gene expression from all bacterial bins was calculated through read mapping to recovered genes and TMM normalization. Normalized reads were displayed as z-scores, normalized for within zone comparison to parse out key players in each process. The stars represent the OR jumbo host bacterial bin’s expression of these respective genes. (D) Reads were mapped to genes predicted from the OR host bacterial bin and normalized using RPKM. KEGG pathways were put into larger self-determined categories based on similar functions.
Figure 8
Figure 8
A conceptual model of brine pool virus ecology. An artistic rendition of our hypothesized prokaryotic viral ecology in the brine pool. Created with BioRender.com.

Similar articles

Cited by

References

    1. Anschutz P, Blanc G, Chatin Fet al. Hydrographic changes during 20 years in the brine-filled basins of the Red Sea. Deep-Sea Res I Oceanogr Res Pap 1999;46:1779–92. 10.1016/S0967-0637(99)00019-9 - DOI
    1. Schardt C. Hydrothermal fluid migration and brine pool formation in the Red Sea: the Atlantis II deep. Mineral Deposita 2016;51:89–111. 10.1007/s00126-015-0583-2 - DOI
    1. Ross DA, Hunt JM. Third brine pool in the Red Sea. Nature 1967;213:687–8. 10.1038/213687a0 - DOI
    1. Backer H, Schoell M. New deeps with brines and metalliferous sediments in the Red Sea. Nat Phys Sci 1972;240:153–8. 10.1038/physci240153a0 - DOI
    1. Aharon P, Roberts HH, Snelling R. Submarine venting of brines in the deep Gulf of Mexico: observations and geochemistry. Geology 1992;20:483–6. 10.1130/0091-7613(1992)020<0483:SVOBIT>2.3.CO;2 - DOI

LinkOut - more resources