. 2024 Jul 14;11(1):2377404.
doi: 10.1080/23723556.2024.2377404. eCollection 2024.

Amino acid deprivation in cancer cells with compensatory autophagy induction increases sensitivity to autophagy inhibitors

Affiliations

Amino acid deprivation in cancer cells with compensatory autophagy induction increases sensitivity to autophagy inhibitors

Takahito Fukui et al. Mol Cell Oncol. .

Abstract

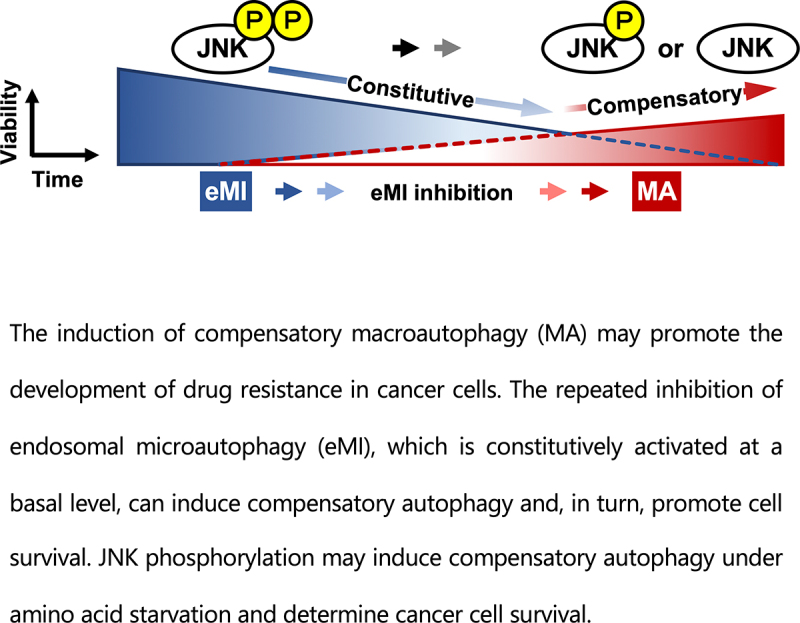
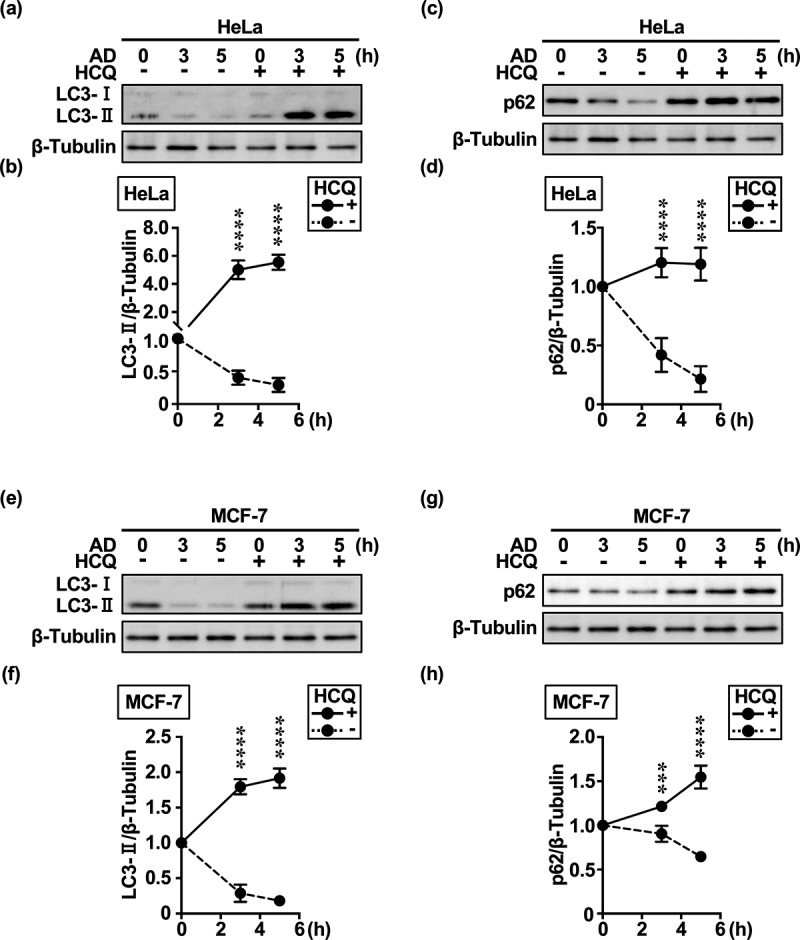
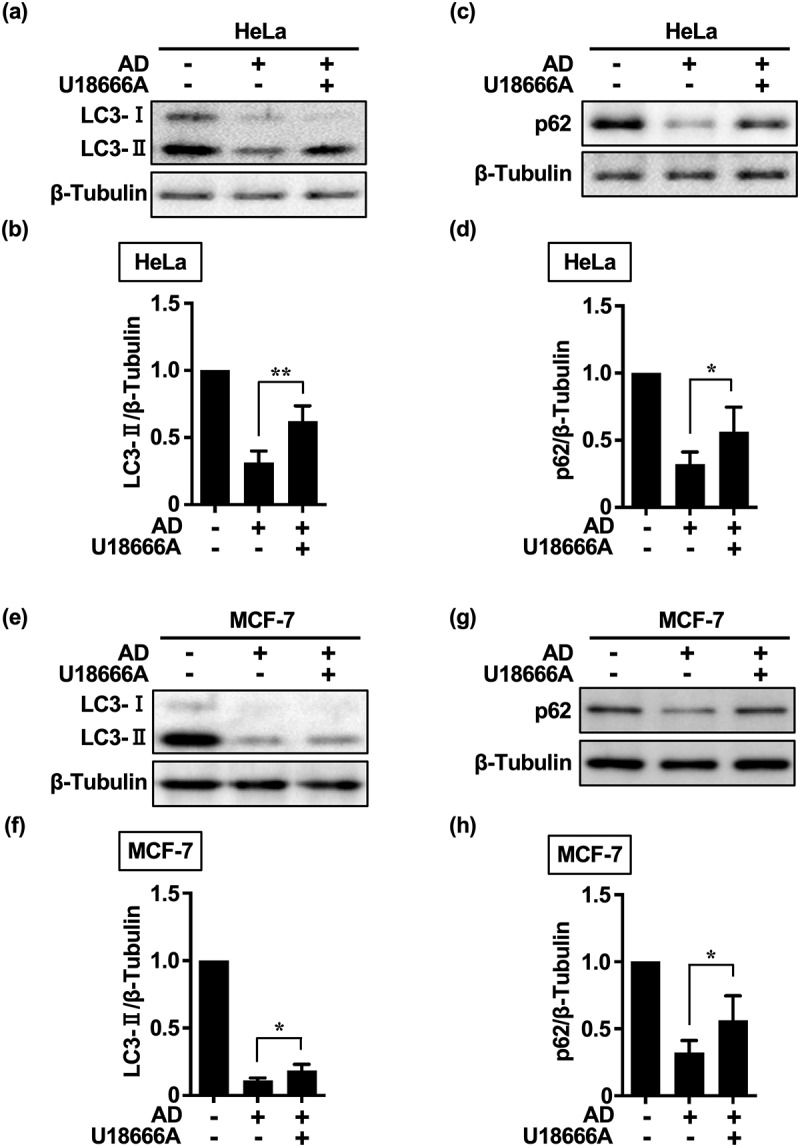
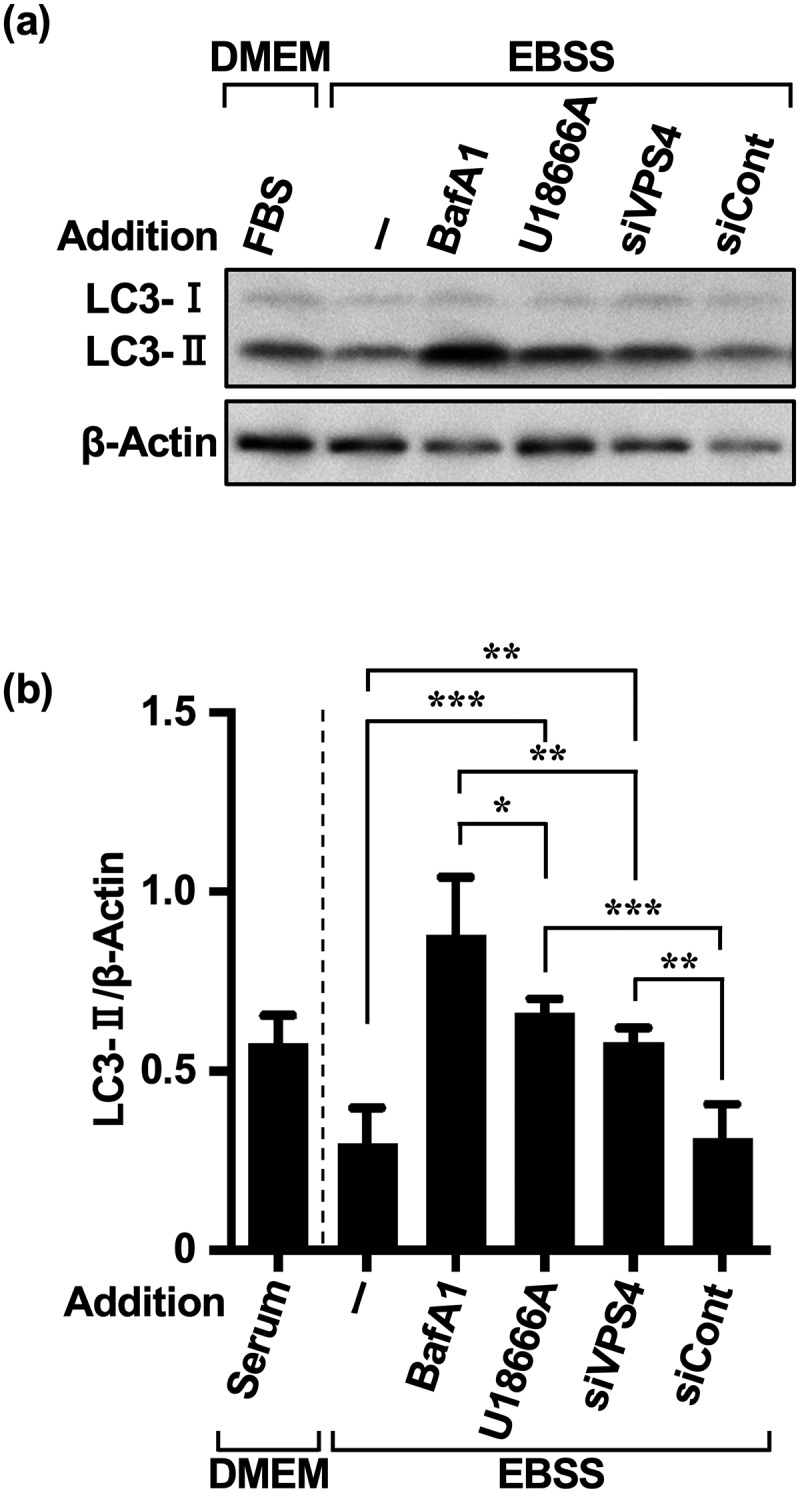
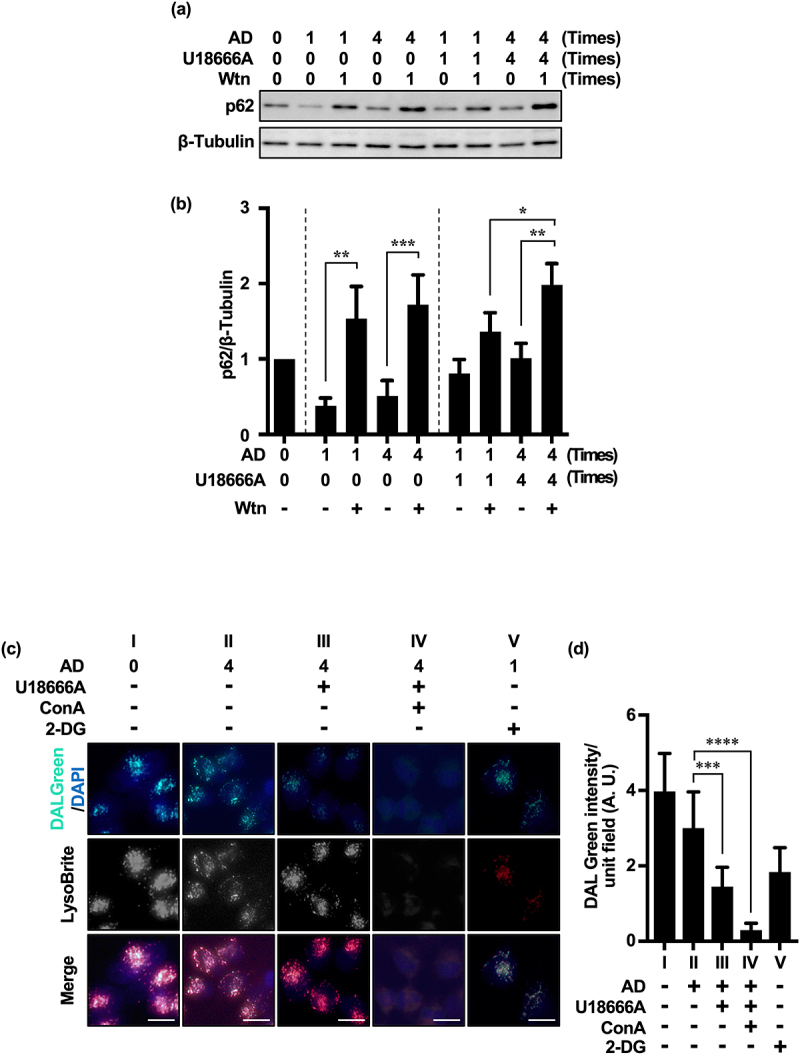
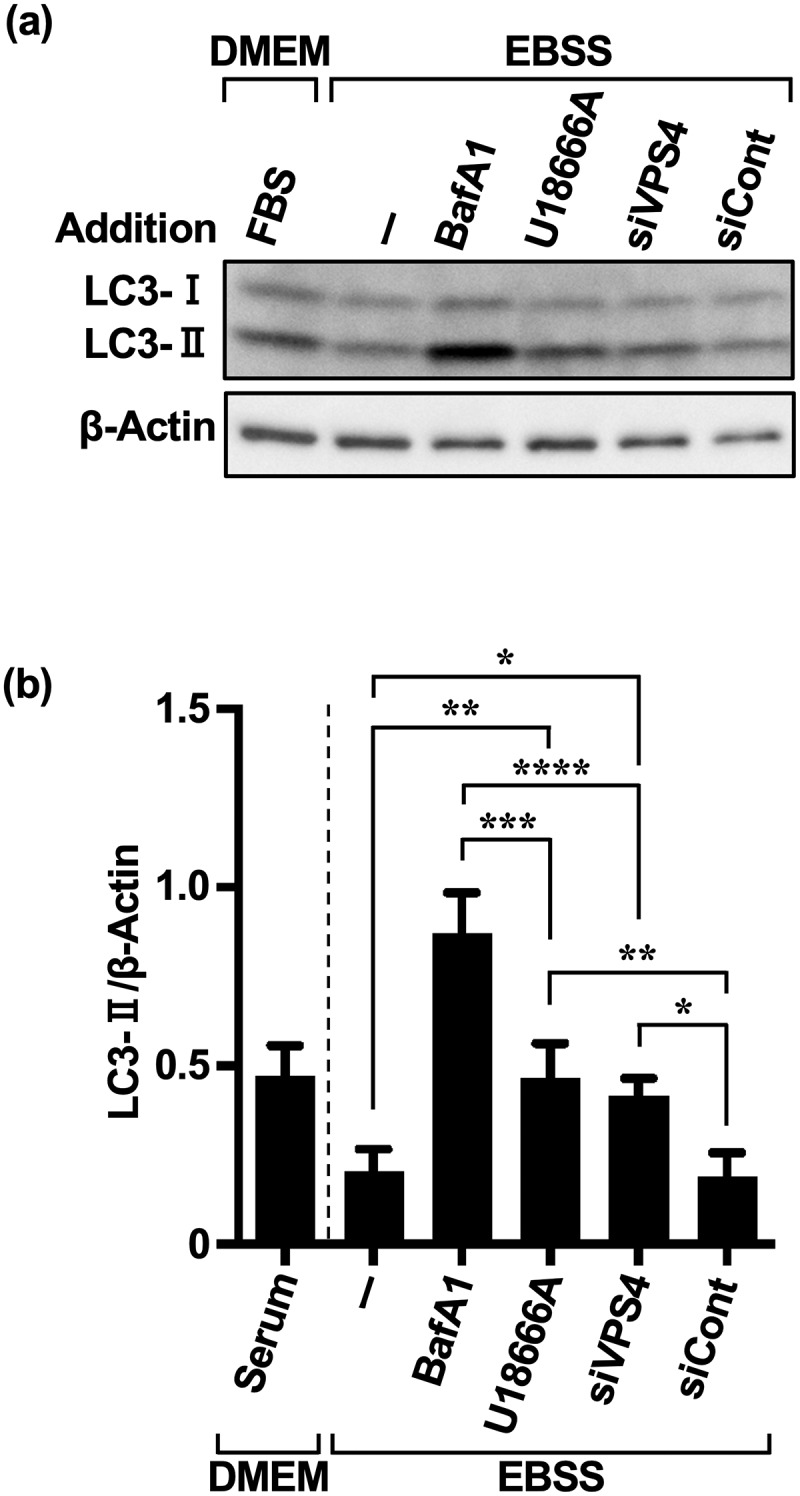
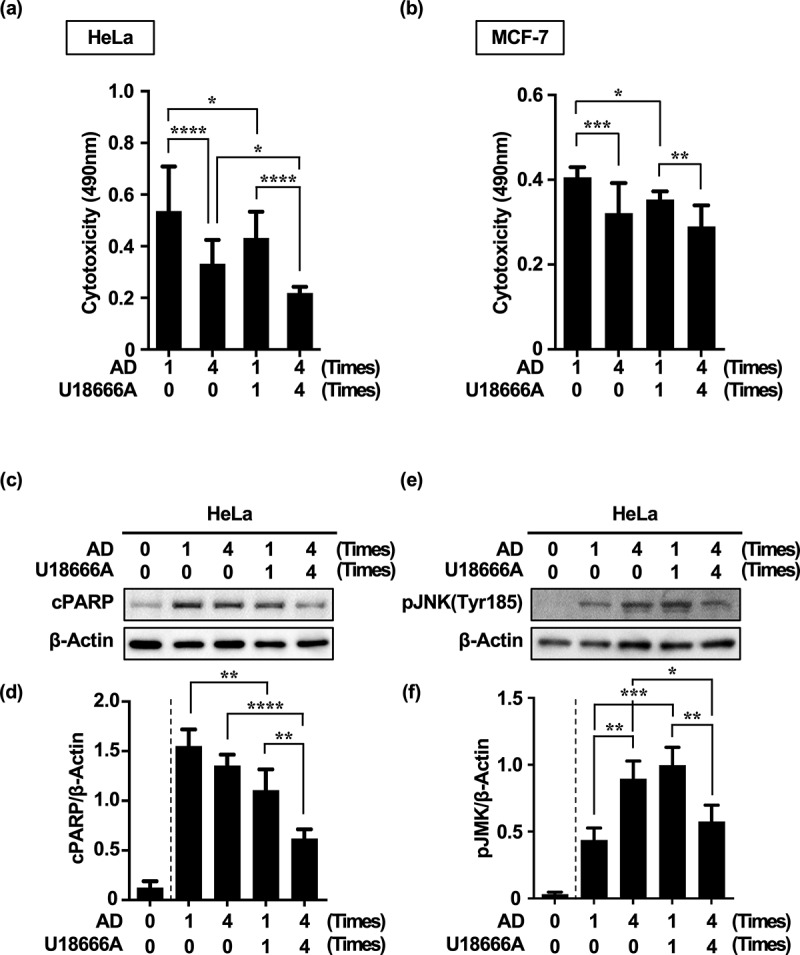
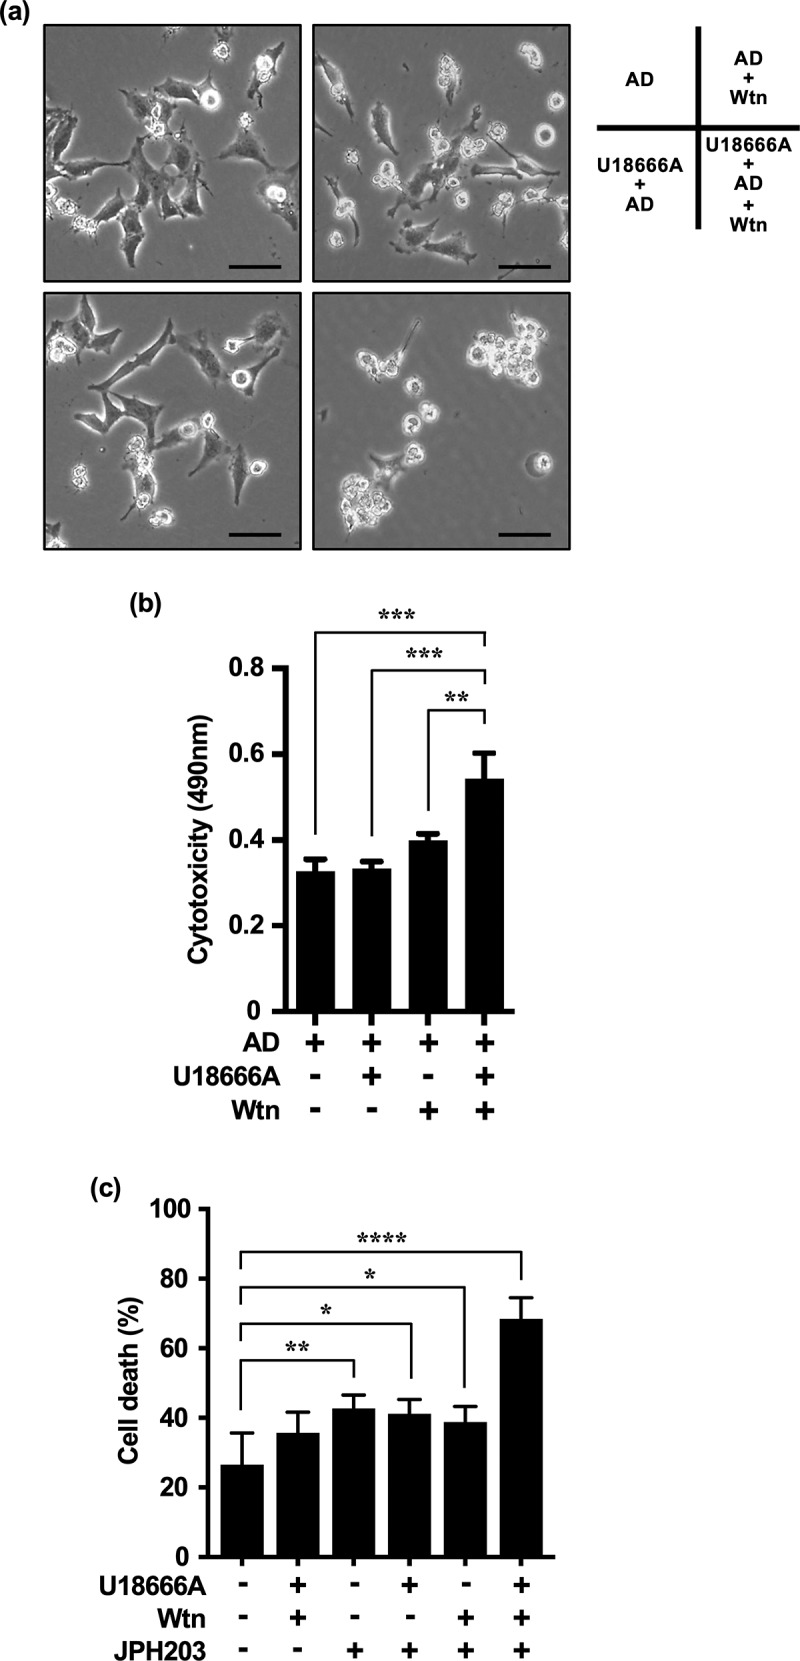
Inhibition of autophagy is an important strategy in cancer therapy. However, prolonged inhibition of certain autophagies in established cancer cells may increase therapeutic resistance, though the underlying mechanisms of its induction and enhancement remain unclear. This study sought to elucidate the mechanisms of therapeutic resistance through repeated autophagy inhibition and amino acid deprivation (AD) in an in vitro model of in vivo chronic nutrient deprivation associated with cancer cell treatment. In the human cervical cancer cell line HeLa and human breast cancer cell line MCF-7, initial extracellular AD induced the immediate expression of endosomal microautophagy (eMI). However, repeated inhibition of eMI with U18666A and extracellular AD induced macroautophagy (MA) to compensate for reduced eMI, simultaneously decreasing cytotoxicity. Here, hyperphosphorylated JNK was transformed into a hypophosphorylated state, suggesting conversion of the cell death signal to a survival signal. In a nutrient medium, cell death could not be induced by MA inhibition. However, since LAT1 inhibitors induce intracellular AD, combining them with MA and eMI inhibitors successfully promoted cell death in resistant cells. Our study identified a novel therapeuic approach for promoting cell death and addressing therapeutic resistance in cancers under autophagy-inhibitor treatment.

Keywords: Amino acid deprivation; amino acid transporter; autophagy; cancer; chemoresistance.


Conflict of interest statement

No potential conflict of interest was reported by the author(s).

Figures

None
Graphical abstract
Figure 1.
Figure 1.
HeLa and MCF-7 cells rapidly degrade LC3-II and p62 under extracellular AD. (a, c, e, g) Western blot images of LC3-II and p62 expression over time in response to extracellular AD in HeLa and MCF-7 cells. Western blot images were generated using 3 μg of cell extracts per well to evaluate changes in the amount of degradation and accumulation of LC3-II (a, e) and p62 (c, g) after AD in the absence or presence of HCQ (100 μM). (b, d, f, h) Quantification of LC3-II (b, f) and p62 (b, h) degradation (dashed lines) and accumulation (solid lines) over time. Results are expressed as the mean ± SD of three independent experiments. ***p < .001, ****p < .0001 (two-way ANOVA with Sidak’s multiple comparisons test). AD, amino acid deprivation; HCQ, hydroxychloroquine.
Figure 2.
Figure 2.
HeLa and MCF-7 cells induce endosome-mediated microautophagy under AD.
Figure 3.
Figure 3.
U18666A and AD treatments in HeLa and MCF-7 cells induce a different pathway from eMI. (a) Western blot images of HeLa cells treated with each inhibitor [BafA1 (50 nM), U18666A (5 μg/mL), siVPS4 (50 nM), and siCont (50 nM)] and AD. Cells were pretreated with BafA1 and U18666A for 3 and 1 h, respectively, washed, and exposed to EBSS for 5 h. Non-AD conditions were established using DMEM with 10% serum. (b) Quantification of LC3-II degradation and accumulation. *p < .05, **p < .01, ***p < .001, ****p < .0001 (two-way ANOVA with Tukey’s multiple comparisons test). AD, amino acid deprivation; BafA1, bafilomycin A1; EBSS, Earle’s balanced salt solution.
Figure 4.
Figure 4.
Repeated treatment with U18666A and AD induces MA in HeLa and MCF-7 cells. (a) Western blot image of p62 in HeLa cells after U18666A treatment (first time, 5 μg/mL, 5 h exposure; second and subsequent times, 2 μg/mL, 3 h exposure) followed by washing and 5 h of AD exposure. (b) Quantification of p62 degradation and accumulation. Results are expressed as the mean ± SD of three independent experiments. (c) In the fourth treatment, HeLa cells after three treatments with U18666A and AD were pretreated with EBSS alone (panel II), U18666A (2 μg/mL) and ConA (5 nM) for 3 h, respectively, washed and then treated with EBSS alone (panel III) or EBSS with ConA (panel IV) for 5 h, or pretreated with 2-DG (1 mM) for 3 h followed by EBSS (panel V) for 5 h. Note: panel I shows cells cultured under non-AD conditions (DMEM with 10% serum). Autolysosomes and functional lysosomes are indicated by green and red fluorescence, respectively. (d) Autolysosome-expressing cells as a percentage of total cells. n = 126 (panel I), n = 132 (panel II), n = 120 (panel III), n = 126 (panel IV), n = 123 (panel V); + and – in the graph footnotes indicate the presence or absence of a fourth U18666A, Wtn, or AD treatment. Results are expressed as the mean ± SD of three independent experiments. *p < .05, **p < .01, ***p < .001, ****p < .0001 (two-way ANOVA with Tukey’s multiple comparisons test). 2-DG, 2-deoxy-D-glucose; AD, amino acid deprivation; ConA, concanamycin A; Wtn, wortmannin.
Figure 5.
Figure 5.
Repeated treatment with U18666A and AD in HeLa and MCF-7 cells promotes MA dependence. (a) Western blot images of HeLa cells treated three times with U18666A and AD and a fourth treatment with each inhibitor [BafA1 (50 nM), U18666A (5 μg/mL), siVPS4 (50 nM), and siCont (50 nM)] and AD. Cells were pretreated with BafA1 and U18666A for 3 and 1 h, respectively, washed, and exposed to EBSS for 5 h. Non-AD conditions were established using DMEM with 10% serum. (b) Quantification of LC3-II degradation and accumulation. Results are expressed as the mean ± SD of four independent experiments. *p < .05, **p < .01, ***p < .001 (two-way ANOVA with Tukey’s multiple comparisons test). AD, amino acid deprivation; BafA1, bafilomycin A1; EBSS, Earle’s balanced salt solution.
Figure 6.
Figure 6.
Repeated treatment with U18666A and AD in HeLa and MCF-7 cells increases resistance to cell death. (a, b) Cytotoxicity in HeLa cells (a) and MCF-7 cells (b) treated four times with U18666A and AD based on LDH activity. (c, e) Western blot images of cPARP (c) and p-JNK (Tyr185) expression (e) in HeLa cells treated four times with U18666A and AD. (d, f) Quantification of cPARP (d) and p-JNK(Tyr185) (f) expression in HeLa cells. Numbers in the graph footnotes indicate the number of U18666A or AD treatments. Results are expressed as the mean ± SD of four independent experiments. *p < .05, **p < .01, ***p < .001, ****p < .0001 (two-way ANOVA with Tukey’s multiple comparisons test). AD, amino acid deprivation; cPARP; cleaved PARP; LDH; lactate dehydrogenase; p-JNK; phosphorylated JNK.
Figure 7.
Figure 7.
Combined effect of U18666A and Wtn on cells repeatedly treated with U18666A and AD is enhanced by LAT1 inhibition. (a, b) Cell morphology (a) and cytotoxicity assessment (b) after fourth stress exposure and three replicates U18666A and AD treatments in HeLa cells; for the fourth treatment, cells were pretreated with U18666A (2 μg/mL) for 3 h, washed, and then exposed to EBSS supplemented with Wtn (10 nM) for 8 h. For the third treatment, cells were treated with U18666A for 3 h, washed, and then exposed to EBSS supplemented with Wtn (10 nM) for 8 h. For the second treatment, cells were treated with U18666A for 3 h, washed, and then exposed to EBSS supplemented with Wtn (10 nM) for 8 h. (c) Cell death rate induced in HeLa cells after three repeated treatments with U18666A and AD and a fourth treatment with serum-free medium only; U18666A (2 μg/mL), Wtn (10 nM), and JPH203 (3 mM) alone; U18666A+JPH203, Wtn+JPH203, and U18666A+JPH203, respectively; or 12 h of incubation with Wtn+JPH203. The percentage of dead cells was quantified using trypan blue staining (n > 57,600 cells/condition). Results are expressed as the mean ± SD of four independent experiments. *p < .05, **p < .01, ***p < .0001 (two-way ANOVA with Tukey’s multiple comparisons test). AD, amino acid deprivation; Wtn, wortmannin.

Similar articles

References

    1. Kaushik S, Cuervo AM.. The coming of age of chaperone-mediated autophagy. Nat Rev Mol Cell Biol. 2018;19(6):365–14. doi:10.1038/s41580-018-0001-6. - DOI - PMC - PubMed
    1. Galluzzi L, Baehrecke EH, Ballabio A, Boya P, Bravo-San Pedro JM, Cecconi F, Choi AM, Chu CT, Codogno P, Colombo MI, et al. Molecular definitions of autophagy and related processes. Embo J. 2017;36(13):1811–1836. doi:10.15252/embj.201796697. - DOI - PMC - PubMed
    1. Jung CH, Jun CB, Ro SH, Kim YM, Otto NM, Cao J, Kundu M, Kim D-H. ULK-Atg13-FIP200 complexes mediate mTOR signaling to the autophagy machinery. Mol Biol Cell. 2009;20(7):1992–2003. doi:10.1091/mbc.e08-12-1249. - DOI - PMC - PubMed
    1. He C, Klionsky DJ. Regulation mechanisms and signaling pathways of autophagy. Annu Rev Genet. 2009;43(1):67–93. doi:10.1146/annurev-genet-102808-114910. - DOI - PMC - PubMed
    1. Berg TO, Fengsrud M, Strømhaug PE, Berg T, Seglen PO. Isolation and characterization of rat liver amphisomes: evidence for fusion of autophagosomes with both early and late endosomes. J Biol Chem. 1998;273(34):21883–21892. doi:10.1074/jbc.273.34.21883. - DOI - PubMed

LinkOut - more resources